| Oracle® Application Development Framework Developer's Guide For Forms/4GL Developers 10g Release 3 (10.1.3.0) Part Number B25947-02 |
|
|
View PDF |
| Oracle® Application Development Framework Developer's Guide For Forms/4GL Developers 10g Release 3 (10.1.3.0) Part Number B25947-02 |
|
|
View PDF |
This chapter describes the process of debugging your user interface project. It also supplies information about methods of the Oracle ADF Model API, which you can use to set breakpoints for debugging. Finally, it explains how to write and run regression tests for your ADF Business Components-based business services.
This chapter includes the following sections:
Section 24.1, "Getting Started with Oracle ADF Model Debugging"
Section 24.2, "Correcting Simple Oracle ADF Compilation Errors"
Section 24.4, "Understanding a Typical Oracle ADF Model Debugging Session"
Section 24.5, "Setting Up Oracle ADF Source Code for Debugging"
Section 24.8, "Regression Testing an Application Module With JUnit"
Like any debugging task, debugging the web application's interaction with Oracle ADF is a process of isolating specific contributing factors. However, in the case of web applications, generally, this process does not involve compiling Java source code. Your web pages contain no Java source code, as such, to compile. In fact, you may not realize that a problem exists until you run and attempt to use the application. For example, these failures are only visible at runtime:
Page not found servlet error
Page is found but the components display without data
Page fails to display data after executing a method call or built-in operation (like Next or Previous)
Page displays but a method call or built-in operation fails to execute at all
Page displays but unexpected validation errors occur
The failure to display data or to execute a method call arises from the interaction between the web page's components and the Oracle ADF Model layer. When a runtime failure is observed during ADF lifecycle processing, the sequence of preparing the model, updating the values, invoking the actions, and, finally, rendering the data failed to complete.
Fortunately, most failures in the web application's interaction with Oracle ADF result from simple and easy-to-fix errors in the declarative information that the application defines or in the EL expressions that access the runtime objects of the page's Oracle ADF binding container.
Therefore, in your Oracle ADF databound application, you should examine the declarative information and EL expressions as likely contributing factors when runtime failures are observed. Read the following sections to understand editing the declarative files:
The most useful diagnostic tool (short of starting a full debugging session) that you can use when running your application is the ADF Logger. You use this J2EE logging mechanism in JDeveloper to capture runtime traces messages from the Oracle ADF Model layer API. With ADF logging enabled, JDeveloper displays the application trace in the Message Log window. The trace includes runtime messages that may help you to quickly identify the origin of an application error. Read Section 24.4, "Understanding a Typical Oracle ADF Model Debugging Session" to configure the ADF Logger to display detailed trace messages.
As of June 28th, 2005, supported Oracle ADF customers can request Oracle ADF source code from Oracle Worldwide Support. This can make debugging Oracle ADF Business Components framework code a lot easier. Read Section 24.5, "Setting Up Oracle ADF Source Code for Debugging" to understand how to configure JDeveloper to use the Oracle ADF source code.
If the error cannot be easily identified, you can utilize the debugging tools in JDeveloper to step through the execution of the application and the various phases of the Oracle ADF page lifecycle. This process will help you to isolate exactly where the error occurred. By using the debugging tools, you will be able to pause execution of the application on specific methods in the Oracle ADF API, examine the data that the Oracle ADF binding container has to work with, and compare it to what you expect the data to be. Read Section 24.6, "Debugging the Oracle ADF Model Layer" to understand debugging the Oracle ADF Model layer.
Occasionally, you may need help debugging EL expressions. While EL is not well-supported with a large number of useful exceptions, you can enable JSF trace messages to examine variable resolution. Read Section 24.7, "Tracing EL Expressions" to work with JSF trace messages.
JDeveloper provides integration with JUnit for your ADF Business Components application through a wizard that generate regression test cases. Read Section 24.8, "Regression Testing an Application Module With JUnit" to understand how to write test suites for your application.
When you create web pages and work with the ADF data controls to create the ADF binding definitions in JDeveloper, the Oracle ADF declarative files you edit must conform to the XML schema defined by Oracle ADF. When an XML syntax error occurs, the JDeveloper XML compiler immediately displays the error in the Structure window. Choose Structure from the JDeveloper View menu to open the Structure window for any Oracle ADF file you edit in the XML editor.
Currently a limitation of the JDeveloper compiler is the ability to resolve EL expressions. EL expressions in your web pages interact directly with various runtime objects in the web environment, including the web page's Oracle ADF binding container. At present, errors in EL expressions can be observed only at runtime. Thus, the presence of a single typing error in an object-access expression will not be detected by the compiler, but will manifest at runtime as a failure to interact with the binding container and a failure to display data in the page. For information about debugging runtime errors, see Section 24.3, "Correcting Simple Oracle ADF Runtime Errors".
Tip:
The JDeveloper Expression Builder is a dialog that helps you build EL expressions by providing lists of objects, managed beans, and properties. It is particularly useful when creating or editing ADF databound EL expressions because it provides a hierarchical list of ADF binding objects and their valid properties from which you can select the ones you want to use in an expression. Oracle recommends using the Expression Builder to avoid introducing typing errors. For details, see Section 12.6.2, "How to Use the Expression Builder".Example 24-1 illustrates simple compilation errors contained in the page definition file: "fase" instead of "false" and "IsQueriable="false"/" instead of "IsQueriable="false"/>" (missing a closing angle bracket).
Example 24-1 Sample Page Definition File with Two Errors
<?xml version="1.0" encoding="UTF-8" ?>
<pageDefinition xmlns="http://xmlns.oracle.com/adfm/uimodel"
                version="10.1.3.35.62" id="browseusersPageDef"
                Package="oracle.srdemo.view.pageDefs"
                EnableTokenValidation="fase"
               ...>
  <parameters/>
  <executables>
    <variableIterator id="variables">
      <variable Type="java.lang.String" Name="findUsersByName_name"
                IsQueriable="false"/
The Structure window for the above errors would display as shown in Figure 24-1.
If you were to attempt to compile the application, the Compiler window would also display similar errors, as shown in Figure 24-2.
To correct schema validation errors, in either the Structure window or the Compiler window, double-click the error to open the file. The file will open in the XML editor with the responsible line highlighted for you to fix.
After you correct the error, the Structure window will immediately remove the error from the window. Optionally, you may recompile the project using the make operation to recompile the changed file and view the empty Compiler window.
Failures of the Oracle ADF Model layer cannot be detected by the JDeveloper compiler, in part, because the page's data-display and method-execution behavior relies on the declarative Oracle ADF page definition files. The Oracle ADF Model layer utilizes those declarative files at runtime to create the objects of the Oracle ADF binding container.
To go beyond simple schema validation, you will want to routinely run and test your web pages to ensure that one of the following conditions does not exist:
The project dependency between the data model project and the user interface project becomes disabled.
By default, the dependency between projects is enabled whenever you create a web page that accesses a data control in the data model project. However, if the dependency is disabled and remains disabled when you attempt to run the application, an internal servlet error will be generated at runtime:
oracle.jbo.NoDefException: JBO-25002: Definition model.DataControls.dcx of type null not found
To correct the error, right-click the user interface project, choose Project Properties, and select Dependencies in the dialog. Make sure that the <ModelProjectName>.jpr option appears selected in the panel.
The DataBindings.cpx file location changed but the web.xml file still references the original path for the file.
By default, JDeveloper adds the DataBindings.cpx file to the package for your user interface project. If a change to the location of the file is made (for example, due to refactoring the application), an internal servlet error will be generated at runtime:
oracle.jbo.NoXMLFileException: JBO-26001: XML File not found for the Container /oracle/<path>/DataBinding.cpx
To correct the error, open the web.xml file and edit the path that appears in the <context-param> element CpxFileName.
Page definition files have been renamed but the DataBindings.cpx file still references the original page definition filenames.
While JDeveloper does not permit these files to be renamed within the IDE, if a page definition file is renamed outside of JDeveloper and the references in the DataBindings.cpx file are not also updated, an internal servlet error will be generated at runtime:
oracle.jbo.NoDefException: JBO-25002: Definition oracle.<path>.pageDefs.<pagedefinitionName> of type Form Binding Definition not found
To correct the error, open the DataBindings.cpx file and edit the page definition filenames that appear in the <pageMap> and <pageDefinitionUsages> elements.
The web page file (.jsp or.jspx) has been renamed but the DataBindings.cpx file still references the original filename of the same web page.
The page controller uses the page's URL to determine the correct page definition to use to create the ADF binding container for the web page. If the page's name from the URL does not match the <pageMap> element of the DataBindings.cpx file, an internal servlet error will be generated at runtime:
javax.faces.el.PropertyNotFoundException: Error testing property <propertyname>
To correct the error, open the DataBindings.cpx file and edit the web page filenames that appear in the <pageMap> element.
Bindings have been renamed in the web page EL expressions but the page definition file still references the original binding object names.
The web page may fail to display information that you expect to see. To correct the error, compare the binding names in the page definition file and the EL expression responsible for displaying the missing part of the page. Most likely the mismatch will occur on a value binding, with the consequence that the component will appear but without data. Should the mismatch occur on an iterator binding name, the error may be more subtle and may require deep debugging to isolate the source of the mismatch.
Bindings in the page definition file have been renamed or deleted and the EL expressions still reference the original binding object names.
Because the default error-handling mechanism will catch some runtime errors from the ADF binding container, this type of error can be very easy to find. For example, if an iterator binding (named findUsersByNameIter) was renamed in the page definition file, yet the page still refers to the original name, this error will display in the web page:
JBO-25005: Object name findUsersByNameIter for type Iterator Binding Definition is invalid
To correct the error, right-click the name in the web page and choose Go to Page Definition to locate the correct binding name to use in the EL expression.
EL expressions were written manually instead of using the Expression Picker dialog and invalid object names or property names were introduced.
This error may not be easy to find. Depending on which EL expression contains the error, you may or may not see a servlet error message. For example, if the error occurs in a binding property with no runtime consequence, such as displaying a label name, the page will function normally but the label will not be displayed. However, if the error occurs in a binding that executes a method, an internal servlet error javax.faces.el.MethodNotFoundException: <methodname> will display. Or, in the case of an incorrectly typed property name on the method expression, the servlet error javax.faces.el.PropertyNotFoundException: <propertyname> will display. For information about displaying JSF trace messages to help debug these exception, see Section 24.7, "Tracing EL Expressions".
If the above list of typical errors does not help you to find and fix a runtime error, you can initiate debugging within JDeveloper in order to isolate the contributing factor. This process involves pausing the execution of the application as it proceeds through the phases of the Oracle ADF page lifecycle, examining the data received by the lifecycle, and determining whether that data is expected or not. To inspect the data of your application, you will work with source code breakpoints and Data window, as described in Section 24.4, "Understanding a Typical Oracle ADF Model Debugging Session".
If you are not able to easily find the error in your web page or its corresponding page definition file, you can use the JDeveloper debugging tools to investigate where your application failure occurs. Specifically, the goal for debugging the interaction between the web page and the Oracle ADF Model layer is to pause the application by setting breakpoints on the execution of the Oracle ADF page lifecycle and to examine the data loaded at runtime. When the objects of the Oracle ADF Model layer do not contain the data that you expect to see, this observation will help you to identify the probable contributing factor.
Generally, the process for debugging proceeds like this:
Run the application and look for missing or incomplete data, actions and methods that are ignored or incorrectly executed, or other unexpected results.
Create a debugging configuration that will enable the ADF Log and send Oracle ADF Model messages to the JDeveloper Log window. For more information, see Section 24.4.2, "Creating an Oracle ADF Debugging Configuration".
Choose Go to Java Class from the Navigate menu (or press Ctrl + -) and use the dialog to locate the Oracle ADF class that represents the entry point for the processing failure.
Tip:
JDeveloper will locate the class from the user interface project that has the current focus in the Application Navigator. If your workspace contains more than one user interface project, be sure the one with the current focus is the one that you want to debug.Open the class file in the Java editor and find the Oracle ADF method call that will enable you to step into the statements of the method.
Set a breakpoint on the desired method and run the debugger.
When the application stops on the breakpoint, use the Data window to examine the local variables and arguments of the current context.
Once you have set breakpoints to pause the application at key points, you can proceed to view data in the JDeveloper Data window. To effectively debug your web page's interaction with the Oracle ADF Model layer, you need to understand:
The Oracle ADF page lifecycle and the method calls that get invoked
The local variables and arguments that the Oracle ADF Model layer should contain during the course of application processing
Awareness of Oracle ADF processing, as described in Section 24.6, "Debugging the Oracle ADF Model Layer", will give you the means to selectively set breakpoints, examine the data loaded by the application, and isolate the contributing factors.
Note:
JSF web pages may also use backing beans to manage the interaction between the page's components and the data. Debug backing beans by setting breakpoints as you would any other Java class file.Even before you use the actual debugger, running with framework diagnostics logging turned on can be helpful to see what happened when the problem occurs. To turn on diagnostic logging set the Java System property named jbo.debugoutput to the value console. Additionally, the value ADFLogger lets you route diagnostics through the standard J2SE Logger implementation, which can be controlled in a standard way through the OC4J j2ee-logging.xml file.
The easiest way to set this system property while running your application inside JDeveloper is to edit your project properties and in the Run/Debug panel, select a run configuration and click Edit to edit it. Then add the string -Djbo.debugoutput=console to the Java Options field.
ADF Faces leverages the Java Logging API (java.util.logging.Logger) to provide logging functionality when you run a debugging session. Java Logging is a standard API that is available in the Java Platform, starting with JDK 1.4. For the key elements, see the section "Java Logging Overview" at http://java.sun.com/j2se/1.4.2/docs/guide/util/logging/overview.html.
Because standard Java Logging is used, you can edit the j2ee-logging.xml file to control the level of diagnostics you receive in the Log window:
When you conduct a debugging session within JDeveloper, you will use JDeveloper embedded-OC4J and will want to modify the file in your JDeveloper install here:
<JDev_Install>/jdev/system/oracle.j2ee.10.1.3.xx.xx/embedded-oc4j/config
Similarly, when you want to conduct a remote debugging session on Oracle Application Server, you can modify the file here:
<OAS_Home>/j2ee/<OC4J_INSTANCE>/config
Or, when you want to conduct a remote debugging session on standalone OC4J, you can modify the file here:
<OC4J_Home>/j2ee/home/config
To edit ADF package-level logging in the j2ee-logging.xml file:
If you want to change the logging level for Oracle ADF, you can edit the <logger> elements of the configuration file.
Note:
By default the level is set toINFO for all packages of Oracle ADF. However, Oracle recommends level="FINE" for detailed logging diagnostics.For the packages oracle.adf.view.faces and oracle.adfinternal.view.faces, edit:
<logger name="oracle.adf" level="INFO"/><logger name="oracle.adfinternal" level="INFO"/>
For the Oracle ADF Model layer packages, edit these elements:
<logger name="oracle.adf" level="INFO"/><logger name="oracle.jbo" level="INFO"/>
Alternatively, you can create a debug configuration in JDeveloper that you can choose when you start a debugging session.
To create an Oracle ADF Model debugging configuration:
In the Application Navigator, double-click the user interface project.
In the Project Properties dialog, click Run/Debug and create a new run configuration, for example, named ADF debugging.
Double-click the new run configuration to edit the properties.
In the Edit Run Configuration dialog, for Launch Settings, enter the following Java Options for the default ojvm virtual machine:
-Djbo.debugoutput=adflogger -Djbo.adflogger.level=FINE
Oracle recommends the level=FINE for detailed diagnostic messages.
Often you will find it useful to debug the ADF Business Components in your application without having to run the user interface of your ADF application. You are likely already aware that you can select any application module in the Application Navigator, and choose Test from its right-mouse context menu to launch the Business Components Tester tool.
What you might not know is that you can also launch the Tester tool in the debugger. This can be extremely useful and can make debugging ADF Business Components applications even easier than having to start up the complete frontend GUI of your application.
To launch an ADF Application Module in the tester in debug mode, do the following:
In the Application Navigator, select the desired application module.
In the Structure Window, expand the Sources folder, and select the Java implementation class for your application module.
If you application module is called MyModule, its implementation class will be named MyModuleImpl.java.
Select Debug from the context menu on that application module implementation class to launch the debugger.
You'll notice that the main() method of your application module Java class looks like this:
public static void main(String[] args) {
  launchTester("com.yourcompany.yourapp.model", /* package name */
               "MyModuleLocal");                /* Configuration Name */
}
If you need to launch the application module in the debugger using a different configuration than the one indicated (e.g. MyModuleLocal in the code sample above), just change the string that gets passed as the second argument to launchTester() to be the name of the configuration you want to use instead.
Tip:
When you debug the application module implementation class (by selecting the.java file in the System Navigator), you don't have to change configuration name since it is written into the main() method as one of the two strings that get passed to the debugger. However, when you debug the application module using the Business Components Tester (by choosing Test from the context menu on the application module node in the Application Navigator), your configuration must use a JDBC URL connection (not a JDBC DataSource). For example, in the SRDemo application, the configuration SRServiceLocalTesting lets you run the Tester. By default, the selected configuration will be SRServiceLocal. If you do not change the configuration choice, an alert will indicate that the Tester cannot use a JDBC DataSource connection.You first need to understand the different kinds of breakpoints and where to create them.
To see the Debugger Breakpoints window, use the View | Debugger > Breakpoints menu choice from the main JDeveloper menu, or optionally the key accelerator for this: [Ctrl]+[Shift]+[R].
You can create a new breakpoint by selecting the New Breakpoint menu choice from the right-mouse menu anywhere in the breakpoints window. The Breakpoint Type dropdown list controls what kind of breakpoint you will create. The valid choices are:
Exception — break whenever an exception of this class (or a subclass) is thrown.
This is great when you don't know where the exception occurs, but you know what kind of exception it is (e.g. java.lang.NullPointerException, java.lang.ArrayIndexOutOfBoundsException, oracle.jbo.JboException, etc.) The checkbox options allow you to control whether to break on caught or uncaught exceptions of this class. The (Browse...) button helps you find the fully-qualified class name of the exception. The Exception Class combobox remembers most recently used exception breakpoint classes. Note that this is the default breakpoint type when you create a breakpoint in the breakpoints window.
Source — break whenever a particular source line in a particular class in a particular package is run.
You rarely create a source breakpoint in the New Breakpoint window. This is because it's much easier to create it by first using the Navigate | Go to Class menu (accelerator [Ctrl]+[Shift]+[Minus]), then scrolling to the line number you want -- or using Navigate | Go to Line (accelerator [Ctrl]+[G]) -- and finally clicking in the breakpoint margin at the left of the line you want to break on. This is equivalent to creating a new source breakpoint, but it means you don't have to type in the package, class, and line number by hand.
Method — break whenever a method in a given class is invoked.
This is handy to set breakpoints on a particular method you might have seen in the call stack while debugging a problem. Of course, if you have the source you can set a source breakpoint wherever you want in that class, but this kind of breakpoint lets you stop in the debugger even when you don't have source for a class.
Class — break whenever any method in a given class is invoked.
This can be handy when you might only know the class involved in the problem, but not the exact method you want to stop on. Again, this kind of breakpoint does not require source. The Browse button helps you quickly find the fully-qualified class name you want to break on.
Watchpoint — break whenever a given field is accessed or modified.
This can be super helpful to find a problem if the code inside a class modifies a member field directly from several different places (instead of going through setter or getter methods each time). You can stop the debugger in its tracks when any field is modified. You can create a breakpoint of this type by using the Toggle Watchpoint menu item on the right-mouse menu when pointing at a member field in your class' source.
After creating a breakpoint you can edit the breakpoint in the breakpoints window by selecting Edit in the context menu on the desired breakpoint.
Some really interesting features you can use by editing your breakpoint are:
Associate a logical "breakpoint group" name to group this breakpoint with others having the same breakpoint group name. Breakpoint groups make it easy to enable/disable an entire set of breakpoints in one operation.
Associate a debugger action to occur when the breakpoint is hit. The default action is to just stop the debugger so you can inspect things, but you can add a beep, write something to a log file, and enable or disable group of breakpoints.
Associate a conditional expression with the breakpoint so that it the debugger only stops when that condition is met. In 10.1.3, the expressions can be virtually any boolean expression, including:
expr ==value
expr.equals("value")
expr instanceoffully.qualified.ClassName
Note:
Use the debugger watch window to evaluate the expression first to make sure its valid.An excellent but often overlooked feature of the JDeveloper debugger is the ability to filter the members you want to see in the debugger window for any class. In the debugger's Data window, pointing at any item and selecting Object Preferences from the right-mouse context menu brings up a dialog that lets you customize which members appear in the debugger and (more importantly sometimes) which members don't appear. These preferences are set by class type and can really simplify the amount of scrolling you need to do in the debugger data window. This is especially useful while debugging when you might only be interested in a handful of a class' members.
Interesting breakpoints you can set in Oracle ADF source code when you're trying to debug a problem are:
Exception breakpoint for oracle.jbo.JboException
When you're not sure where to start, this is the base class of all ADF Business Components runtime exceptions.
Exception breakpoint for oracle.jbo.DMLException
This is the base class for exceptions originating from the database, like a failed DML operation due to an exception raised by a trigger or by a constraint violation.
Source breakpoint in the doIt() method of JUCtrlActionBinding class (oracle.jbo.uicli.binding package).
This is the method that will execute when any ADF action binding is invoked, and you can step into the logic and look at parameters if relevant.
Method breakpoint in the oracle.jbo.server.ViewObjectImpl.executeQueryForCollection method.
This is the method that will be called when a view object executes its SQL query.
Method breakpoint in the oracle.jbo.server.ViewRowImpl.setAttributeInternal method.
This is the method that will be called when any view row attribute is set.
Method breakpoint in the oracle.jbo.server.EntityImpl.setAttributeInternal method.
This is the method that will be called when any entity object attribute is set.
By looking at the stack window when you hit these breakpoints, and stepping through the source you can get a better idea of what's going on.
If you are unable to determine what the problem is and resolve it yourself, typically your next step is to ask someone else for assistance. Whether you post a question in the OTN JDeveloper Discussion Forum or open a Service Request on Metalink, including the stack trace information in your posting is extremely useful to anyone who will need to assist you further to understand exactly where the problem is occurring.
JDeveloper's Stack window makes communicating this information easy. Whenever the debugger is paused, you can view the Stack window to see the program flow as a stack of method calls that got you to the current line. Using the right-mouse Preferences menu on the Stack window background, you can set the Stack window preference to include the Line number information as well as the class and method name that will be there by default. Finally, the other useful context menu option Export lets you save the current stack information to an external text file whose contents you can then post or send to whomever might need to help you diagnose the problem.
You can obtain complete source code for Oracle ADF by opening a service request with Oracle Worldwide Support and requesting it. This section explains how to use Oracle ADF source code for debugging purposes inside the Oracle JDeveloper environment.
Note:
The instructions below assume you have extracted theadf_1013_3673_source.zip archive into the root C:\ directory to create a C:\adf_1013_3673_source directory, and that your JDeveloper home directory is C:\jdev1013. If you have JDeveloper installed in a different directory, you'll need to substitute that instead.The first step requires you to define a system library that points to the adfsource.zip file. To accomplish this task, follow these steps:
Select Tools | Manage Libraries to display the Manage Libraries dialog.
With the Libraries tab selected, click on the System Libraries folder in the tree at the left and click the New button
Enter a library name. For example, ADF Source.
Enter a source path of C:\adf_1013_3673_source\adfsource.zip
Note:
Notice the Class Path field is blank. You only need to provide a value for the Source Path field.Uncheck the Deployed by Default checkbox.
Click OK to close the Manage Libraries dialog.
In order to debug any application using Oracle ADF inside JDeveloper, you just need to add your new ADF Source system library created above to the library list of the project you plan to debug. To accomplish this task, follow these steps:
Select the project that you will be debugging in the Application Navigator.
Choose Project Properties from the right mouse menu to show the Project Properties dialog.
Select the Libraries category in the tree at the left (by default, under the Development profile).
Select the ADF Source library in the Available Libraries list on the left
Click the (>) button to move this library into your project's Selected Libraries list.
Click OK to close the Project Properties dialog.
Once you have added the ADF Source library to your project, you instantly have access to the helpful Quick JavaDoc feature ([Ctrl]+[D]) that the JDeveloper Code Editor makes available. As shown in Figure 24-3, invoking the Quick JavaDoc on a method like findSessionCookie().
After performing the two steps above, you can debug any Oracle ADF code for the current project in the same way as you have been doing for your own Java code. This means that you can press [Ctrl]+[Minus] to type in any class name in Oracle ADF, and JDeveloper will open its source file automatically so you can set breakpoints as desired.
When debugging Oracle ADF source, as shown in Figure 24-4 by default you will not see symbol information for parameters or member variables of the currently executing method.
This can make debugging a little less useful. You can make the situation better by using the debug versions of the ADF JAR files supplied along with the source, while debugging in your development environment.
Note:
The supplied debug libraries are not recommended for use in a test or production environment since they typically have slightly slower runtime performance than the optimized JAR files shipped with JDeveloper.The debuglib subdirectory of C:\adf_1013_3673_source contains versions of Oracle ADF JAR files from JDeveloper 10.1.3 Build 3673 that have been compiled with additional debug information. When you use these debug JAR files instead of the default optimized JAR files you will see all of the information in the debugger as shown in Figure 24-5.
In order to use these debug JAR files, perform the following steps:
Make sure JDeveloper 10g is not running. If it's currently running, exit from the product before proceeding with the subsequent steps.
Make a backup subdirectory of all existing optimized JAR files in the ./BC4J/lib directory of your JDeveloper installation:
C:\> cd jdev1013\BC4J\lib
C:\jdev1013\BC4J\lib> mkdir backup
C:\jdev1013\BC4J\lib> copy *.jar backup
Notice that the debuglib subdirectory of C:\adf_1013_3673_source contains debug versions of the same ADF JAR files as the ones you just made a backup of. The only difference is that each debug JAR file has the suffix _g.jar instead of just.jar.
For each ADF library that you want to have debug symbols for while debugging, copy the _g.jar version of the matching library over the existing, corresponding library in the C:\jdev1013\BC4J\lib directory. This is safe to do since you made a backup of the optimized JAR files in the backup directory in step 2 above.
For example, for the main ADF Business Components runtime JAR file (bc4jmt.jar), you would copy the C:\adf_1013_3673_source\debuglib\bc4jmt_g.jar to C:\jdev1013\BC4J\lib\bc4jmt.jar.
Since debug libraries typically run a little slower than libraries compiled without debug information, this diagnostic message is to remind you not to use debug libraries for performance timing.
**************************************************************************
*** WARNING: Oracle BC4J debug build executing - do not use for timing ***
**************************************************************************
To change back to the optimized libraries, simply copy the JAR file(s) in question from the ./BC4J/lib/backup directory back to the ./BC4J/lib directory.
The processing of your JSF page in combination with Oracle ADF Model is controlled by two classes:
oracle.adf.controller.faces.lifecycle.FacesPageLifecycle class
oracle.adf.controller.v2.lifecycle.PageLifecycleImpl class
FacesPageLifecycle implements certain methods of PageLifecycleImpl to provide customized error-handling behavior for ADF Faces applications. Generally, however, you will set breakpoints on PageLifecycleImpl, as this class provides the starting point for creating the objects of the Oracle ADF binding context.
Tip:
TheFacesPageLifecycle class provides the default implementation of the phase of the ADF Lifecycle. A good place to set a breakpoint is on the prepareModel() method, as it initiates the first phase of the ADF lifecycle. For details about the Oracle ADF lifecycle, see Section 13.2.3, "What Happens at Runtime: The JSF and ADF Lifecycles".The successful interaction between the web page and these objects of the Oracle ADF binding context ensures that the page's components display with correct and complete data, that methods and actions produce the desired result, and that the page renders properly with the appropriate validation errors.
At runtime, several things must happen before the ADF lifecycle can prepare the model and display the web page. When the first request for an ADF databound web page occurs, the servlet registers the Oracle ADF servlet filter ADFBindingFilter, named in the web.xml file. The method ADFBindingFilter.doFilter() sets up the ADF processing state, and the method ADFBindingFilter.initializeBindingContext() creates an instance of oracle.adf.model.BindingContext by reading the CpxFileName init parameter from the web.xml file.
Immediately after ADFBindingFilter.initializeBindingContext() is called, BindingContext is an empty container object that will define a hierarchy of the Oracle ADF Model layer objects. However, as the container object, BindingContext must exist in order for the page's binding to be created. If it does not, an internal servlet error for the Container /oracle/<path>/DataBinding.cpx will be thrown:
oracle.jbo.NoXMLFileException: JBO-26001: XML File not found
To debug creating the binding context for the web application:
In the oracle.adf.model.servlet.ADFBindingFilter class, set a break on chain.doFilter() and step into this method.
Set another break on ctx.get(BindingContext.IS_INITIALIZED) and step into this method.

In the oracle.jbo.uicli.mom.JUMetaObjectManager class, set a break on chain.getClientProjectExtension() and step into this method.
When processing pauses, look in slot0 for a file with the expected package name in the Data window.
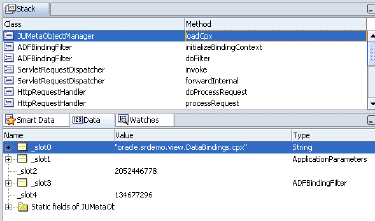
If the DataBindings.cpx file is not found, then check that the servlet context parameter element correctly defines the fully qualified name for the .cpx file and verify that the file exists in your project in the location specified by the qualified name path. Example 24-2 shows the context parameter for the SRDemo application.
Tip:
The name specified in theparam-value element of the context parameter must be the fully qualified name of the .cpx file.After BindingContext is created by ADFBindingFilter, the method PageLifeCycle.xXX() passes the request's web page URL to the method BindingContext.findBindingContainer() to find a page definition from the <pageMap> element in the DataBindings.cpx file that matches the web page. This becomes the BindingContainer. This BindingContainer object is the runtime instance object with all bindings created on it. If page definition file is not found, an internal servlet error will be thrown:
oracle.jbo.NoDefException: JBO-25002: Definition oracle.<path>.pageDefs.<pagedefinitionName> of type Form Binding Definition not found
To debug creating the binding container for the web page:
In the oracle.adf.model.BindingContext class, set a break on findBindingContainerIdByPath() and step into this method.
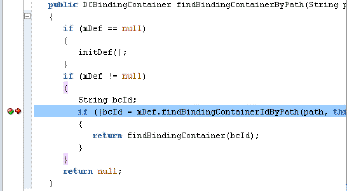
Look for the name of the databound web page associated with the binding container in the Data window.
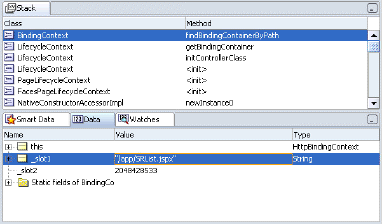
In the Smart Data window, look for a matching entry for the expected databound web page file name.
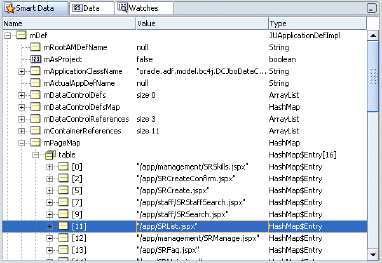
In the Data window, there should be a matching page definition entry for the databound web page.
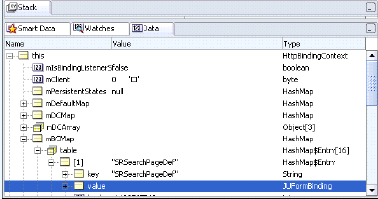
If the <pagename>PageDef.xml file is not found, then check that the <pageMap> element in the DataBindings.cpx file specifies the correct name and path to the web page in your project. Example 24-3 shows a sample DataBindings.cpx file for the SRDemo application. Notice that the <pageMap> element maps the JSF page to its page definition file
CAUTION:
If you change the name of a JSF page or a page definition file, the.cpx file is not automatically refactored. You must manually update the page mapping in the .cpx to reflect the new page name.Example 24-3 Sample Databinding.cpx Page Definitions
<?xml version="1.0" encoding="UTF-8" ?>
<Application xmlns="http://xmlns.oracle.com/adfm/application"
             version="10.1.3.34.12" id="DataBindings" SeparateXMLFiles="false"
             Package="oracle.srdemo.view" ClientType="Generic">
  <pageMap>
    <page path="/app/SRList.jspx" usageId="app_SRListPageDef"/>
    ...>
  </pageMap>
  <pageDefinitionUsages>
    <page id="SRListPageDef" path="oracle.srdemo.view.pageDefs.
           app_SRListPageDef"/>
    ...
  </pageDefinitionUsages>
  <dataControlUsages>
    <dc id="SRDemoFAQ" path="oracle.srdemo.faq.SRDemoFAQ"/>
    <BC4JDataControl id="SRService" Package="oracle.srdemo.model"
            FactoryClass="oracle.adf.model.bc4j.DataControlFactoryImpl"
            SupportsTransactions="true" SupportsFindMode="true"
            SupportsRangesize="true" SupportsResetState="true"
            SupportsSortCollection="true"
            Configuration="SRServiceLocal" syncMode="Immediate"
            xmlns="http://xmlns.oracle.com/adfm/datacontrol"/>
  </dataControlUsages>
</Application>
After BindingContainer is created by BindingContext, the ADF lifecycle initiates the Prepare Model and the Render Model phases before data can be displayed in the web page. Several things must happen before the bindings are resolved and data can appear in the web page:
Page parameters must be set.
Iterator and Method executables must be get refreshed by executing named service methods and ADF iterator bindings.
The ADF lifecycle enters the Prepare Model phase by calling BindingContainer.refresh(PREPARE_MODEL). During the Prepare Model phase, BindingContainer page parameters get prepared and then evaluated. Next, BindingContainer executables get refreshed based on the order of entry in the pagedef.xml file's <executables> section and on the evaluation of their Refresh and RefreshCondition properties (if present). When an executable leads to an iterator binding refresh, the corresponding data control will be executed, and that leads to execution of one or more collections in the service objects. If an iterator binding fails to refresh, a JBO exception will be thrown and the data will not be available to display.
To debug all executables for the binding container:
In the oracle.adf.model.binding.DCBindingContainer class, set a break on internalRefreshControl(int, boolean) as the entry point to debug the executables.

Tip: In the DCBindingContainer.internalRefreshControl() method, you can determine whether the executable will be refreshed by checking the outcome of the condition if (/*execute ||*/ execDef == null || execDef.isRefreshable(this, iterObj, refreshFlag)). If the condition evaluates to true, then the executable is refreshed and processing will continue to initSourceRSI().
In the oracle.adf.model.binding.DCIteratorBinding class, set a break on callInitSourceRSI() to halt processing and step into the method.
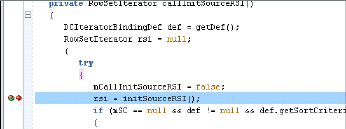
When processing pauses, look for callInitSourceRSI() in the Stack window. The result displayed in the Smart Data window should show the result that you expect.
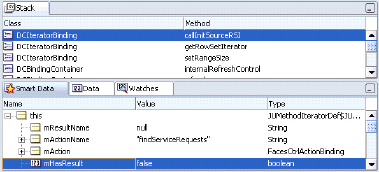
When your web page fails to display data from a method iterator binding, you can drill down to the entry point in JUMethodIteratorDef.java and its nested class JUMethodIteratorBinding to debug its execution.
To debug the method iterator executable for the binding container:
In the oracle.jbo.uicli.binding.JUMethodIteratorDef class, set a break on initSourceRSI() as the entry point to debug a method iterator binding executable.

Set a break on invokeMethodAction() to halt processing and step into the method.

Note that if the method returns a valid collection or a bean, then that object becomes the datasource for the rowset iterator that this iterator binding is bound to. For bean data controls, an instance of DCRowSetIteratorImpl is created to provide the rowset iterator functionality for the iterator binding to work with. (Note that for ADF Business Components, this method would ideally return a ADF Business Components rowset iterator so that ADF Business Components can manage the state of the collection.)
When initSourceRSI() returns a rowset iterator, pause processing and look for mProvider in the Smart Data window. The mProvider variable is the datasource fetched for this rowset iterator. If the method returned successfully, it should show a collection bound to an iterator or a bean.
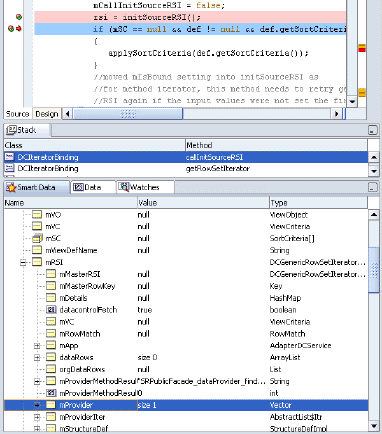
Tip:
If the debugger does not reach a breakpoint that you set on an executable in the binding container, then the error is most likely a result of the way the executable'sRefresh and RefreshCondition attribute was defined. Examine the attribute definition. For details about the Refresh and RefreshCondition attribute values, see Section A.6.1, "PageDef.xml Syntax".When the executable that produced the exception is identified, check that the <executables> element in the pagedef.xml file specifies the correct attribute settings.
Whether the executable is refreshed during the Prepare Model phase, depends on the value of Refresh and RefreshCondition (if they exist). If Refresh is set to prepareModel, or if no value is supplied (meaning it uses the default, ifneeded), then the RefreshCondition attribute value is evaluated. If no RefreshCondition value exists, the executable is invoked. If a value for RefreshCondition exists, then that value is evaluated, and if the return value of the evaluation is true, then the executable is invoked. If the value evaluates to false, the executable is not invoked. The default value always enforces execution.
Example 24-4 shows a sample pagedef.xml file from the SRDemo application. Notice that the <executables> element lists the executables in the order in which they should be executed, with the detail iterator positioned after its master binding iterator.
During the prepareRender phase of the ADF lifecycle, the bindings determine the data to display, and properties on the bindings determine the conditions in which to display the data. When the web page is rendered the first time, each EL expression that points to a binding gets resolved by the BindingContainer instance for that page. Based on the expression appropriate values like format, isEnabled, and isViewable, the data value for a binding is returned from BindingContainer. If the binding is unable to return the data, a JBO exception is thrown.
To debug the binding resolution for the binding container:
In the oracle.jbo.uicli.binding.JUCtrlValueBinding class, set a break in getInputValue() and step into the method.
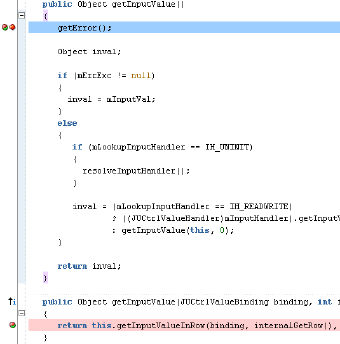
If getInputValue() returns an error, pause processing and look for the binding name in the Data window.
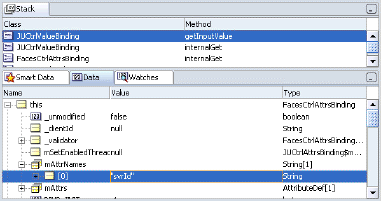
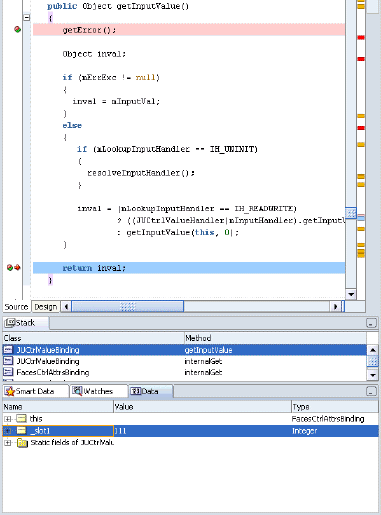
Continue stepping into getInputValue(), and look for a return value in the Data window that you expect for the current row that this binding represents.
When the binding that produced the exception is identified, check that the <bindings> element in the pagedef.xml file specifies the correct attribute settings. Example 24-5 shows a sample pagedef.xml file for the SRDemo application.
Example 24-5 Sample Page Definition Value Bindings
<bindings>
    <attributeValues IterBinding="GlobalsIterator" id="ProblemDescription">
      <AttrNames>
        <Item Value="ProblemDescription"/>
      </AttrNames>
    </attributeValues>
    <attributeValues IterBinding="GlobalsIterator" id="ProductId">
      <AttrNames>
        <Item Value="ProductId"/>
      </AttrNames>
    </attributeValues>
    <attributeValues IterBinding="GlobalsIterator" id="ProductName">
      <AttrNames>
        <Item Value="ProductName"/>
      </AttrNames>
    </attributeValues>
    <attributeValues id="FirstName"
                     IterBinding="LoggedInUserIterator">
      <AttrNames>
        <Item Value="FirstName"/>
      </AttrNames>
    </attributeValues>
    <attributeValues id="LastName"
                     IterBinding="LoggedInUserIterator">
      <AttrNames>
        <Item Value="LastName"/>
      </AttrNames>
    </attributeValues>
    ...
</bindings>
In case of submit, again, the lifecycle first looks up and prepares the BindingContainer instance. If the lifecycle finds a state token that was persisted for this BindingContainer, it asks the BindingContainer to process this state token. Processing the state token restores the variable values that were saved out in previous the render. If you need to debug processing the state token, break in DCIteratorBinding.processFormToken() and DCIteratorBinding.buildFormToken().
After this, all posts are applied to the bindings through setInputValue() on the value bindings.
When the executables are refreshed, actions and custom methods may be invoked on the page. At this stage, the corresponding action or method binding is refreshed. If an executable or its target binding is not executed, the action will be ignored.
The entry point for action and method execution is the DCDataControl.invokeOperation() method. Although JUCtrlActionBinding.invoke() is another potential entry point, method iterator bindings also use it to invoke methods implicitly. Instead, debugging on DCDataControl.invokeOperation() allows you to work with the same method that the data control uses to invoke the method. This is preferred because some adapter data controls can interpret the method name in a custom way rather than leave it to ADF to call the method.
To debug the action or method invocation for the binding container:
In the oracle.adf.model.binding.DCDataControl class, set a break on invokeOperation() as the entry point to debug an action or method invocation.
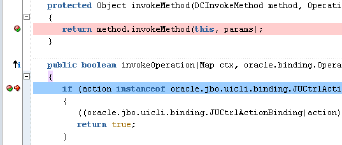
When processing pauses, step though the method to verify instanceName in the Data window shows the method being invoked is the intended method on the desired object.
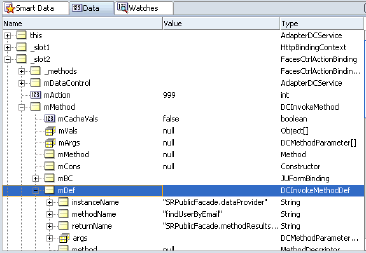
Verify args in the Data window shows the parameter value for each parameter being passed into your method is as expected. The parameter value below shows null.
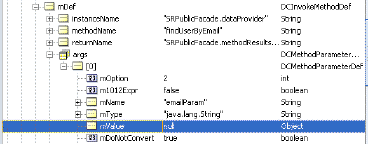
To debug a custom method invocation for the binding container:
In your class, set a breakpoint on the desired custom method.
In oracle.adf.model.generic.DCGenericDataControl class, set a break on invokeMethod() to halt processing before looking into the Data window.
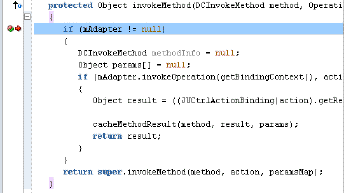
When processing pauses, step though the method to verify instanceName in the Data window shows the method being invoked is the intended method on the desired object.

Verify args in the Data window shows the parameter value for each parameter being passed into your method is as expected. The parameter value below shows null.

When the ignored action or custom method is identified, check that the <invokeAction> definitions in <executables> element and their corresponding <action> and <methodAction> definitions in the <bindings> element of the pagedef.xml file specifies the correct attribute settings.
Tip:
If the debugger does not reach a breakpoint that you set on an action in the binding container, then the error is most likely a result of the way the executable'sRefresh and RefreshCondition attribute was defined. Examine the attribute definition. For details about the Refresh and RefreshCondition attribute values, see Section A.6.1, "PageDef.xml Syntax".Whether the <invokeAction> executable is refreshed during the Prepare Model phase, depends on the value of Refresh and RefreshCondition (if they exist). If Refresh is set to prepareModel, or if no value is supplied (meaning it uses the default, ifneeded), then the RefreshCondition attribute value is evaluated. If no RefreshCondition value exists, the executable is invoked. If a value for RefreshCondition exists, then that value is evaluated, and if the return value of the evaluation is true, then the executable is invoked. If the value evaluates to false, the executable is not invoked. The default value always enforces execution.
Example 24-6 shows a sample of the custom method binding definitions in the pagedef.xml file for the SRDemo application.
Example 24-6 Sample Page Definition Executables and Action Bindings
<executables>
    <invokeAction id="AlwaysFind" Binds="Find" Refresh="ifNeeded"
                  RefreshCondition=
                   "${bindings.SearchServiceRequestsIterator.findMode == false}"/>
    <invokeAction id="insertBlankViewCriteriaRowIfThereAreNone" Binds="Create"
                  Refresh="renderModel"
                  RefreshCondition=
                     "${bindings.SearchServiceRequestsIterator.findMode and
                 bindings.SearchServiceRequestsIterator.estimatedRowCount == 0}"/>
 ...
</executables>
EL is not well supported with exceptions to inform you of specific failures. However, Example 24-7 shows one common exception you are likely to see when the resolver is unable to completely evaluate the expression.
Example 24-7 Expression Evaluation PropertyNotFound Exception
javax.faces.el.PropertyNotFoundException:
   Error setting property 'resultsTable' in bean of type null
at com.sun.faces.el.PropertyResolverImpl.setValue
   (PropertyResolverImpl.java:153)
You can check your web page's source code for problems in the expression, such as mistyped property names. When no obvious error is found, you will want to configure the logging.properties file in the <JDeveloper_Install>/jre/lib directory to display messages from the EL resolver.
To trace EL expression variables:
Open <JDeveloper_Install>/jre/lib/logging.properties in your text editor.
Set java.util.logging.ConsoleHandler.level=FINE.
Add the line:
com.sun.faces.level=FINE
Run your application and view the variable resolution in the JDeveloper Log window.
Testing your business services is an important part of your application development process. By creating a set of JUnit regression tests that exercise the functionality provided by your application module, you can ensure that new features, bug fixes, or refactorings do not destabilize your application. JDeveloper's integrated support for creating JUnit regression tests makes it easy to follow this best practice. Its integrated support for running JUnit tests means that any developer on the team can run the test suite with a single mouse click, greatly increasing the chances that every team member can run the tests to verify their own changes to the system. Furthermore, by using JDeveloper's integrated support for creating and running Apache Ant build scripts, you can easily incorporate running the tests into your nightly build process as well. This section explains how to create a JUnit test for your application module, how to run it, and how to integrate the tests into an Ant build script.
Typically you will create a separate project to contain your regression tests. For example, the SRDemo application has it JUnit regression test suite in the UnitTests project, while the business components that comprise its SRService application module belong to the DataModel project. After creating a new project to contain your JUnit test suite, you can use the Create Business Components Test Suite wizard in the context of that new project to create a JUnit test suite for an application module. You can find this wizard in the General > Unit Tests (JUnit) category in the New Gallery.
Tip:
If you don't see the Business Components Test Suite wizard, use JDeveloper's Help | Check for Updates feature to install the JUnit Integration for Business Components extension before continuing.When the Test Suite Wizard dialog appears, perform the following steps on the Select Application page:
Select the business components project in your workspace that contains the application module.
Select the application module in that project for which you want to create a test suite.
Enter a configuration name to use for running the tests.
Click Finish to create the test suite.
When you create a JUnit test suite for an application module using the wizard, JDeveloper updates the current project to have a dependency on the project containing the application module. In addition, assuming the application module for which you created the test suite were named devguide.example.ExampleModule, it generates the following skeleton classes in the devguide.example.test package:
A test suite class named ExampleModuleAllTests,
A test fixture class named ExampleModuleConnectFixture
A test class named ViewInstanceNameTest for each view object instance in the application module's data model
In this example, you would run the test suite at any time by running the ExampleModuleAllTests class.
By convention, a JUnit test suite is a class containing a public static method named suite() that returns an object that implements the Test interface in the junit.framework package. Typically, this will be an instance of the TestSuite class in that same package. The generated ExampleModuleAllTests class follows this convention to create and return an instance of this TestSuite object. As shown in Example 24-8, before returning the test suite it calls the addTestSuite() method to add one or more test case classes to the suite.
Example 24-8 Test Suite Class Adds Test Cases to the Suite
package devguide.example.test;
import junit.framework.Test;
import junit.framework.TestSuite;
public class ExampleModuleAllTests {
  public static Test suite() {
    TestSuite suite;
    suite = new TestSuite("ExampleModuleAllTests");
    suite.addTestSuite(ProductsTest.class);
    suite.addTestSuite(ServiceHistoriesTest.class);
    suite.addTestSuite(ServiceRequestsTest.class);
    // etc.
    return suite;
  }
}
The generated ExampleModuleConnectFixture is a JUnit test fixture that encapsulates the details of acquiring and releasing an application. It contains a setUp() method that uses the createRootApplicationModule() method of the Configuration class to create an instance of an application module. Its tearDown() method calls the matching releaseRootApplicationModule() method to release the application module instance.
Each test case class contains a setUp() and tearDown() method that JUnit invokes to allow initializing resources required by the test case and to later clean them up. These test case methods invoke the corresponding setUp() and tearDown() methods to prepare and clean up the text fixture for each test case execution. Any time a test in the test case needs access to the application module, it access it using the test fixture's getApplicationModule() method. This returns the same application module instance, saved in a member field of the test fixture class, between the initial call to setUp() and the final call to tearDown() at the end of the test case.
The application module configuration that you use for a JUnit test suite needs to use a JDBC URL connection, rather than a JDBC datasource. This is due to the fact that JDBC datasources are defined by the J2EE application server and can only be referenced in the context of an application running inside the server. Your JUnit tests run outside the server environment. For example, the SRDemo application has two configurations defined for its SRService application module. The SRServiceLocal configuration uses a JDBC datasource. It is referenced in the DataBindings.cpx file of the UserInterface project for use in the SRDemo application. In contrast, the SRDemo's JUnit tests reference the SRServiceLocalTesting configuration. This uses a JDBC URL connection instead of a datasource.
Each generated test case can contain one or more test methods that the JUnit framework will execute as part of executing that test case. You can add a test to the test case simply by creating a public void method in the class whose name begins with the prefix test. For example, it might look like this:
// In ViewInstanceNameTest.java test case class
  public void testSomeMeaningfulName() {
  // test assertions here
  }
The wizard generates skeleton test case classes for each view object instance in the data model, each of which contains a single test method named testAccess(). This method contains a call to the assertNotNull() method to test that the view object instance exists.
Your own testing methods can use any of the programmatic APIs available in the oracle.jbo package to work with the application module and view object instances in its data model. You can also cast the ApplicationModule interface to a custom interface to have your tests invoke your custom service methods as part of their job. During each test, you will call one or more assertXxxx() methods provided by the JUnit framework to assert what the expected outcome of a particular expression should be. When you run the test suite, if any of the tests in any of the test cases contains assertions that fail, JDeveloper's JUnit Test Runner window displays the failing tests with a red failure icon.
Apache Ant is a popular, cross-platform build utility for which JDeveloper offers excellent design-time support. You can incorporate the automatic execution of JUnit tests and test output report generation by using Ant's built-in junit and junitreport tasks. Example 24-9 shows a task called tests from the SRDemo's Ant build.xml file in the BuildAndDeploy project. It depends on the build and buildTests targets that Ant will ensure have been executed before running the tests target.
The junit tag contains a nested test tag that identifies the test suite class to execute and specifies a directory in which to report the results. The junitreport tag allows you to format the test results into a collection of HTML pages that resemble the format of JavaDoc. To try running the SRDemo's JUnit test from this Ant task, select the build.xml file in the Application Navigator, and choose Run Ant Target > tests from the context menu.
Example 24-9 Ant Build Target Runs JUnit Test Suite and Generates Report
<!-- In SRDemo's build.xml -->
<target name="tests" description="Run the model layer Unit tests"
        depends="build, buildTests">
  <mkdir dir="${tests.reporting.dir}"/>
  <junit printsummary="true" fork="true">
    <formatter usefile="true" type="xml"/>
    <test name="oracle.srdemo.tests.model.SRServiceAllTests"
          todir="${tests.reporting.dir}"/>
    <sysproperty key="jbo.debugoutput" value="file"/>
    <classpath path="${model.build.dir}"/>
    <classpath path="${tests.build.dir}"/>
    <classpath refid="tests.classpath"/>
  </junit>
  <junitreport todir="${tests.reporting.dir}">
    <fileset dir="${tests.reporting.dir}">
      <include name="TEST-*.xml"/>
    </fileset>
    <report format="frames" todir="${tests.reporting.dir}"/>
  </junitreport>
</target>
The SRDemo's UnitTest project includes examples of a few customizations you can make to the generated test case classes. This section describes how to customize the text fixture to authenticate a particular user and how to refactor common test case code in to a base class.
The SRServiceFixture has a custom constructor that accepts a username and a password. Its setUp() method uses a custom ADF Business Components EnvInfoProvider implementation to supply runtime configuration parameters to the application module. In particular, to authenticate as the given username with the given password, the JUnitFixureLoginInfoProvider class implements the EnvInfoProvider interface's getInfo() method to return:
The value Must for the jbo.security.enforce property
The username value for the java.naming.security.principal property (referenced using the JboContext.SECURITY_PRINCIPAL constant)
The password value for the java.naming.security.credentials property (referenced using the JboContext.SECURITY_CREDENTIALS constant)
Each of the three test cases in the oracle.srdemo.tests.model.unittests package creates its instance of the SRServiceFixture with a different combination of username and password values. For example, the SRServiceTestAsManagerRole test case creates a SRServiceFixture for a user that has the manager role (sking). The other two tests each do the same, but for a user of the other two roles Technician and Manager.
Tip:
TheUnitTests project in the SRDemo includes the ConfigurationData directory as one of its project contents paths. This ensures that the jazn-data.xml file (contained in its META-INF subdirectory) which defines all the users and roles for the demo, is readable by the JUnit tests at runtime. XML files in the project source path are copied to the project's output directory during compilation since their *.xml file extension is included by default in the Copy File Types to Output Directory field of the Compiler page in the Project Properties dialog.All three of the test case classes extend the SRUnitTestBase class. This class contains code that is common to all of the test cases. For example, it includes a number of helper methods for getting the current date, setting the current row in a view object by a stringified key, and creating a key of appropriate type for a given view object. It also defines the abstract method createSRServiceFixtureForTest() that each subclass overrides to return the SRServiceFixture constructed with the appropriate username and password for the authentication.