| Bookshelf Home | Contents | Index | PDF | |
|
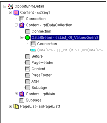
Siebel Reports Administration Guide > Smart Reports > Designing a Smart Report > About the Opportunity Detail Smart ReportThe Opportunity Detail report presents each opportunity with graphical information including order-of-merit indicator, Competitive Activity, Deal Size Thermometer, Buying Influencers Thermometer, Probability Thermometer, Sales Stage Slider, Contacts/Influence Map, and other details in the dashboard section and detail sections on contacts, products, competitors, activities, and notes. First a functional description of the components in this report is provided, followed by the report design in Actuate e.Report Designer Professional. About the Functional Detail Section for the Opportunity Detail Smart ReportThe functional detail includes a high-level description of the components of the Opportunity Detail report. This section also describes the properties of the specialized graphical components. About the Graphical Components for the Opportunity Detail Smart ReportOrder-of-merit indicator. The order-of-merit indicator indicates the overall measure for the opportunity and is calculated based on the following logic: All three Thermometers above target = Up Two of the Three Thermometers above target = Right Sales stage slider. This indicates how close the opportunity is in terms of closing the deal. Deal size thermometer. This thermometer displays the deal size of the opportunity relative to the average across all opportunities. The minimum value is taken as zero, the trigger value is calculated to be the average across all opportunities, and the maximum is twice the trigger value. Competitive activity. The competitive activity depicts the top four competitors in descending order; the value indicates the relative threat, which is determined by the sales representative or the status of each competitor. The value displayed in the graph is obtained from the List of Values table under type = 'TARGET_COMP_THREAT' and Value = Threat. Buying influencers thermometer. The Buying Influencers thermometer depicts the buying influence based on the weighted average of the contacts involved with the opportunity (TASOrgStatusArray, ContactRoleArray, and TASPolitical AnalysisArray). Probability thermometer. This thermometer shows an amount between 0 and 100, the percentage probability of converting the opportunity into an order. Contacts influence map. The map shows the contacts associated with the opportunity, highlighting the decision makers. About Other Components of the Opportunity Detail Smart ReportPage header. The page header includes a snapshot of the opportunity and shows the name of the opportunity, the revenue, the probability, and the order-of-merit indicator. Dashboard. In this section, the graphical and textual information for the opportunity appears. The thermometers described earlier are in the dashboard, along with opportunity summary text. Contact detail. This is one of the detail sections (or a subreport section) of the opportunity master section. The details of the contacts associated with this opportunity are shown in the form of a list report. Products. The product offerings relevant to the opportunity are listed in this detail section. Competitors. This section lists the competitors for this opportunity. Decision issues. In this section, the decision issues for the opportunity are listed in order of priority. All activities. This section lists all the activities undertaken for this opportunity. Notes. This section shows the email messages, correspondence, and proposals sent for this opportunity. About Technical Detail in the Opportunity Detail Smart ReportThe Opportunity Detail report consists of two report sections. The first is the data collection section and the second is the main section, as shown in Figure 26. The purpose of the data collection section is to obtain and manipulate data for the current master record (which is a record from the Opportunity business component). Specifically, the data from the List_of_Values of Opportunity object is obtained in the Fetch method for determining the values for the Buying Influencers thermometer. About the Data Collection Section of the Opportunity Detail Smart ReportList of Values data collection is required for weighting factors used in the Buying Influencers thermometer. Three types of weighting factors, CONTACT_ROLE, TAS_POLITICAL_ANALYSIS, and TAS_ORG_STATUS, are stored in separate static arrays defined in the OpportunityDetail component. Also, minimum and maximum weighting factors are stored in separate static variables for each of the three types. Data rows are collected by a component subclassed from the ssList_Of_ValuesQuery class defined in ssSmart.rol. The SearchSpec property is set to [Type] = 'CONTACT_ROLE' or [Type] = 'TAS_POLITICAL_ANALYSIS' or [Type] = 'TAS_ORG_STATUS'; DefaultWeightingFactor is a local property set to 1; NeutralTAS_ORG_STATUS is a local property set to Neutral. The Fetch method of ssList_Of_ValuesQuery3 decodes the type of weighting factor and populates the variables described above. The data collection section can be created using the following procedure. The contents of this section appear in Actuate e.Report Designer Professional, as shown in Figure 27 and explained in the procedure. To create a data collection section for the Opportunity Detail Smart Report
Note that this technique requires variables to be defined in the top OpportunityDetail report component, as shown in Table 12. About the Main Report Section of the Opportunity Detail Smart ReportThe Main Report section provides the structure for gathering and displaying the data for each opportunity available from the Opportunity business component. Making the Opportunity data row available to detail sections (or subreports) requires static data row storage. OpportunityRow is a static variable of type ssOpportunityDataRow, defined in the OpportunityDetail component. The OnRow method of the rptMain report section assigns this variable equal to the current row from the ssOpportunityQuery as shown below. Sub OnRow( row As AcDataRow ) The Main Report section contains components in the DataSource, PageHeader, and Content slots, as shown in Figure 28.
Creating the Sequential Report Section in the Opportunity Detail Smart ReportCreate the main report section by subclassing from ssRpt into the content slot of ssSeq1. Rename this Report Section to rptMain. The rptMain section appears in Actuate e.Report Designer Professional as shown in Figure 29. Defining the DataStream Section in the Opportunity Detail Smart ReportClick the library button and double-click opdet.rol to open the library. Drag and drop ssOpportunityQuery into the DataStream section under rptMain. It is not necessary to subclass. Defining the Page Header Section in the Opportunity Detail Smart ReportThe PageHeader frame provides the Order Of Merit graphic display because it is subclassed from the ssOrderOfMeritHeader class defined in ssSmart.rol library. The direction of the order-of-merit indicator is determined by assigning the ArrowDirection class variable in the Finish method before calling the superclass Finish method. In this method, the arrow direction is determined by the variable NumberOfThermometersAboveTarget, which is a static integer variable defined in the OpportunityDetail component. If all three thermometers display data values higher than their trigger values, the up arrow appears. If only two of the thermometer data values exceed their trigger values, the right arrow appears. If one or none of the thermometer data values exceeds its trigger value, the down arrow appears. To create a Page Header section in the Opportunity Detail Smart Report
If NumberOfThermometersAboveTarget = 3 Then ElseIf NumberOfThermometersAboveTarget < 2 Then
Defining the Content Main Section in the Opportunity Detail Smart ReportSubclass from ssSeq to create secMain in the Content slot of rptMain. About the rptCollectCompetitiveActivity Section in the Opportunity Detail Smart ReportThe rptCompetitiveActivity and rptCompetitors sections require Competitor data collection. The results of ssCompetitorQuery_3 query in Opdet.rol are stored in CompetitorDataList, a static variable defined in the OpportunityDetail component. CompetitorIndexArray, an array of list position numbers, is maintained to facilitate retrieval of the four competitors with the highest threat value. The array is defined in the OpportunityDetail component. The sifCompetitiveActivity component is subclasssed from the ssSingleInputFilter class in sscustom. The Start method of the sifCompetitiveActivity filter initializes the array values to zero for each opportunity. The Start method of the rptCollectCompetitiveActivity report section initializes the list for each opportunity. The Fetch method of the filter populates the list and the array. To create a rptCollectCompetitiveActivity section in the Opportunity Detail Smart Report
Function Fetch( ) As AcDataRow Dim aRow As ssCompetitorDataRow Dim bRow As ssCompetitorDataRow Set aRow = New ssCompetitorDataRow Set aRow = InputAdapter.Fetch() CompetitorDataList.AddToTail(aRow) If CompetitorIndexArray(i) > 0 Then Set bRow = CompetitorDataList.GetAt(CompetitorIndexArray(i)) If Val(aRow.ssThreat_Value) >= Val(bRow.ssThreat_Value) Then CompetitorIndexArray(j + 1) = CompetitorIndexArray(j) CompetitorIndexArray(i) = CompetitorDataList.GetCount() CompetitorIndexArray(i) = CompetitorDataList.GetCount() About the rptCollectContacts Section in the Opportunity Detail Smart ReportThe rptBuyingInfluencersThermometer, rptContactsInfluenceMap and rptContactDetail sections require Contact data collection. The results of ssContactQuery_1 query defined in Opdet.rol, are stored in the ContactDataList, a static variable defined in the OpportunityDetail component. To create a rptCollectContacts section in the Opportunity Detail Smart Report
Function Fetch( ) As AcDataRow Set aRow = InputAdapter.Fetch() If aRow Is Nothing Then Exit Function ContactDataList.AddToTail(aRow) About the parDashBoard Section of the Opportunity Detail Smart ReportSee the general Smart Reports documentation for a general description of DashBoard parallel sections (About the Report Structure for Smart Reports). To create a parDashBoard section in a Smart Report
Defining the Subpage Layout Section in the Opportunity Detail Smart ReportIn the subpage layout, set up a flow for each of the report sections described in the sections that follow. rptSalesStageSlider. The frmStageSlider component simulates a horizontal bar graph by dynamically instantiating a dark-background control and sizing it based on the value of the Sales Stage Win Percent field for the current opportunity. Other elements of the graphic, such as ticks and label, are placed in the frmStageSliderHolder frame. rptMainDashboard. The MainDashboard report section displays details for this opportunity and a general functional description of this report. rptDealSizeThermometer. The DealSizeThermometer component is a subclass of the ssThermometer defined in ssSmart.rol. The four thermometer control variables, TriggerDataValue, DataValue, MinimumValue, and MaximumValue, are set in the OnRow method. TriggerDataValue is set from the Order By LOV field, MaximumValue is set from the Target High LOV field, and MinimumValue is set from the Target Low LOV field. DataValue is set from the Functional Revenue field of OpportunityRow, which was stored earlier. The OnRow method also adjusts the NumberOfThermometersAboveTarget variable to have the appropriate effect on the OrderOfMerit image. rptCompetitiveActivity. The Competitive Activity chart is a standard Actuate horizontal-bar-chart summary graph. The data rows that feed the graph are pulled from the CompetitorDataList using the list row numbers saved in CompetitorIndexArray. The list and the array were saved earlier in the rptCollectCompetitiveActivity report section. The number of rows fed to the graph is limited to a maximum of four, and they are ordered so that the most threatening competitor is shown at the top. rptBuyingInfluencersThermometer. The BuyingInfluencersThermometer graphic display is driven by scores calculated from values stored in arrays by the rptDataCollection section. The ssContactQuery_2 data source component iterates through the ContactDataList, feeding the data rows to the ftrCalculateWeightedScore single input filter. The Fetch method for ssContactQuery_2 follows. Function Fetch( ) As AcDataRow If Position <= ContactDataList.GetCount() Then Set aRow = ContactDataList.GetAt(Position) The Fetch method of the ftrCalculateWeightedScore single input filter calculates a score for an opportunity by averaging the scores for each contact associated with that opportunity. The score for each contact is the product of three weighting factors collected earlier and stored in static arrays. The first weighting factor is retrieved from the TASOrgStatusArray by matching the 'Org Status' field with a TAS_ORG_STATUS type LOV value stored in the array. The second weighting factor is retrieved from the ContactRoleArray by matching the 'Role' field with a CONTACT_ROLE type LOV value stored in the array. The third weighting factor is retrieved from the TASPoliticalAnalysisArray by matching the 'Political Analysis' field with a TAS_POLITICAL_ANALYSIS type LOV value stored in the array. The script for ftrCalculateWeightedScore follows. Function Fetch( ) As AcDataRow Dim finalRow As OpportunityDetail::rowBuyingInfluencers Dim numberOfContacts As Integer If aRow Is Nothing AND Position > 1 Then Exit Function If Not Trim$(aRow.ssOrg_Status) = "" Then For i = 1 to TASOrgStatusArraySize If aRow.ssOrg_Status = TASOrgStatusArray( 1, i ) Then score = Val( TASOrgStatusArray( 2, i ) ) For i = 1 to ContactRoleArraySize If aRow.ssRole = ContactRoleArray( 1, i ) Then score = score * Val( ContactRoleArray( 2, i ) ) For i = 1 To TASPoliticalAnalysisArraySize If aRow.ssPolitical_Analysis = TASPoliticalAnalysisArray1, i ) Thenscore = score * Val( TASPoliticalAnalysisArray( 2, i ) ) totalScore = totalScore + score numberOfContacts = numberOfContacts + 1 Set finalRow = New OpportunityDetail::rowBuyingInfluencers finalRow.Score = totalScore / numberOfContacts rptProbabilityThermometer. The ProbabilityThermometer component is a subclass of ssThermometer, defined in ssSmart.rol. As usual, the four thermometer control variables, TriggerDataValue, DataValue, MinimumValue, and MaximumValue, are set in the OnRow method. TriggerDataValue is set from the Order By LOV field, MaximumValue is set from the Target High LOV field, and MinimumValue is set from the Target Low LOV field. DataValue is set from the Rep% field for the opportunity. The OnRow method also adjusts the NumberOfThermometersAboveTarget variable so it will have the appropriate effect on the OrderOfMerit image. The script for the OnRow method follows. Dim aRow As ssList_Of_ValuesDataRow DataValue = Val( OpportunityRow.ssRep__ ) TriggerDataValue = Val( aRow.ssOrder_By ) MaximumValue = Val( aRow.ssTarget_High ) MinimumValue = Val( aRow.ssTarget_Low ) If DataValue > TriggerDataValue Then NumberOfThermometersAboveTarget = NumberOfThermometersAboveTarget + 1 rptContactDetail. Instructions on creating the rptContactDetail section follow. To create a rptContactDetail section in the Opportunity Detail Smart Report
rptProducts. Instructions on creating the rptProducts section follow. To create a rptProducts section in the Opportunity Detail Smart Report
rptCompetitors section. Instructions on creating the rptCompetitors section follow. To create a rptCompetitors section in the Opportunity Detail Smart Report
rptDecisionIssues section. Instructions on creating the rptDecisionIssues section follow. To create a rptDecisionIssues section in the Opportunity Detail Smart Report
rptAllActivities section. Instructions on creating the rptAllActivities follow. To create a rptAllActivities section in the Opportunity Detail Smart Report
rptNotes section. Instructions on creating the rptNotes section follow. To create a rptNotes section in the Opportunity Detail Smart Report
|
 |
|
| Siebel Reports Administration Guide | Copyright © 2009, Oracle and/or its affiliates. All rights reserved. Legal Notices. | |