|
Siebel Object Interfaces Reference > Siebel Programming Tools > The Siebel Debugger >
Debugging and Run-Time Preferences
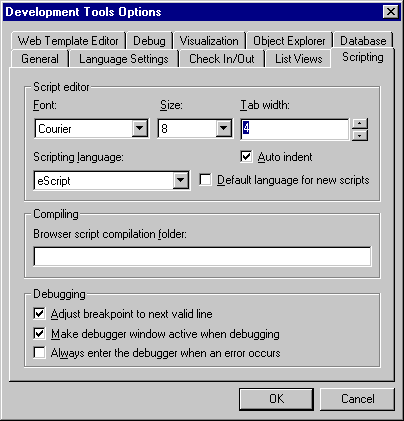
To access the debugging preferences, select View > Options and then click the Scripting tab (see Figure 3).
Figure 3. Debugging Preferences
|
This dialog box has the following debugger settings:
- Adjust breakpoint to next valid line. When breakpoints are deleted on invalid lines, this option creates a breakpoint at the next valid line.
- Make debugger window active when debugging. The Siebel Debugger window appears whenever you are in debug mode.
- Always enter the debugger when an error occurs. The Siebel Debugger window appears whenever a script error occurs.
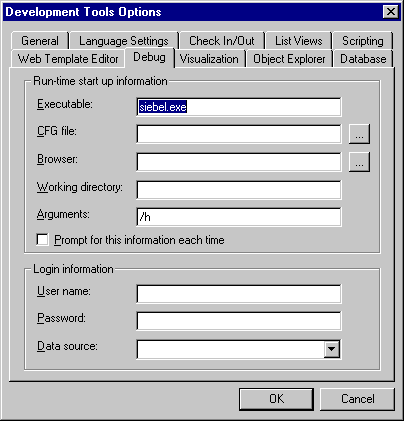
To access the run-time preferences, select Views > Options and then click the Debug tab (see Figure 4).
Figure 4. Run-Time Preferences
|
This dialog box has the following preference settings:
- Executable. The name of the Siebel Web Client executable (Siebel.exe).
- CFG file. Configuration file to be used by the client.
- Browser. The path to the browser executable.
- Working directory. Siebel root directory (location of DLLs).
- Arguments. Additional line options for starting the application. Common arguments are:
- /h - to enable local debugging of Server scripts
- /s <filename> - to enable SQL spooling
- User name. Login name of the user.
- Password. Password of the user name.
- Data source. Default data source. Values listed depend upon the configuration file specified in the CFG file field.
|