| Bookshelf Home | Contents | Index | PDF | |
|
Siebel Analytics Server Administration Guide > Setting Up Disconnected Analytics > Creating the Disconnected Application Configuration File > Data Set DefinitionsThe sample XML configuration file for the retail application in Create the Application Configuration File for Disconnected Analytics was a simple configuration file containing a single data set with three tables. You might need only a single table in a data set or, for a more complex application, you might want to use multiple data sets. This section discusses why Siebel Analytics administrators might want to define multiple data sets for a particular disconnected application or why they might want to define a single data set with only one table. This section contains the following topics: Defining Multiple Data SetsThis section describes multiple data sets by using an example of a customer interaction application that tracks the following types of customer interactions:
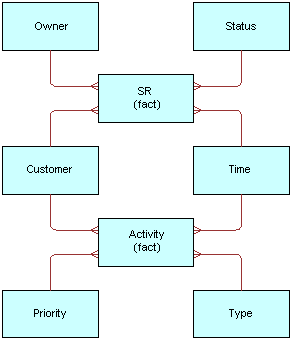
Figure 18 illustrates the database schema for the application. It shows a schema with two main fact tables (Activity and SR) and their associated dimension tables. The two fact tables share the Customer and Time dimension tables CAUTION: It is the administrator's responsibility to verify data consistency and integrity. For example, if you create a new data set that contains new dimensional records and do not update the corresponding facts data set, the disconnected database might provide incorrect results. Static DimensionsStatic dimensions are dimension tables that do not change for long periods of time, if at all. For example, a dimension table of United States zip (postal) codes could be a static dimension for most applications. Because static dimensions do not change often, mobile users typically need to download them only once. Therefore, Siebel Analytics administrators should put all static dimension tables for a disconnected application into a separate data set. The Customer Interaction application example in Defining Multiple Data Sets has one static dimension (Time). Database administrators typically preallocate many years worth of time data. As a result, the table does not change for years at a time. For example, in the Customer Interaction application, the Time dimension contains static data through the year 2010. Example of a Data Set For a Time DimensionThe following is an example of the data set definition for the Time dimension.
NOTE: A download occurs by default only during the first synchronization on a disconnected machine (see the <dataset> attribute syncdefaultfirsttime = "true"). The user cannot override this attribute (forcesync = "true"). Common DimensionsCommon dimensions are dimension tables that join with more than one fact table. Because common dimensions join with multiple fact tables, they must always be synchronized. Therefore, Siebel Analytics administrators should put all common dimension tables for a disconnected application into a separate data set. The Customer Interaction application example in Defining Multiple Data Sets contains two common dimensions (Customer and Time). Because the Time dimension already qualifies as a static dimension, we need only put the Customer table in the data set for common dimensions. Example of a Data Set For a Common DimensionThe following is an example of the data set definition for the common Customer dimension.
A download occurs by default for the first synchronization (attribute syncdefaultfirsttime = "true") and all subsequent synchronizations (attribute syncdefaultsubsequenttimes = "true") on a disconnected machine. The user cannot override this attribute (forcesync = "true"). Fact Tables and Private DimensionsPrivate dimensions are dimensions that only join to one fact table. Because fact tables typically change independently of one another, Siebel Analytics administrators should put each fact table and its associated private dimensions into a separate data set. The Customer Interaction application has two fact tables (Activity and SR), so each fact table and its associated private dimensions should have a separate data set. Example of a Data Set For Fact Tables With Private DimensionsThe following is an example of the data sets for fact tables and their private dimensions. Generating a Combined Table From Multiple TablesYou can generate a single combined table by joining a fact table to all its dimension tables. The single table strategy results in simpler data set definitions and fewer SQL scripts to manage. It might lead to improved performance on the disconnected machine because the SQL Anywhere database no longer needs to perform join operations on the combined table. However, joining the tables increases the amount of data because dimension table column values are repeated for each fact table entry. CAUTION: Administrators should not choose the single table strategy for applications that have large fact tables and many dimension tables. It is recommended that you choose the single table strategy only if the resulting table is less than 20 MB. For example, using the retail application example in Create the Application Configuration File for Disconnected Analytics, you can join the Product and Store dimensions to the SalesFact table producing a single table. Example of How to Generate a Combined Table From Multiple TablesThe following example of a file called CombinedRetail.sql illustrates the SQL that would generate a combined table. Example of the Simplified Retail Data SetAfter combining the tables, the following example illustrates the simplified retail data set.
| |||||||||||||||||||||||||||||||||||||||||||||||||||||||||||||||||||||||||||||||||||||||||||||||||||||||||||||||||||||||||||||||||
 |
|
| Siebel Analytics Server Administration Guide |