| Bookshelf Home | Contents | Index | PDF | |
|
Siebel Business Analytics Server Administration Guide > Planning and Creating a Siebel Business Analytics Repository > Process of Analytics Repository Planning and Design > Planning Your Business ModelThis topics is part of the Process of Analytics Repository Planning and Design. Planning your business model is the first step in developing a usable data model for decision support. After you have followed the planning guidelines in this section, you can begin to create your repository. This section contains the following topics: Analyzing Your Business ModelYour first task is to thoroughly understand your business model. You have to understand what business model you want to build before you can determine what the physical layer needs to have in it. In a decision support environment, the objective of data modeling is to design a model that presents business information in a manner that parallels business analysts' understanding of the business structure. A successful model allows the query process to become a natural process by allowing analysts to structure queries in the same intuitive fashion as they would ask business questions. This model must be one that business analysts will inherently understand and that will answer meaningful questions correctly. This requires breaking down your business into several components to answer the following questions:
After you have answered these questions, you can identify and define the elements of your business model. Identifying the Content of The Business ModelTo create a business model, the data needs to be mapped logically to a business model. The Analytics Server can use dimensional models for this purpose. This section discusses some of the components and variants of representative dimensional models. Businesses are analyzed by relevant dimensional criteria, and the business model is developed from these relevant dimensions. These dimensional models form the basis of the valid business models to use with the Analytics Server. All dimensional models build on a star schema. That is, they model some measurable facts that are viewed in terms of various dimensional attributes. After you analyze your business model, you need to identify the specific logical tables and hierarchies that you need to include in your business model. For more information about these objects, see Identifying the Content of The Business Model. The following sections are discussed in this section:
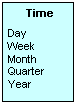
Identifying Fact TablesA fact table is a table with measures. Measures must be defined in a logical fact table. Measures, or facts, are typically calculated data such as dollar value or quantity sold, and they can be specified in terms of dimensions. For example, you might want to see the sum of dollars for a given product in a given market over a given time period. Each measure has its own aggregation rule such as SUM, AVG, MIN, or MAX. A business might want to compare values of a measure and need a calculation to express the comparison. Also, aggregation rules can be specific to particular dimensions. The Analytics Server allows you to define complex, dimension-specific aggregation rules. The Analytics Server recognizes that when a table in the Business Model and Mapping layer of a repository has only many-to-one (N:1) logical joins pointing to it, it is a fact table. To see an example of this in a business model, open a repository in the Administration Tool, right-click on a fact table, and select Business Model Diagram > Whole Diagram. NOTE: The fact table is at the end of a 0, 1:N (zero, one-to-many relationship) join. Figure 2 illustrates the many-to-one joins to a fact table in a Business Model Diagram. In the diagram, all joins have the crow's feet symbol (indicating the many side) pointing into the Fact-Pipeline table and no joins pointing out of it. NOTE: A bridge table is an exception to this joins rule. For more information, see Identifying Bridge Tables. Identifying Dimension TablesA business uses facts to measure performance by well-established dimensions, for example, by time, product, and market. Every dimension has a set of descriptive attributes. Dimension tables contain attributes that describe business entities. For example, Customer Name, Region, Address, Country and so on. Dimension tables also contain primary keys that identify each member. Dimension table attributes provide context to numeric data, such as number of Service Requests. Attributes stored in this example dimension include Service Request Owner, Area, Account, and so on. The best method to identify dimensions and their attributes is to talk with the analysts in the organization who will use the data. The terminology they use and understand is important to capture. Identifying Bridge TablesWhen you need to model many-to-many relationships between dimension tables and fact tables, you can create a bridge table that resides between the fact and the dimension tables. A bridge table stores multiple records corresponding to that dimension. In the Administration Tool, General tab in the Logical Table dialog box contains a check box that you can select to specify that a table is a bridge table. Identifying Dimension HierarchiesUnderstanding the hierarchies you need in your business is essential to provide the metadata that allows the Analytics Server to determine if a particular request can be answered by an aggregate that is already computed. For example, if month rolls up into year and an aggregate table exists at the month level, that table can be used to answer questions at the year level by adding up all of the month-level data for a year. A hierarchy is a set of parent-child relationships between certain attributes within a dimension. These hierarchy attributes, called levels, roll up from child to parent; for example, months can roll up into a year. These rollups occur over the hierarchy elements and span natural business relationships. Dimensions are categories of attributes by which the business is defined. Common dimensions are time periods, products, markets, customers, suppliers, promotion conditions, raw materials, manufacturing plants, transportation methods, media types, and time of day. Within a given dimension, there may be many attributes. For example, the time period dimension can contain the attributes day, week, month, quarter, and year. Exactly what attributes a dimension contains depends on the way the business is analyzed. A dimensional hierarchy expresses the one-to-many relationships between attributes. Given a sample time dimension, consider the hierarchies it implies, as shown in Figure 3. With this sample time dimension, days may aggregate, or roll up, into weeks. Months may roll up into quarters, and quarters into years. When one attribute rolls up to another, it implies a one-to-many relationship. The total of all the hierarchy definitions in this sample time dimension make up this time dimension. These hierarchy definitions have to be specific to the business model. One model may be set up where weeks roll up into a year, and another where they do not. For example, in a model where weeks roll up into a year, it is implied that each week has exactly one year associated with it; this may not hold true for calendar weeks, where the same week could span two years. Some hierarchies might require multiple elements to roll up, as when the combination of month and year roll up into exactly one quarter. The Analytics Server allows you to define the hierarchy definitions for your particular business, however complex, assuring that analyses will conform to your business definitions. You should identify as many natural hierarchies as possible. As with business questions, some hierarchies are obvious, but some are not and are only known by the end users who interact with particular aspects of the business. You should verify that you understand the hierarchies so you can define them properly using the Administration Tool. About Star and Snowflake ModelsStar and snowflake models follow the dimensional rules of one-to-many relationships. Star schemas have one-to-many relationships between the logical dimension tables and the logical fact table. Snowflake schemas have those same types of relationships, but also include one-to-many relationships between elements in the dimensions. NOTE: It is recommended that you minimize the use of snowflake schemas. For example, in Figure 4 and Figure 5, Sales Facts and Facts are fact tables and Markets, Periods, Products, Account Hierarchy, Account Region Hierarchy and Account are dimension tables. Any logical table that is not a fact table or a bridge table is a dimension table. For more information about bridge tables, see Identifying Bridge Tables. Figure 4 illustrates a star schema: Figure 5 illustrates a logical snowflake schema that defines hierarchies by using multiple dimension tables. NOTE: It is recommended that you minimize the use of snowflake schemas. The value of the snowflake schema is that the server treats outer joins differently from outer joins that are within a logical table source. Within a logical table source, the joins are always executed. When between logical tables, the joins are only performed when required. For more information about snowflake schemas, see About Types of Physical Schemas. |
| |
| Siebel Business Analytics Server Administration Guide |