| Oracle® Retail Demand Forecasting User Guide for the RPAS Fusion Client Release 16.0 E91109-03 |
|

 Previous |
 Next |
| Oracle® Retail Demand Forecasting User Guide for the RPAS Fusion Client Release 16.0 E91109-03 |
|
Previous |
Next |
This chapter provides an introduction to Cross Promotional Effects Module (CPEM). CPEM is a data mining solution that determines promotional Cannibalization, or Halo relationships, or both between items or groups of items.
We refer to Cannibalization effects when a promoted item causes a drop in sales of a similar item. An example of this behavior is when a brand of mustard is promoted, it likely experiences an increase in sales and other mustard brands' demand decreases. After the promotional period the demand pattern of the entire mustard category returns to pre-promotion levels.
Conversely, we refer to Halo effects when a promoted item, or group of items causes an increase in sales of a complementary item or items. A typical case is when hot dogs are promoted, hot dog buns are likely to see a peak in sales as well.
Cannibalization is expected to happen at low levels in the merchandise hierarchy, like style or subclass. However, Halo is detected at much higher levels, like category or department.
CPEM is a module within RDF, but it is implemented separately of a RDF forecasting environment. The nature of the problem that mining for cross promotional relationships poses, that is, search for relationships among items in different areas of business, is not compatible with the master/local domain structure of a typical RDF environment. CPEM is implemented in a single domain, such that mining for Halo effects can span multiple departments.
The inputs to CPEM are sales and promotion information for which there is formal integration with the forecasting solution.
The output of CPEM is the promotional elasticity among items, which is location specific. The intersection of the output is item/item/location.
Currently, RDF Causal is predicting promotional sales based on item Self Promo Lifts. Basically the promotion of an item is considered to affect only sales of that item. With information about cross promotional elasticities, the promotion planners have the complete picture on how a promotion affects the entire business, and can act accordingly.
RDF was launched with Promotional Halo and Cannibalization capabilities in January 2013. The functionality has had limited adoption due to various factors including necessary data required to support reliable results, market maturity and implementation complexity. In an attempt to share lessons learnt with our experience so far, we would recommend the following to our customers considering implementing this functionality:
Starting Conditions
Both Halo and Cannibalization deal with the cross item effects of running promotions, that is, the impact of promoting an item on the sales of other related items. The most important inputs for estimating these cross effects are a robust baseline forecast and self-promotion effects from RDF Causal. Hence, we recommend that CPEM be considered for implementation only after RDF Causal has been up and live for a 12-18 month period, delivering reliable baseline and causal forecasts to drive business decisions.
Replacement SKUs — All historical SKUs that are replacement or promotional variants of each other need to be grouped together into a Plan SKU. The Plan SKU level needs to be used within RDF for estimating both baseline forecasts and causal forecasts.
Appropriate pre-processing — That corrects for missing sales periods and other factors that might bias the estimated baseline forecast and hence impact that quality of CPEM output.
Set Up for Cannibalization
Careful configuration and pre-implementation set up is required for Cannibalization to run. It is important to note that Cannibalization (though configurable) is designed to run at an item-group level (as defined in the following list) and not the individual SKU level.
|
Note: Cannibalization needs to stay inside a local domain. |
Item-group or L1 Set Up — This is the level at which Cannibalization is estimated. SKUs have to be grouped (outside the system and fed in). These are groups of items that are typically promoted together. For example, in the yogurt Category, SKUs of a particular brand, size, fat content but different flavor variants. An attribute analysis exercise, should inform this L1-grouping. What are the key combinations of attributes that need to be the same for all items in an L1-group and what attributes can be different? It is important to note that these attributes will vary significantly, from Category to Category.
Cannibalization-group Or L2 Set Up — L2 is the level within which Cannibalization is estimated. Only items within a Cannibalization group are analyzed for possible Cannibalization, when one or more items are promoted. This could be a grouping of one or more classes or sub-classes. Note that L2 grouping needs to be a roll up of L1 groupings, that is, every L1 item-group needs to cleanly map to one and only one L2 grouping (many to one mapping from L1 to L2).
L1-pairing Set Up — In addition to set up of L1 or Item-groups, RDF's CPEM also needs to be told of legal/possible L1-pairs. This requires careful analysis on a Category by Category basis. For example. SKUs within a certain regular price range could be considered Cannibalistic and hence valid L1-pairs. It is recommended that this analysis be conducted carefully, ideally in conjunction with Customer Decision Trees (CDTs) to ensure the correct pairings are set up for each Category.
Co-promotion Effects are Turned Off — A system flag that effectively looks for conditions when both L1 pairings are promoted at the same time and accounts for it appropriately.
Halo effects
Current functionality is designed for a limited use case for businesses with minimal promotional activity. The solution aims to estimate Halo effects by observing the impact on sales of other subclasses when a subclass is promoted. As we vetted this with a broad set of retail use cases with significant promotional activities, we recognized that this functionality is not adequate. We are revisiting our approach to estimating Halo effects and welcome partnerships with retailers.
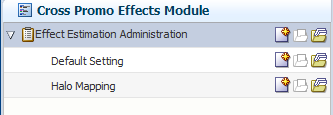
The CPEM wizards allow you to setup the Effect Estimation Administration Task and Effect Estimation Review and Approval Task.
CPEM includes these workbooks and views:
| Workbooks | Description | Views |
|---|---|---|
| Effect Estimation Administration Task |
Allows you to setup parameters and thresholds, and their overrides, before the batch run. | Default Parameters View
Cannibalization Parameter Override View |
| Effect Estimation Review and Approval Task |
Allows you to review the cross promotional elasticities and statistical information related to the analysis. Based on the statistics, you can approve the elasticities or adjust them based on business knowledge. | Cannibalization Effects View
Cannibalization Effects Drive View Cannibalization History Data View Cannibalization Statistic Report View |
The Effect Estimation Administration task allows you to setup parameters and thresholds, and their overrides, before the batch run.
This task has these views:
To build the Effect Estimation Administration workbook, perform these steps:
Click the New Workbook icon in the Effect Estimation Administration task in the Cross Promo Effects Module.
The Workbook wizard opens. Select the products for promotion effect estimation and click Next.
Select the locations for promotion effect estimation and click Next.
Select the right-hand-side (RHS) products for promotion effect estimation and click Finish.
The Effect Estimation Administration workbook is built.
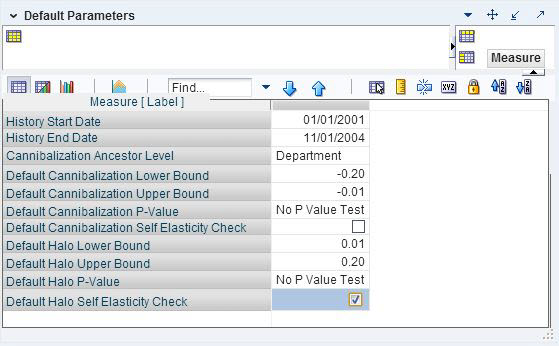
The Default Parameters view allows you to setup Default parameters and thresholds, and their overrides, before the batch run.
The Default Parameters view contains the following measures:
Default Cannibalization P-Value
The P-value is used in statistics to measure the confidence one can have in an estimate. The Default Cannibalization P-value represents the minimum confidence threshold. During the cannibalization effects estimation process, any effects with P-values below the threshold are deemed insignificant and discarded.
Default Cannibalization Self Elasticity Check
Place a check in this parameter (set to True) if you want to ensure that the cannibalization elasticity is less than its shelf elasticity. If checked, the calculated elasticity which is higher than its own elasticity will be discarded. This parameter serves as a global override.
Default Halo P-Value
The P-value is used in statistics to measure the confidence one can have in an estimate. The Default Halo P-value represents the minimum confidence threshold. During the Halo effects estimation process, any effects with P-values below the threshold are deemed insignificant and discarded.
Default Halo Self Elasticity Check
Place a check in this parameter (set to True) if you want to ensure that the halo elasticity is less than its self elasticity. If checked, the calculated elasticity which is higher than its own elasticity will be discarded. This parameter serves as a global override.
History Start Date
The first calendar date considered in the analysis. All measure data prior to this date is discarded.
History End Date
The last calendar date considered in the analysis. All measure data after this date is discarded.
Cannibalization Ancestor Level
This is the dimension in the merchandise hierarchy where Cannibalization is mined for. Only item pairs within this dimension are evaluated.
Cannibalization Lower Bound
Minimum Cannibalization value threshold. Cannibalization values that are below the threshold are discarded.
Cannibalization Upper Bound
Maximum Cannibalization value threshold. Cannibalization values that are higher than the threshold are discarded (set to zero).
Halo Lower Bound
Minimum Halo value threshold. Halo values that are below the threshold are discarded.
Halo Upper Bound
Maximum Halo value threshold. Halo values that are higher than the threshold are discarded (set to zero).
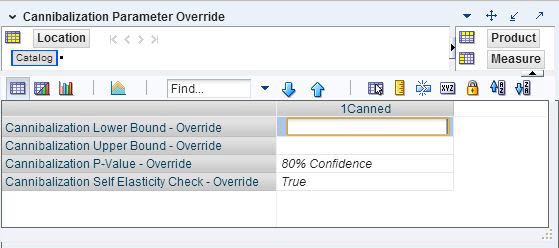
The Cannibalization Parameter Override view allows you to setup Cannibalization parameters and thresholds, and their overrides, before the batch run.
The Cannibalization Parameter Override view contains the following measures:
Cannibalization P-Value - Override
Override of the Default Cannibalization P-Value threshold. The cannibalization effects whose p-values are below the threshold are discarded.
Cannibalization Self Elasticity Check - Override
This is an override of the global setting. If checked (set to True), the calculated cannibalization elasticity which is higher than its self elasticity will be discarded.
Cannibalization Lower Bound - Override
Override of the minimum Cannibalization value threshold. Cannibalization values that are below the threshold are discarded (set to zero). The override intersection is typically higher than item/store, for example, subclass/region.
Cannibalization Upper Bound - Override
Override of the maximum Cannibalization value threshold. Cannibalization values that are higher than the threshold are discarded (set to zero). The override intersection is typically higher than item/store, for example, subclass/region.
The Halo Parameter Override view allows you to setup Halo parameters and thresholds, and their overrides, before the batch run.
The Halo Parameter Override view contains the following measures:
Halo P-Value - Override
Override of the Default Halo P-Value threshold. The Halo effects whose P-values are below the threshold are discarded.
Halo Self Elasticity Check - Override
This is an override of the global setting. If checked (set to True), the calculated halo elasticity which is higher than its self elasticity will be discarded.
Halo Lower Bound - Override
Override of the minimum Halo value threshold. Halo values that are below the threshold are discarded (set to zero). The override intersection is typically higher than item/store, for example, class/region.
Halo Upper Bound - Override
Override of the maximum Halo value threshold. Halo values that are higher than the threshold are discarded (set to zero). The override intersection is typically higher than item/store, for example, class/region.
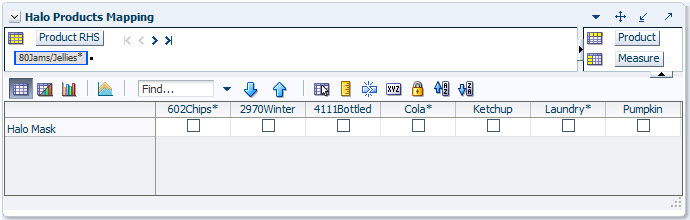
The Halo Products Mapping view allows you to specify item pairs for which a Halo relationship is mined for. For item pairs that do not have the check box selected, the system will not attempt to look for a Halo relationship.
The Halo Products Mapping view contains the following measures:
Halo Mask
This measure defines item groupings that are analyzed for Halo relationship. The item groupings are typically bound to the merchandise hierarchy and can be class to class, as in Figure 20-8. This is a writeable measure, and you are expected to use your business knowledge to mark pairs that could have Halo relationships.
The Effect Estimation Review and Approval workbook provides you the ability to review the cross promotional elasticities and statistical information related to the analysis. Based on the statistics, you can approve the elasticities or adjust them based on your business knowledge.
This task has two tabs with these views:
Cross Promotion Effects tab:
Cross Effect Statistics Reports tab:
To build the Effect Estimation Review and Approval workbook, perform these steps:
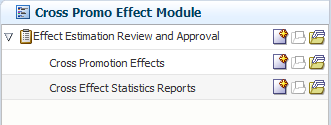
Click the New Workbook icon in the Effect Estimation Review and Approval task in the Cross Promo Effects Module.
The Workbook wizard opens. Select the products for promotion effect estimation review and approval and click Next.
Select the locations for promotion effect estimation review and approval and click Next.
Select the right-hand-side (RHS) products for promotion effect estimation review and approval and click Next.
Select the dates for promotion effect estimation review and approval and click Finish.
The Effect Estimation Review and Approval workbook is built.
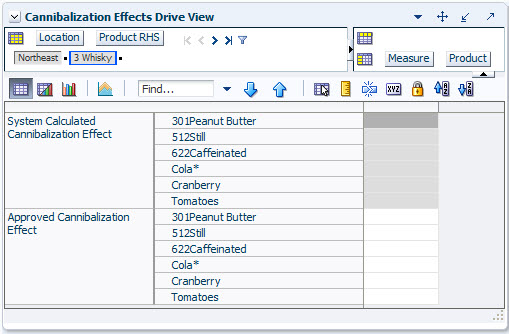
The Cannibalization Effects Drive View contains the same information as the Cannibalization Effects View, but has a different layout and a position query defined.
The Cannibalization Effects Drive view contains the following measures:
System Calculated Cannibalization Effect
This measure displays the system calculated Cannibalization effects at product/product/location level.
Approved Cannibalization Effect
This measure stores the Cannibalization value that you want to commit. By default it is the same value as the system calculated effect, but you may adjust it.
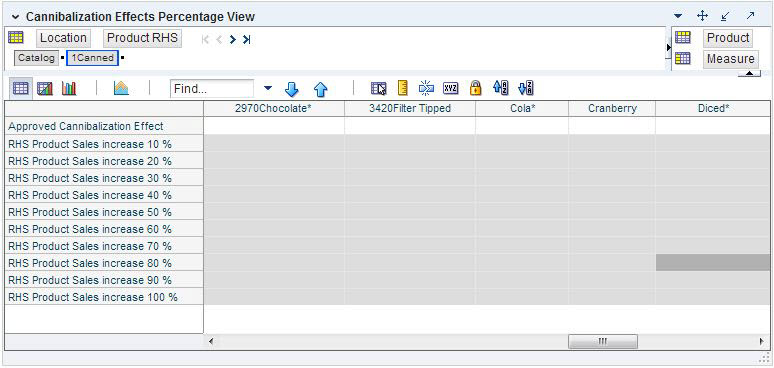
The Cannibalization Effects Percentage view allows you to review the reactions of the impacted item's demand change given a change in the driver item's demand. The percentage changes due to cannibalization effects will be displayed for a series of self lifts of the driver item.
The Cannibalization Effects Percentage View view contains the following measures:
Approved Cannibalization Effect
This measure stores the approved cannibalization effects.
RHS Product Sales Increase 10%
This measure displays the impacted item's sales percentage change when the driver item's (the RHS) sales increase by 10%.
RHS Product Sales Increase 20%
This measure displays the impacted item's sales percentage change when the driver item's (the RHS) sales increase by 20%.
RHS Product Sales Increase 30%
This measure displays the impacted item's sales percentage change when the driver item's (the RHS) sales increase by 30%.
RHS Product Sales Increase 40%
This measure displays the impacted item's sales percentage change when the driver item's (the RHS) sales increase by 40%.
RHS Product Sales Increase 50%
This measure displays the impacted item's sales percentage change when the driver item's (the RHS) sales increase by 50%.
RHS Product Sales Increase 60%
This measure displays the impacted item's sales percentage change when the driver item's (the RHS) sales increase by 60%.
RHS Product Sales Increase 70%
This measure displays the impacted item's sales percentage change when the driver item's (the RHS) sales increase by 70%.
RHS Product Sales Increase 80%
This measure displays the impacted item's sales percentage change when the driver item's (the RHS) sales increase by 80%.
RHS Product Sales Increase 90%
This measure displays the impacted item's sales percentage change when the driver item's (the RHS) sales increase by 90%.
RHS Product Sales Increase 100%
This measure displays the impacted item's sales percentage change when the driver item's (the RHS) sales increase by 100%.
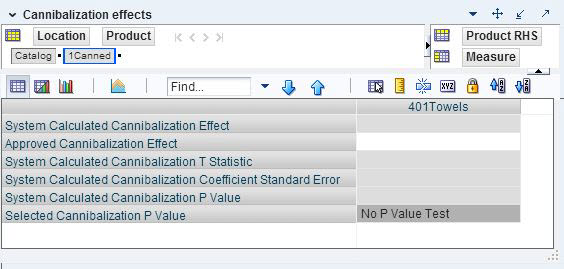
The Cannibalization Effects view allows you to review and adjust the Cannibalization cross elasticities.
The Cannibalization Effects view contains the following measures:
Approved Cannibalization Effect
This measure stores the Cannibalization value that you want to commit. By default it is the same value as the system calculated effect, but you may adjust it.
System Calculated Cannibalization Effect
This measure displays the system calculated Cannibalization effects at product/product/location level.
System Calculated Cannibalization T Statistic
This measure displays the system calculated T-Statistics for each cannibalization effect at product/product/location level.
System Calculated Cannibalization Coefficient Standard Error
This measure displays the system calculated standard error for each cannibalization effect at product/product/location level.
System Calculated Cannibalization P Value
This measure displays the system calculated P-value for each cannibalization effect at product/product/location level.
Selected Cannibalization P Value
This measure displays the user selected P-value for each cannibalization effect at product/product/location level.
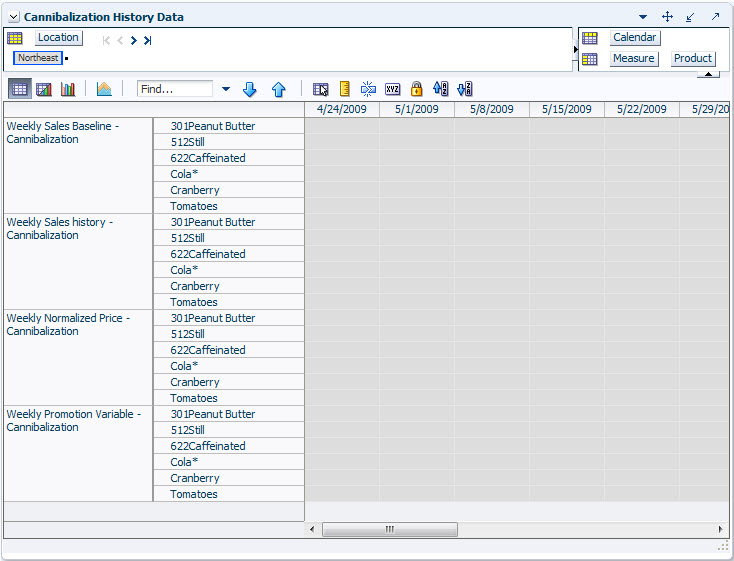
The Cannibalization History Data view allows you to view the historical facts used to estimate the Cannibalization effects.
The Cannibalization History Data view contains the following measures:
Weekly Sales Baseline - Cannibalization
This measure represents the sales history cleansed of Promo Self Effects. It is typically at an intersection higher than the final level intersections in RDF, for example, subclass/region/week.
Weekly Sales History - Cannibalization
This measure represents the total sales history. It is typically at an intersection higher than the final level intersections in RDF, for example, subclass/region/week.
Weekly Normalized Price - Cannibalization
This measure stores the normalized price. It is typically at an intersection higher than the final level intersections in RDF, for example, subclass/region/week. There is no guarantee that all items in a subclass (or region) have the same price, hence the need to normalize them.
Weekly Promotion Variable - Cannibalization
This measure stores the information if any promotion was active for a given time period. It is typically at an intersection higher than the final level intersections in RDF, for example, subclass/region/week.
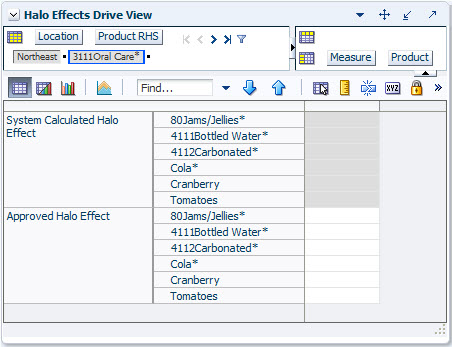
The Halo Effects Drive View contains the same information as the Halo Effects View, but has a different layout and a position query defined.
The Halo Effects Drive View contains the following measures:
System Calculated Halo Effect
This measure displays the system calculated Halo effects at product/product/location level.
Approved Halo Effect
This measure stores the Halo value that you want to commit. By default it is the same value as the system calculated effect, but you may adjust it.
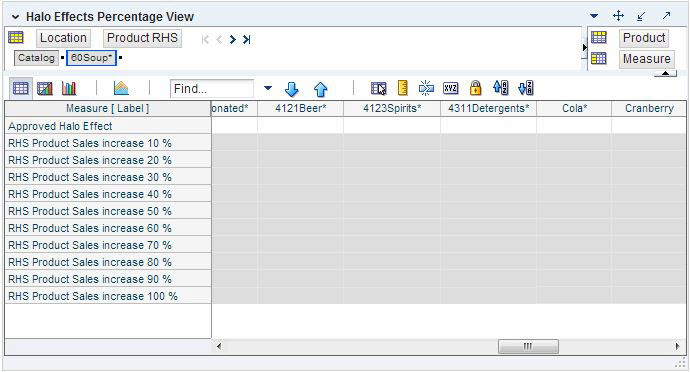
The Halo Effects Percentage view allows you to review the reactions of the impacted item's demand change given a change in the driver item's demand. The percentage change due to Halo effects will be displayed for a series of self lifts of the driver item.
The Halo Effects Percentage view contains the following measures:
Approved Halo Effect
This measure stores the approved Halo effects.
RHS Product Sales Increase 10%
This measure displays the impacted item's sales percentage change when the driver item's (the RHS) sales increase by 10%.
RHS Product Sales Increase 20%
This measure displays the impacted item's sales percentage change when the driver item's (the RHS) sales increase by 20%.
RHS Product Sales Increase 30%
This measure displays the impacted item's sales percentage change when the driver item's (the RHS) sales increase by 30%.
RHS Product Sales Increase 40%
This measure displays the impacted item's sales percentage change when the driver item's (the RHS) sales increase by 40%.
RHS Product Sales Increase 50%
This measure displays the impacted item's sales percentage change when the driver item's (the RHS) sales increase by 50%.
RHS Product Sales Increase 60%
This measure displays the impacted item's sales percentage change when the driver item's (the RHS) sales increase by 60%.
RHS Product Sales Increase 70%
This measure displays the impacted item's sales percentage change when the driver item's (the RHS) sales increase by 70%.
RHS Product Sales Increase 80%
This measure displays the impacted item's sales percentage change when the driver item's (the RHS) sales increase by 80%.
RHS Product Sales Increase 90%
This measure displays the impacted item's sales percentage change when the driver item's (the RHS) sales increase by 90%.
RHS Product Sales Increase 100%
This measure displays the impacted item's sales percentage change when the driver item's (the RHS) sales increase by 100%.
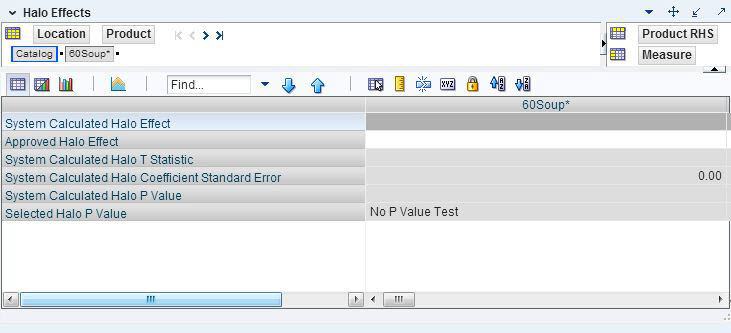
The Halo Effects view allows you to review and adjust the Halo cross elasticities.
The Halo Effects view contains the following measures:
Approved Halo Effect
This measure stores the Halo value that you want to commit. By default it is the same value as the system calculated effect, but you may adjust it.
System Calculated Halo Effect
This measure displays the system calculated Halo effects at product/product/location level.
System Calculated Halo T-Statistic
This measure displays the system calculated T-Statistics for each Halo effect at product/product/location level.
System Calculated Halo Coefficient Standard Error
This measure displays the system calculated standard error for each Halo effect at product/product/location level.
System Calculated Halo P-Value
This measure displays the system calculated P-value for each Halo effect at product/product/location level.
Selected Halo P-Value
This measure displays the user selected P-value for each Halo effect at product/product/location level.
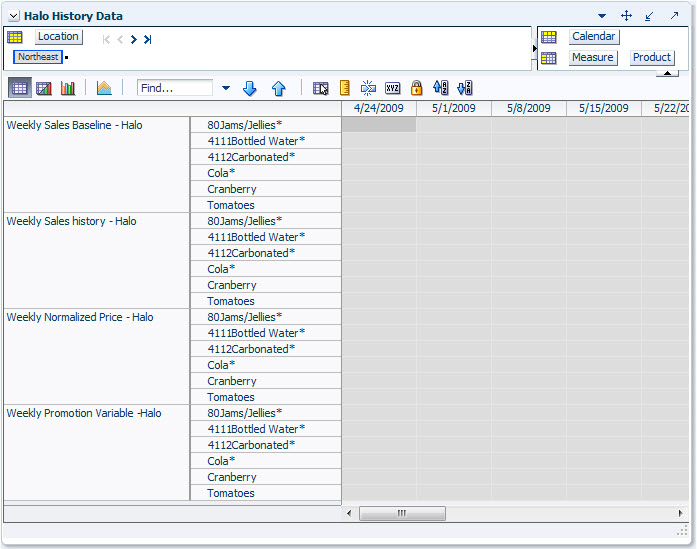
The Halo History Data view allows you to view the historical facts used to estimate the Halo effects.
The Halo History Data view contains the following measures:
Weekly Sales Baseline - Halo
This measure represents the sales history cleansed of Promo Self Effects. It is typically at an intersection higher than the final level intersections in RDF, for example, class/region/week.
Weekly Sales History - Halo
This measure represents the total sales history. It is typically at an intersection higher than the final level intersections in RDF, for example, class/region/week.
Weekly Normalized Price - Halo
This measure stores the normalized price. It is typically at an intersection higher than the final level intersections in RDF, for example, class/region/week. There is no guarantee that all items in a subclass (or region) have the same price, hence the need to normalize them.
Weekly Promotion Variable - Halo
This measure stores the information if any promotion was active for a given time period. It is typically at an intersection higher than the final level intersections in RDF, for example, class/region/week.
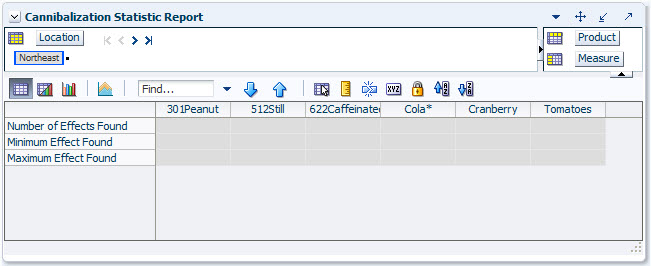
The Cannibalization Statistic Report view allows you to view Cannibalization statistics on the cross effects.
The Cannibalization Statistic Report view contains the following measures:
Number of Effects Found
This measure displays the number of Cannibalization cross effects found for a given intersection. A typical example for an intersection would be subclass/region.
Minimum Effect Found
This measure displays the minimum value of the Cannibalization effects found for a given intersection. A typical example for an intersection would be subclass/region.
Maximum Effect Found
This measure displays the maximum value of the Cannibalization effects found for a given intersection. A typical example for an intersection would be subclass/region.
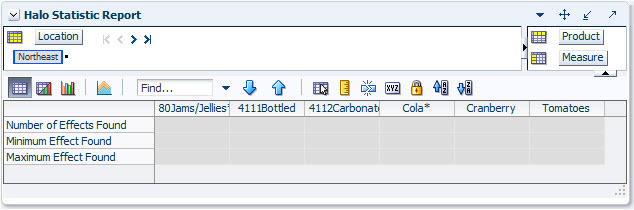
The Halo Statistic Report view allows you to view Halo statistics on the cross effects.
The Halo Statistic Report view contains the following measures:
Number of Effects Found
This measure displays the number of Halo cross effects found for a given intersection. A typical example for an intersection would be class/region.
Minimum Effect Found
This measure displays the minimum value of the Halo effects found for a given intersection. A typical example for an intersection would be class/region.
Maximum Effect Found
This measure displays the maximum value of the Halo effects found for a given intersection. A typical example for an intersection would be class/region.