| Oracle® Retail Demand Forecasting User Guide for the RPAS Fusion Client Release 16.0 E91109-03 |
|

 Previous |
 Next |
| Oracle® Retail Demand Forecasting User Guide for the RPAS Fusion Client Release 16.0 E91109-03 |
|
Previous |
Next |
Grade is a clustering tool that provides insight into how various parts of a retailer's operations can be grouped together. Typically, a retailer may cluster stores over item sales to create logical groupings of stores based upon sales of particular products. This provides increased visibility to where products are selling, and it allows the retailer to make more accurate decisions in merchandising.
Beyond this traditional use of clusters, Grade is flexible enough to cluster any business measure based on products, locations, time, promotions, customers, or any hierarchy configured in the solution.
Key Grade functionality includes:
Two methods of creating Grades/Clusters:
Breakpoints–the sorting of data points into groups based on user-defined indexes
Clustering (or the BaNG) Algorithm–the optimization of data points into clusters based on the user-defined number of clusters
Group By capabilities: support the segmentation of clusters for more detailed and focused cluster generation
Clustering statistics: provide insight into the relationship of members within a cluster and how all clusters relate to one another
Cluster What-if: allows user changes to members assigned to clusters and the review of recalculated clustering statistics
Regardless of the method employed to create clusters, Grade is designed to support the decision-making process necessary to create effective and actionable groupings of data. This chapter describe the process to generate grades/clusters and analyze results. All of Grade's functionality exists in the:
Grade supports two cluster methods: Breakpoint and BaNG. The following sections describe these two methods.
Breakpoint method clusters, or groups, data points based on user-defined thresholds, or breakpoints. Breakpoints are properly defined by entering a decreasing sequence of real numbers that terminate in a value of zero. Breakpoints are entered in the Breakpoints Administration Workbook. Breakpoints are then used to cluster data points based on the index to average of each data point.
Example 19-1 Breakpoint
While clustering stores, if the user has entered the breakpoints 2.0, 1.5, 1.0, 0.5, and 0.0, the system will generate five grades. Stores that sell more than 2.0 times the average sales (over all stores) will be assigned to the highest grade, and stores that sell less than 0.5 times the average will be assigned to the lowest grade.
Index to Average is the average sales of the stores in each grade divided by the average sales of all stores. This value provides a relative indication of how well a grade performed compared to the total store average. A value of 1.00 indicates that average sales in the grade were the same as average sales across the chain. A value of 3.74, for example, indicates that average sales in the grade were 3.74 times the chain average.
The BaNG algorithm automatically generates optimal clusters based on user-specified number of clusters and clustering criteria. The algorithm provides a means for clustering data based on data distributions. For example, while clustering on weekly store sales data, the BaNG algorithm considers the Euclidean distance of the individual Store/week level data points from a cluster center to determine the clusters. This is different from the Breakpoint method, where clustering is performed based on average sales.
The BaNG algorithm iteratively updates cluster centers while considering the distance of each data vector from the cluster centers and its contribution to each cluster center. For every data point, cluster centers are ranked based on their distance from the data point within each iteration.
Additionally, the cluster centers are guided, using a control parameter, to gradually spread from the center of the distribution to their optimal locations.
The BaNG algorithm is a non-trivial extension of the K-means clustering approach. It is usually faster than the K-means and is guaranteed to converge.
The BaNG algorithm generates statistically optimal clusters based on the number of clusters specified by the user. Breakpoint generates clusters based on user input breakpoints, and the number of clusters generated depends on the breakpoints.
In order to generate store clusters that vary by Dept, users need to specify a Group By option of Dept. Breakpoint will cluster stores based on the ratio of total store sales versus the average total store sales within each Group By intersection. BaNG can consider an additional dimension for generating the clusters. For example, BaNG can cluster based on weekly sales of each stores within the Dept. Here, weekly sales are the coordinates over which the clustering is performed.
When implemented in a global domain environment, the following workbooks are available to be accessed from the Master domain:
Breakpoint Administration Workbook
|
Note: The Breakpoint Administration workbook is accessible from the Master domain to allow for the centralized administration of breakpoints. |
The remaining Grade workbooks can only be accessed from local domains. These include:
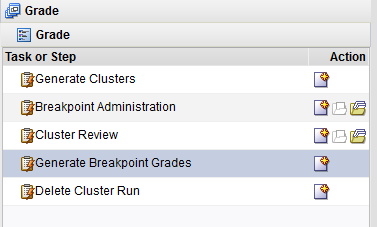
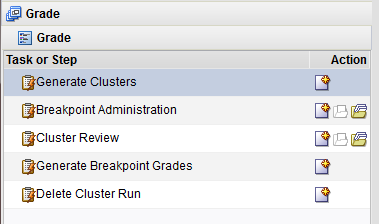
The Grade tasks and wizards allow you to generate grades/clusters and analyze results.
The Grade tasks and wizards include:
| Task Workbooks | Description |
|---|---|
| Breakpoint Administration Task |
Allows you to set the index to average for each breakpoint. |
| Delete Cluster Run Task |
Allows you to delete clusters from the system based on Cluster Run Label and generation date (birth date). |
| Cluster Review Task |
Allows you to support Grade/cluster What-if functionality; the re-assignment of members to grades/clusters on the fly and the recalculation of clustering statistics. |
| Generate Breakpoint Grades Task |
Allows you to range the input data and hierarchies that will be used to produce grades based on the Breakpoints method. |
| Generate Clusters Task |
Allows you to range the input data and hierarchies that will be used to produce clusters based on the Clustering (BaNG) method. |
The Breakpoint Administration task is used with the breakpoints method of grading. In this task, you set the index to average for each breakpoint. This includes the ability to set multiple breakpoint configurations to allow for Grades to be produced and compared using different breakpoint settings.
To build the Breakpoint Administration workbook, perform these steps:
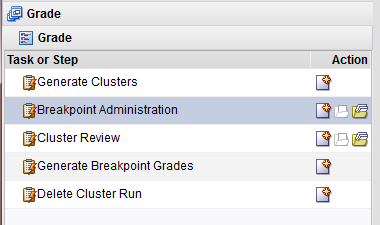
Click the New Workbook icon in the Breakpoint Administration task in the Grade activity.
The Breakpoint Administration View opens.
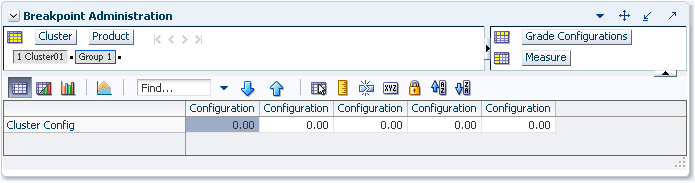
If the breakpoints method is to be used to generate grades, you must go through the process of setting of the Index to Average for each grade's breakpoint range. Figure 19-2 displays an example of the Breakpoint Administration view:
On the Breakpoint Administration view, for a Configuration/Cluster intersection, set the Index to Average to be used by the Breakpoints algorithm for sorting data points into grades. The number of configurations available in this view is based on the Maximum Number of Clusters configured in the Grade Plug-In. Only one configuration is required for use with the breakpoints method.
Breakpoints should be set from high Index to Average to low Index to Average, starting with the first Cluster ordered in the list of available clusters.
|
Note: The Cluster Labels may vary based on the configuration. |
Example: If the Index to Average is set for Configuration 01 as:
1 Cluster01: 1.25
2 Cluster02: 0.75
3 Cluster03: 0.50
4 Cluster04: 0.25
5 Cluster05: 0.00
Using this example, the Breakpoints algorithm groups data based on the following:
| Data | Description |
|---|---|
| 1 Cluster01 | Sort all data with an Index to Average at or above 1.25 into 1 Cluster01. |
| 2 Cluster02 | Sort all data with an Index to Average from 0.75 to 1.24 into 2 Cluster02. |
| 3 Cluster03 | Sort all data with an Index to Average from 0.50 to 0.74 into 3 Cluster03. |
| 4 Cluster04 | Sort all data with an Index to Average from 0.25 to 0.49 into 4 Cluster04. |
| 5 Cluster05 | Sort all data with an Index to Average from 0.00 to 0.24 into 5 Cluster05. |
| Junk Cluster | Using the previous example, all data points with an Index to Average that is less than 0.00 will be sorted into the Junk Cluster. |
| No Cluster | Any data points will null values in history (no loaded history) will not be graded. Refer to the Cluster Review Task for more information on Cluster Membership results. |
The Delete Cluster Run wizard allows you to delete clusters from the system based on Cluster Run Label and generation date (birth date).
To run the Delete Cluster Run wizard, perform these steps:
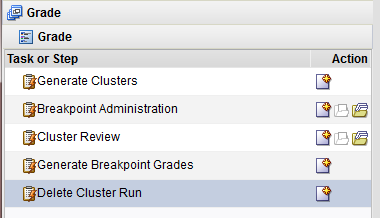
Click the New Workbook icon in the Delete Cluster Run task in the Grade activity.
This wizard window is a single select pick-list that includes the Cluster Run Label and the date/time stamp (birth date) for all cluster runs currently stored in the system. Select the Cluster Run Label to be deleted.
Select Next or Finish.
If Next is selected, Delete Cluster Run Succeeded is displayed once the cluster deletion process is completed.
The Cluster Review workbook is a view of grade or cluster results and statistics. This workbook supports Grade/cluster What-if, the re-assignment of members to Grades/clusters on the fly, and the recalculation of clustering statistics. In addition, measures from different cluster runs may be inserted into the workbook to compare results.
To run the Cluster Review wizard, perform these steps:
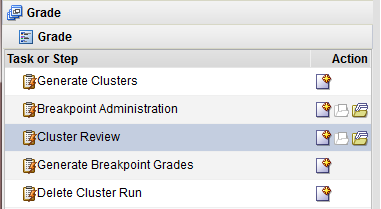
Click the New Workbook icon in the Cluster Review task in the Grade activity.
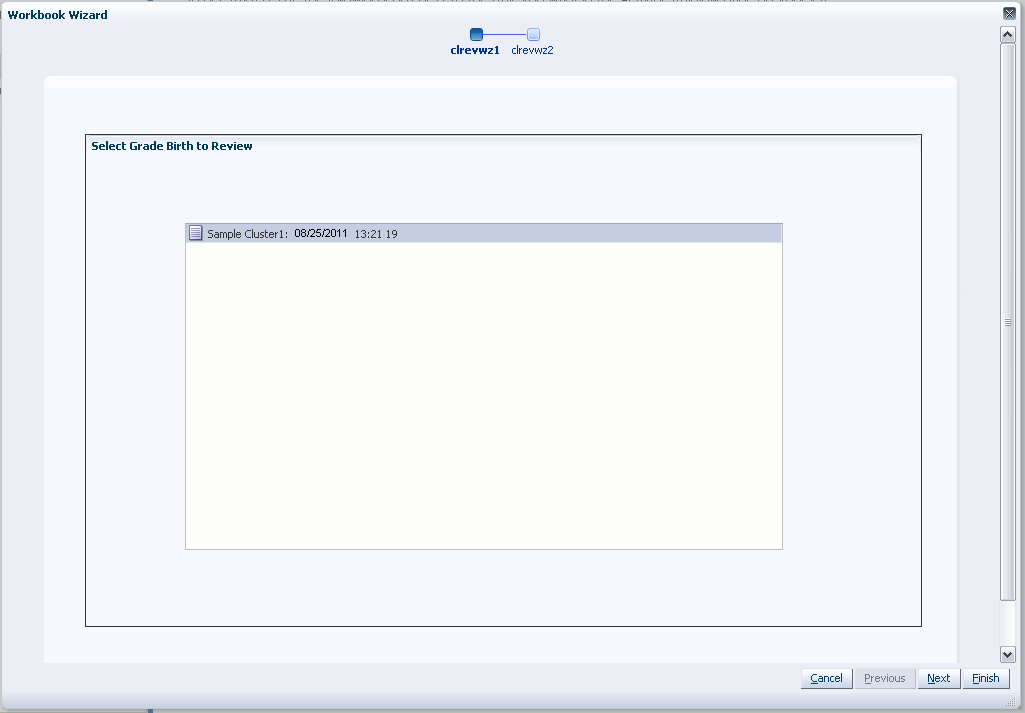
The Workbook wizard opens. Select the Grade Birth you want to review and click Finish.
The Cluster Review workbook is built.
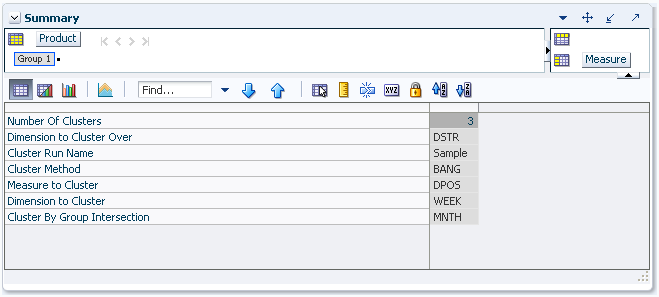
The Cluster Input Summary view allows you to see the settings used to generate the grades/clusters being reviewed in the workbook.
Number of Clusters
Displays the number of clusters used during the cluster generation process.
Dimension to Cluster Over
Displays the Cluster Over dimension selected by the user during the cluster generation process.
The algorithm uses the positions in this dimension as the coordinates when clustering. Internally, data will be aggregated to this level before performing the clustering.
For example, when using the item/store/week level sales data to generate store clusters, the user has the option of specifying a dimension, such as Week, that will be used to aggregate the sales data to. In this case, the algorithm considers Store/Week positions and clusters stores based on their weekly sales.
A value will only be displayed in this field if the BaNG method was used.
Cluster Run Name
Displays the name assigned by the user to the cluster run at the time the clusters were generated.
Measure to Cluster
Displays the measure selected as the clustering Data Source during the cluster generation process.
Dimension to Cluster
Displays the Cluster dimension selected by the user during the cluster generation process.
Cluster By Group Intersection
Displays Group By dimensions if selected during the cluster generation process. For example, while clustering stores by time period, such as quarter, the Cluster By Group is Quarter (Qrtr) within the Calendar hierarchy. This means that clusters are generated one quarter at a time.
The Generate Breakpoint Grades wizard allows you to range the input data and hierarchies that will be used to produce grades based on the Breakpoints method.
To run the Generate Breakpoint Grades wizard, perform these steps:
Click the New Workbook icon in the Generate Breakpoint Grades task in the Grade activity.
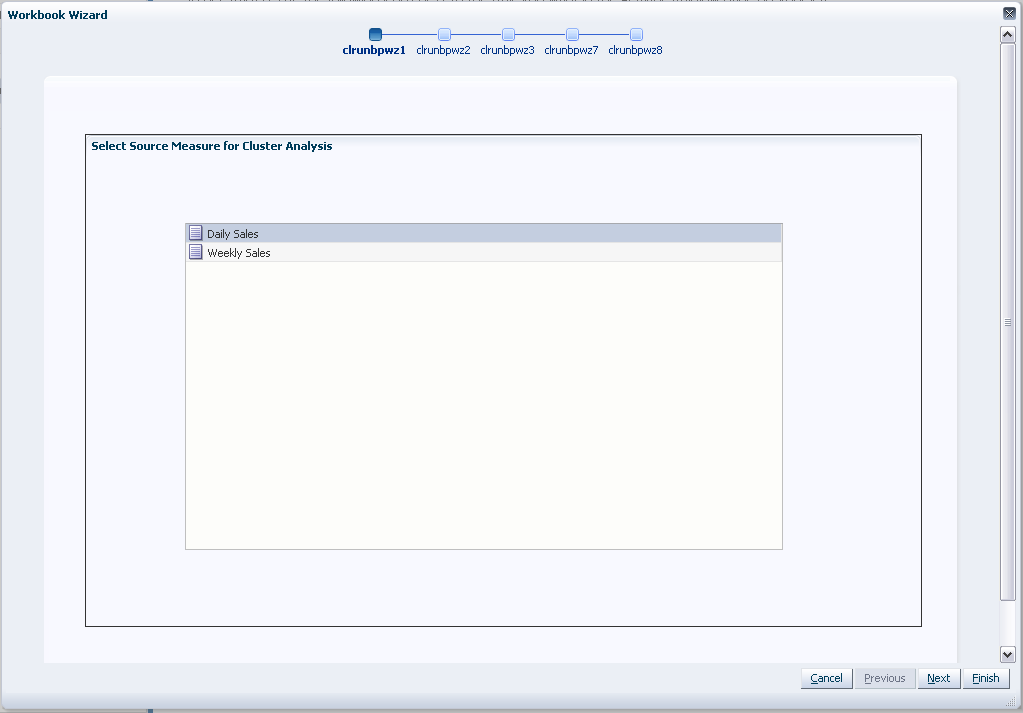
The Workbook wizard opens. Select the source measure for Cluster Analysis and click Next.
The options include all source measures defined at the time of the configuration.
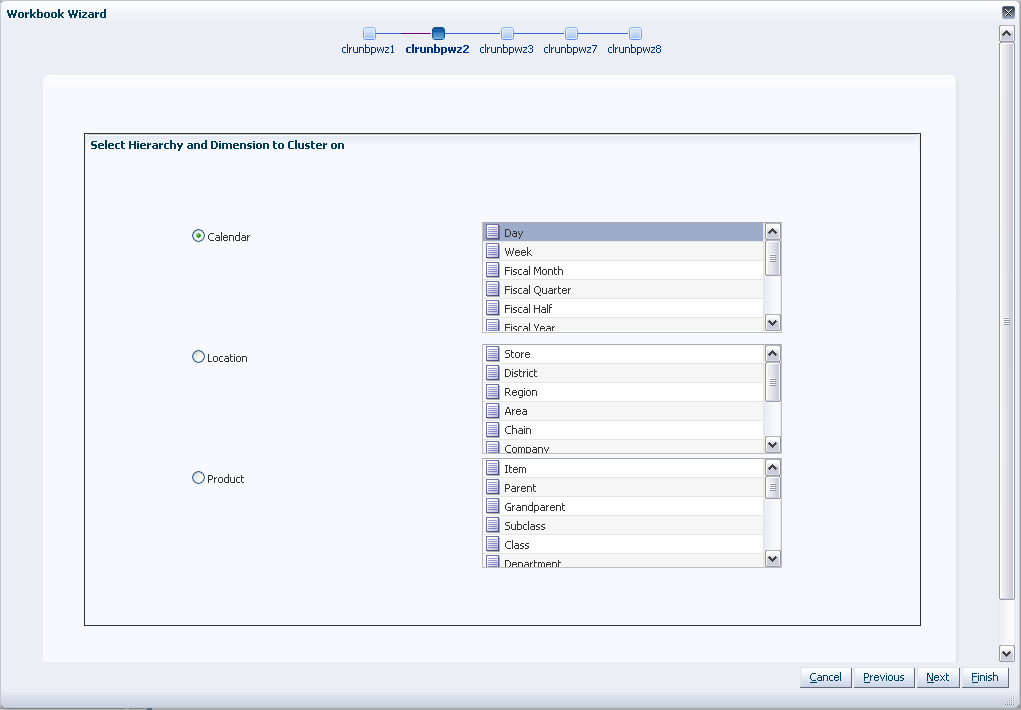
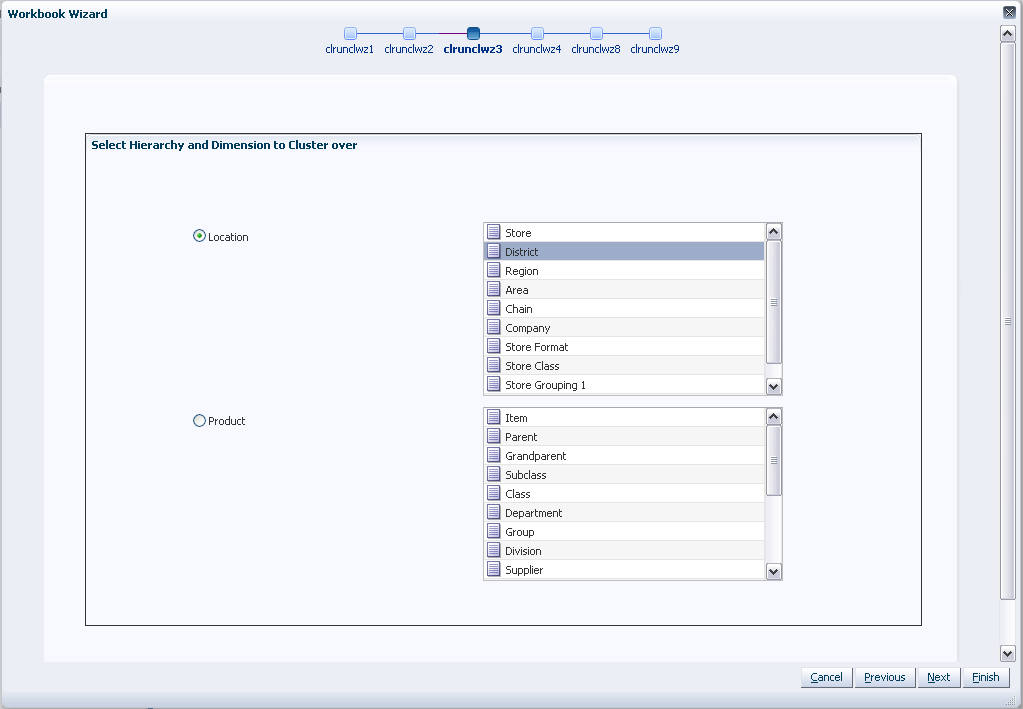
Select the Hierarchy and Dimension to Cluster On and click Next.
The Cluster On dimension is the dimension that will be clustered. For example, while generating store clusters, store would be the Cluster On dimension. All positions in this dimension are sorted into grades based on the Breakpoints Configuration that will be selected later in this wizard process.
|
Note: The dimension chosen should be at or higher than the base intersection of the selected Source Measure. |
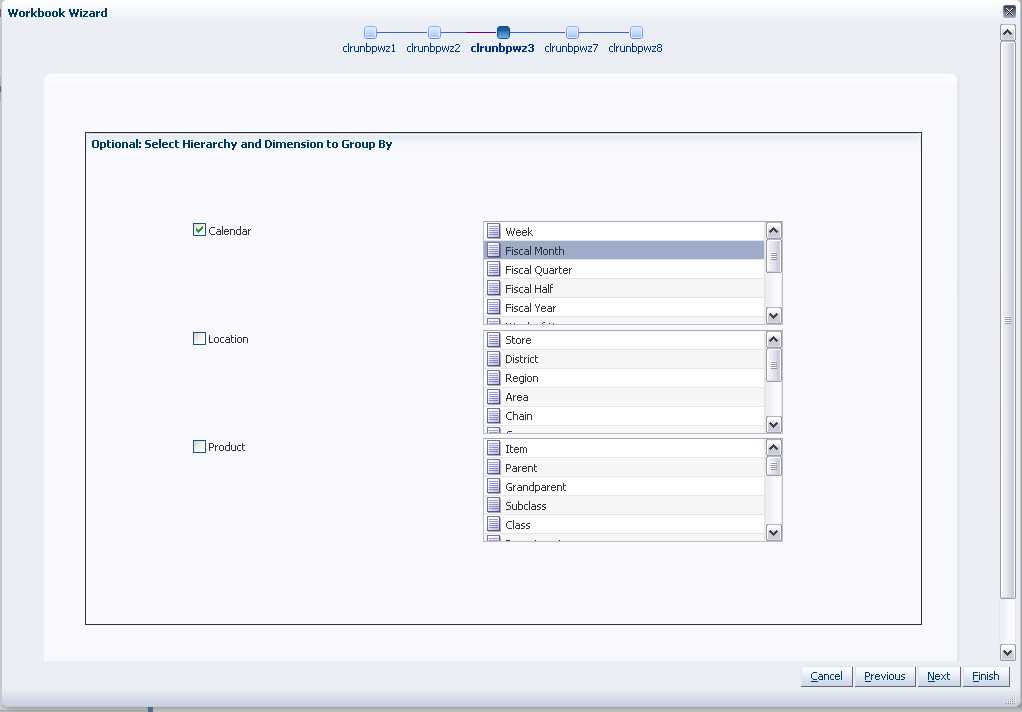
Optional Step
Select the Hierarchy and Dimension to Group By and click Next.
By Group is an optional setting that is used to partition data along a hierarchy dimension. This functionality allows for grades to be further segmented along multiple hierarchy dimensions. Grades are generated independently for each position within the selected dimensions. The dimensions displayed are equal to or higher than the Cluster On dimension.
For example, while clustering stores by Dept, that is, cluster stores by a Department at a time, the Cluster By Group is Department.
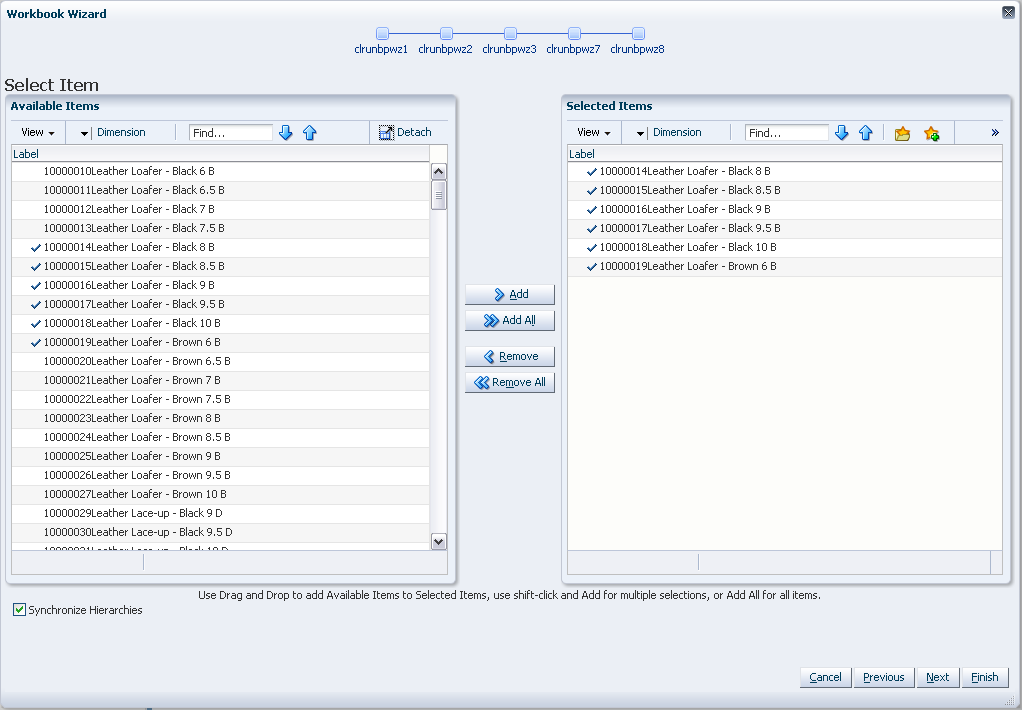
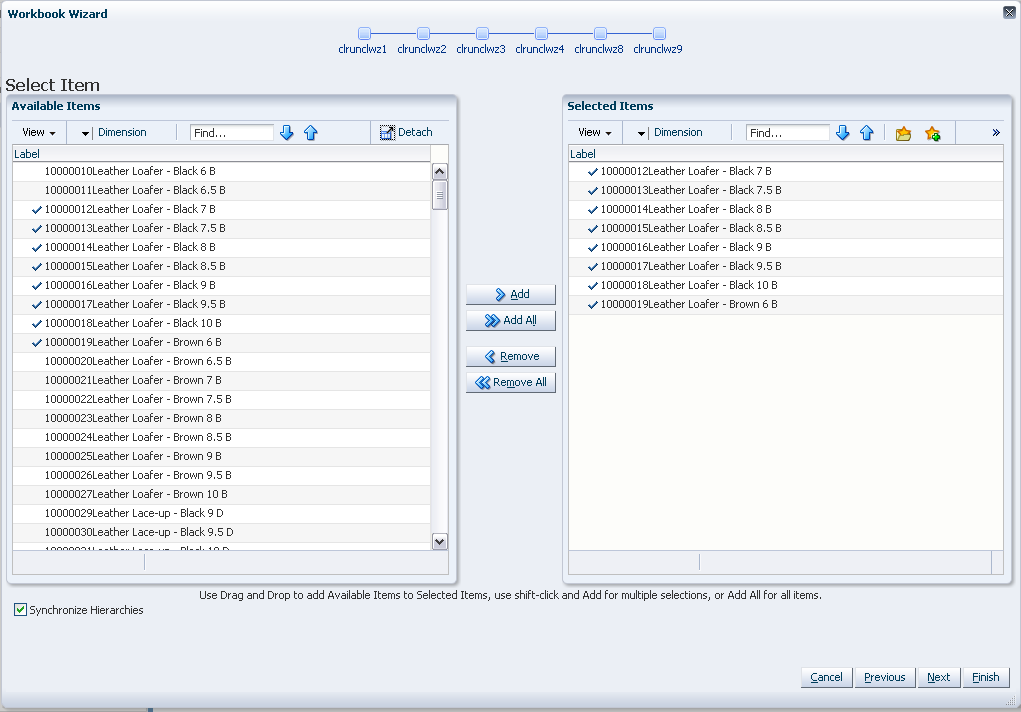
Select the products for which you want to generate clusters and click Next.
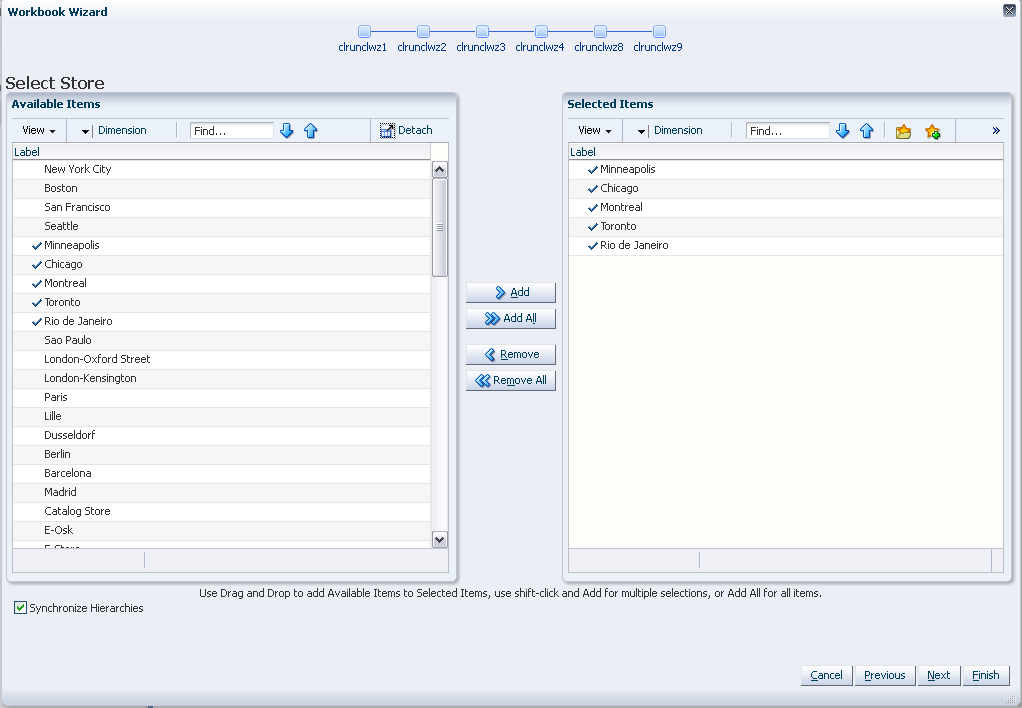
Select the locations for which you want to generate clusters and click Next.
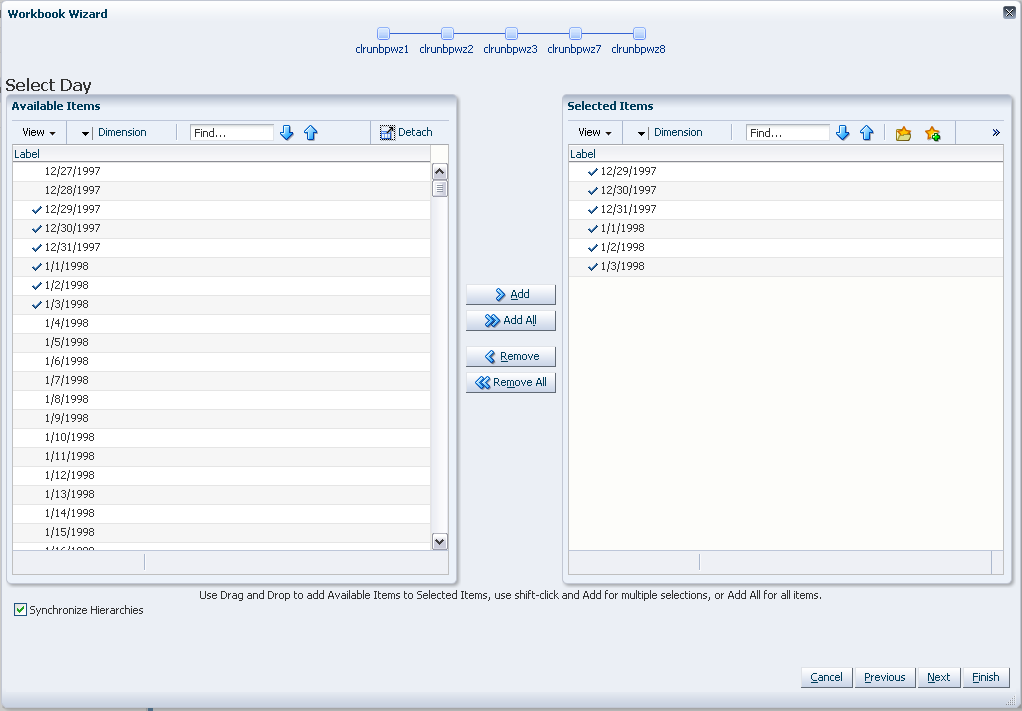
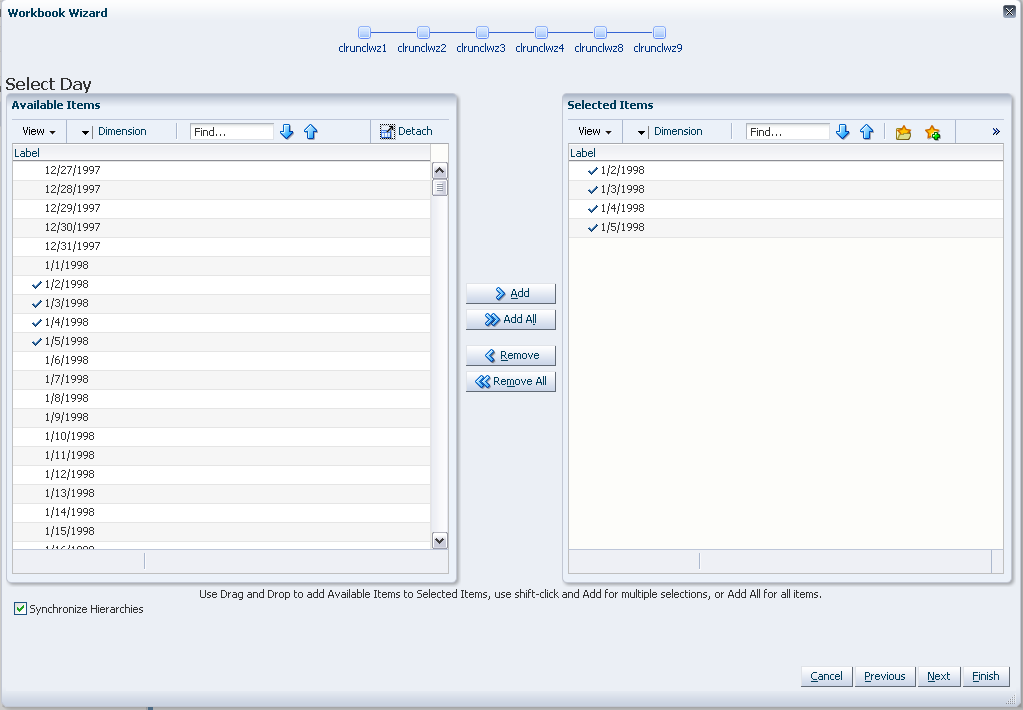
Select the time periods that you want to be considered when generating clusters and click Next.
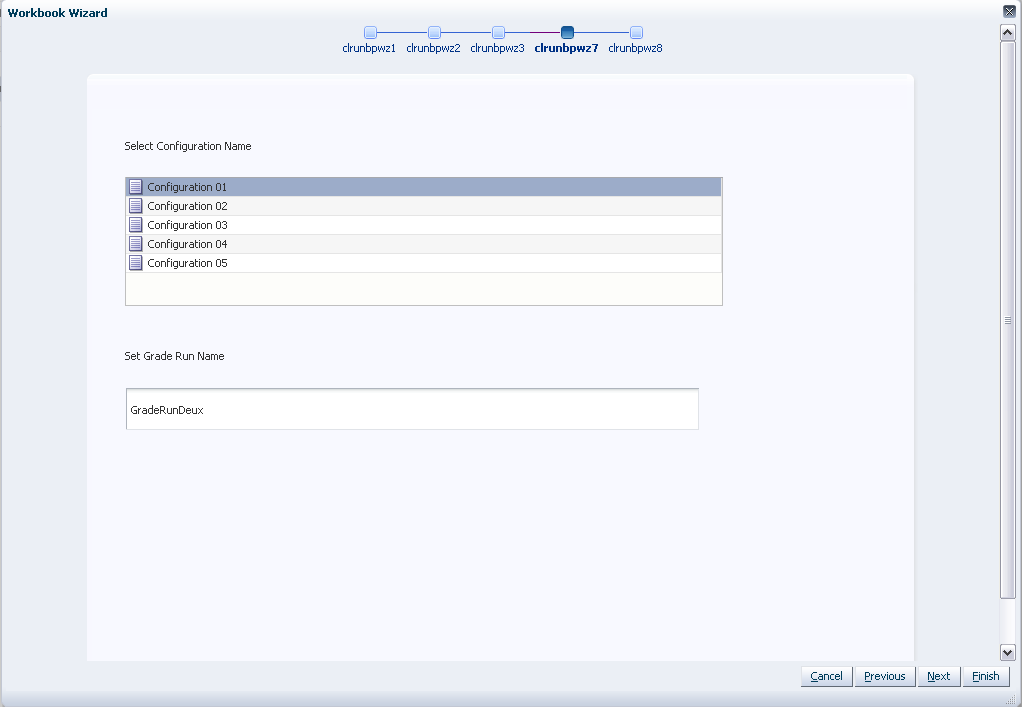
Select the Breakpoint Configuration that will be used to produce the grades. These configurations must be set prior to generating grades using the Breakpoint Administration task.
Click Next.
Set the Grade Run Name. Assign a label that will be used to identify the clustering run.
Select Next or Finish.
If Next is selected, Break Point Run Succeeded is displayed once the grading process is completed. If Finish is selected this message will be skipped.
The Generate Clusters wizard allows you to range the input data and hierarchies that will be used to produce clusters based on the Clustering (BaNG) method.
To run the Generate Clusters wizard, perform these steps:
Click the New Workbook icon in the Generate Clusters task in the Grade activity.
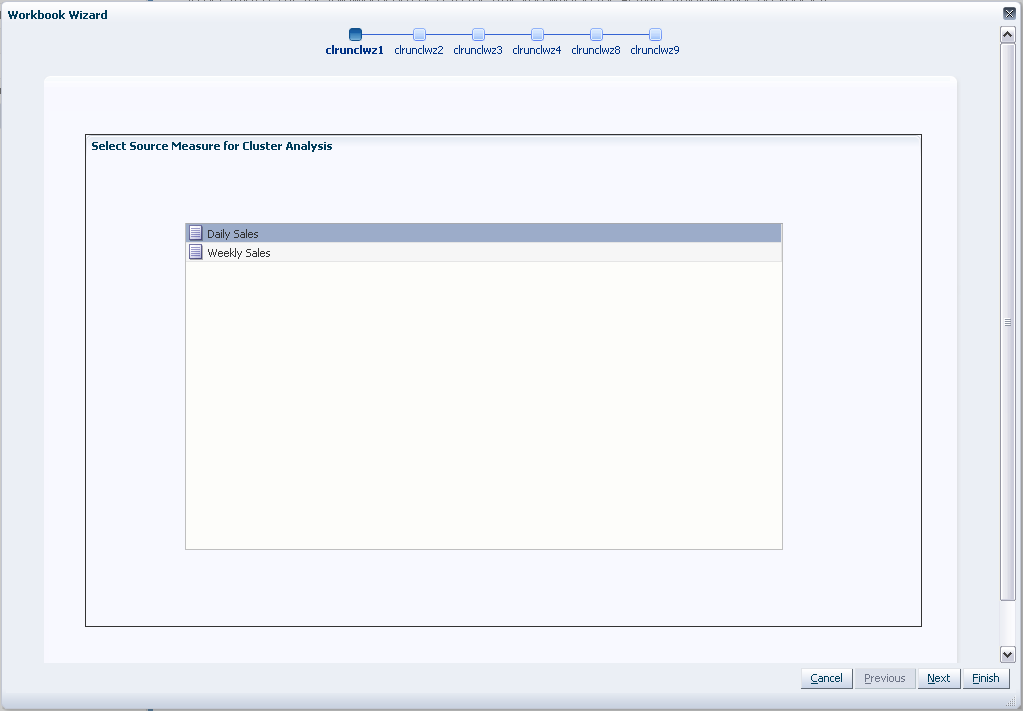
The Workbook wizard opens. Select the source measure for Cluster Analysis and click Next.
The options include all source measures defined at the time of the configuration.
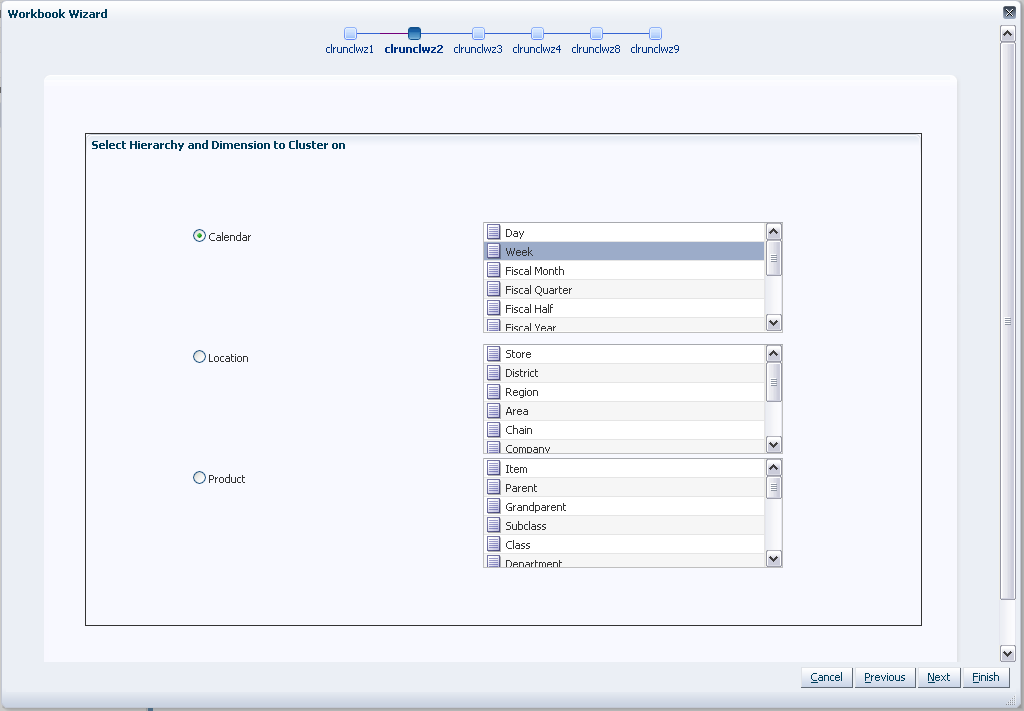
Select the Hierarchy and Dimension to Cluster On and click Next.
The Cluster Over dimension allows you to define the dimension that will be used for clustering. The algorithm uses the positions in this dimension as the co-ordinates when clustering. Internally, data will be aggregated to this level before performing the clustering. For example, when using item/store/week level sales data to generate store clusters, the user has the option of specifying a dimension, such as Week, to which sales data will be aggregated. In this case, the algorithm considers Store/Week positions and clusters stores based on their weekly sales.
|
Note: The hierarchies presented in this wizard window include all hierarchies associated with the base intersection of the source measure except the hierarchy and dimension chosen to Cluster On. |
|
Note: The dimension chosen should be at or higher than the base intersection of the selected Source Measure. |
Optional Step
Select the Select Hierarchy and Dimension to Group By and click Next.
By Group is an optional setting that is used to partition data along a hierarchy dimension. This functionality allows for clusters to be further segmented along multiple hierarchy dimensions. Clusters are generated independently for each position within the selected dimensions. The dimensions displayed are equal to or higher than the Cluster On and Cluster Over dimensions.
For example, while clustering stores by Dept, that is, cluster stores by a Department at a time, the Cluster By Group is Department.
Select the products for which you want to generate clusters and click Next.
Select the locations for which you want to generate clusters and click Next.
Select the time periods that you want to be considered when generating clusters and click Next.
Assign a label that will be used to identify the clustering run.
Click Next.
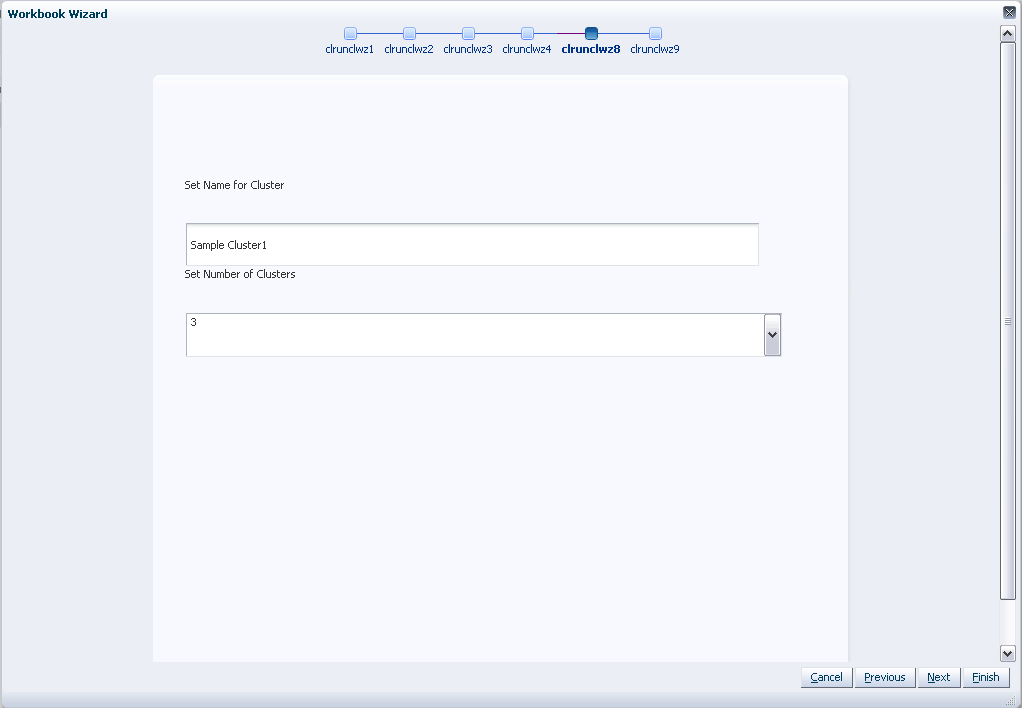
Set the name and number of clusters:
Set the name. Assign a label that will be used to identify the clustering run.
Set the number of clusters. Define the number of clusters that are generated during the cluster generation process. If a Group By dimension was selected, this is the number of clusters that will be generated for each data partition within the dimension. The number of clusters that may be generated is based on the maximum number of clusters configured in the Grade configuration. refer to the Oracle Retail Grade Configuration Guide for more information on the Grade solution configuration.
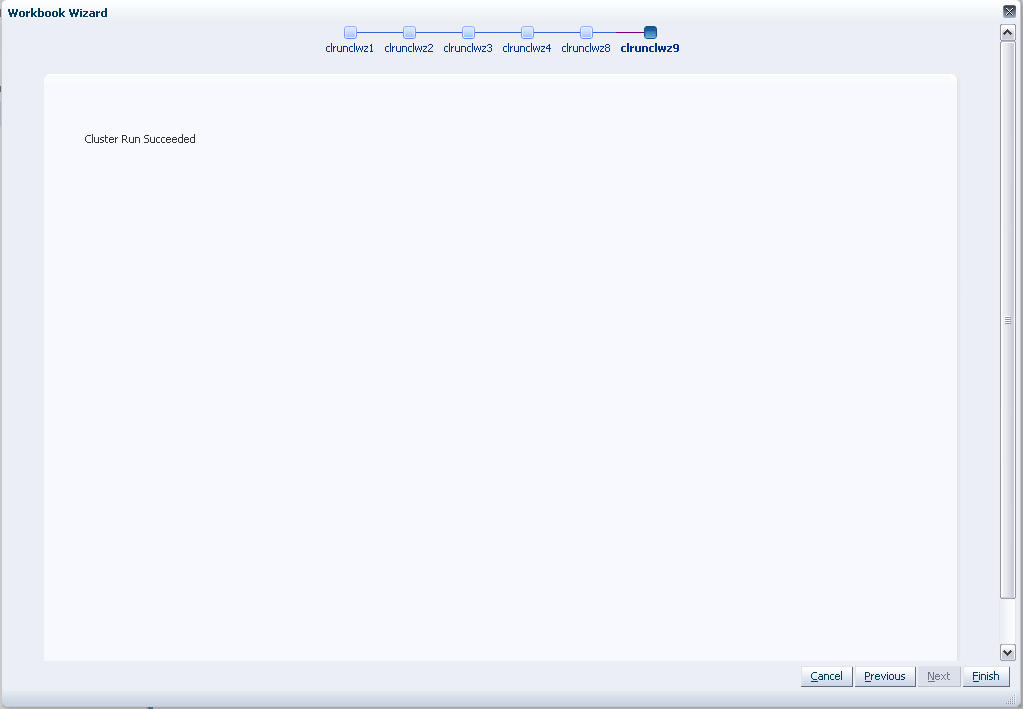
Select Next or Finish.
If Next is selected, Cluster Run Succeeded is displayed once the grading process is completed as shown in Figure 19-23. If Finish is selected this message will be skipped.