|
|
Now you understand how a flow of events for memory leak detection works and the basic functions of the user interface, it is time to get to know how powerful the Memory Leak Detector actually is in action. This part of the user guide describes the different tabs of the interface in detail and how the Memory Leak Detector works when monitoring a Java application with a real memory leak. Each tab of the interface will be explained in detail in this section.
The following topics will be covered in this section:
From the Trend tab (see Figure 3-1), you start the analysis of your applications. The object types with the highest growth in bytes/sec are marked red (darkest) in the Trend Analysis table and they are listed at the top of the table. For each update, the list can change and the type that was the highest move down the list. The object types listed in Figure 3-1 are fetched from an example application, where you can suspect a memory leak at the objects marked red.
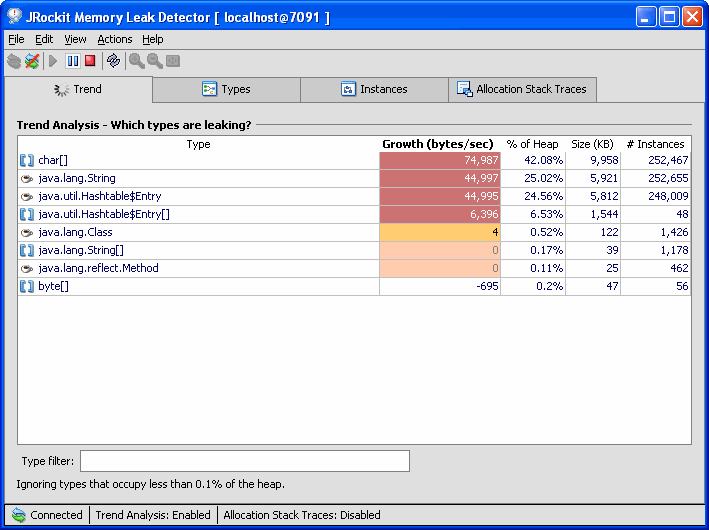
Table 3-1 explains what each column in the Trend tab displays.
-Xmanagement option turned on.The trend analysis should start automatically. If not, click the Start button to start the trend analysis.
If you have an application with a memory leak, the trend analysis can look something like Figure 3-1.
This operation freezes the updating of the trend analysis in the Trend tab and you can start to analyze the application. If you want to view more data from the same analysis run, click the Play button again and the Memory Leak Detector resumes displaying samples from the application.
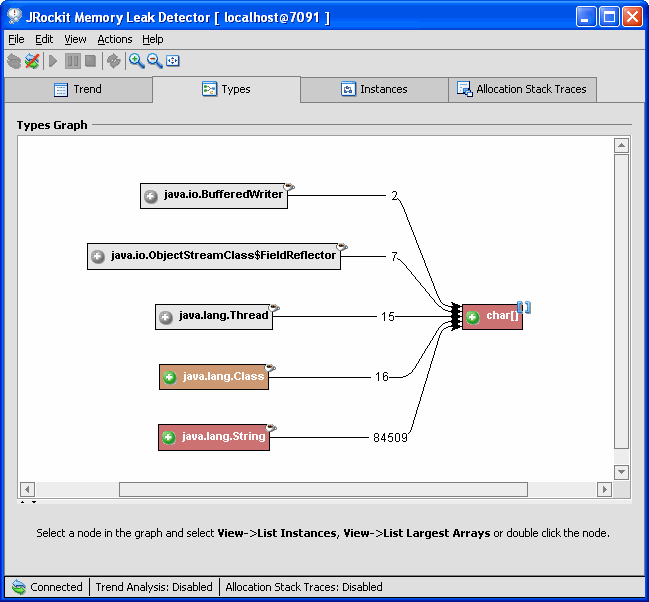
The Types tab appears (see Figure 3-2). For instructions on how to investigate further, see To Get Closer to the Memory Leaking Object.
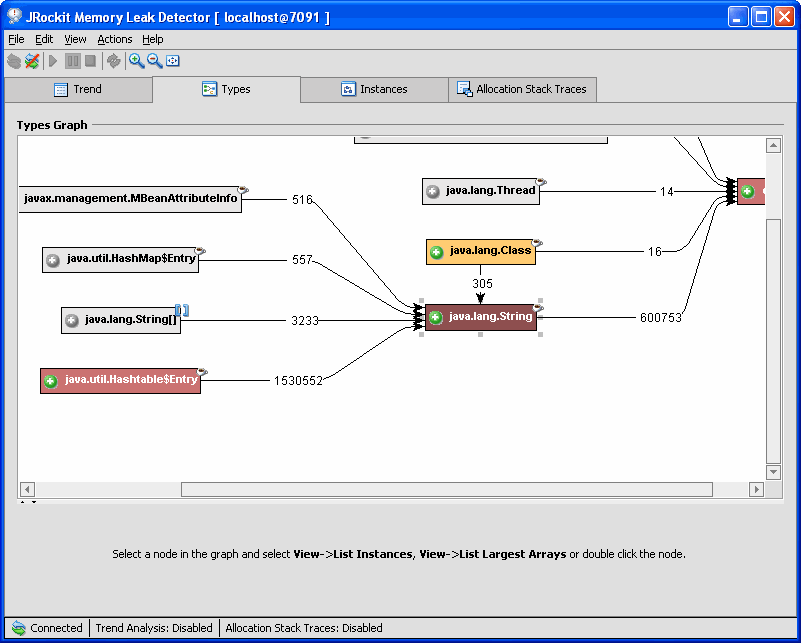
Once you have found a suspected memory leak (a type that is high in growth and is colored red), you investigate the suspected leak further in the Types tab, see Figure 3-2. Before anything is displayed in this tab, you need to start the investigation by selecting a type from the Trend tab, see To Start the Investigation.
The Types tab offers a view of the relationships between all the types pointing to the type you are investigating. For each type you also see a number, which is the number of instances that point to that type.
The color red (dark) means that the type has a high growth rate (which may or may not be related to a memory leak).
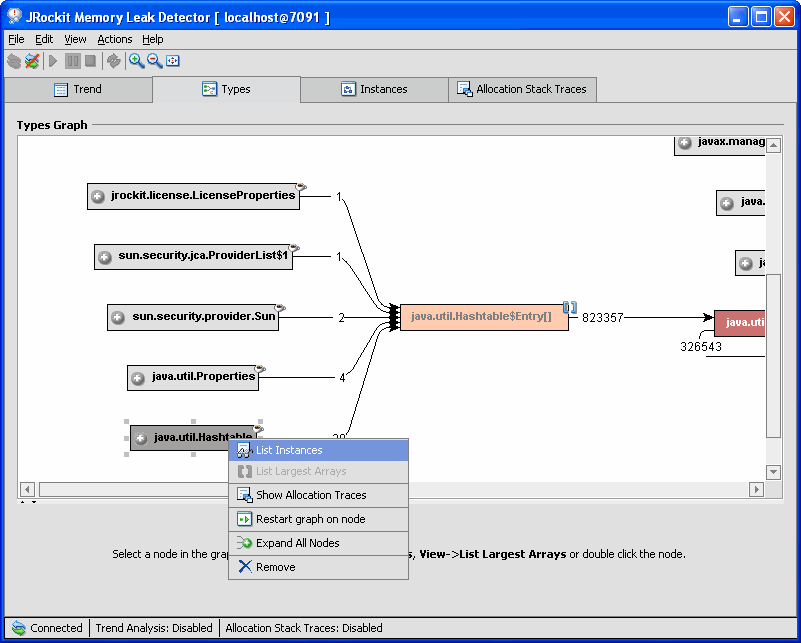
The type expands further (see Figure 3-3).
The Instances part of the Types tab opens.
List instances shows you instances of the selected type. The instances shown will only be those that have references to the type indicated by the arrow from the selected type in the above type graph.
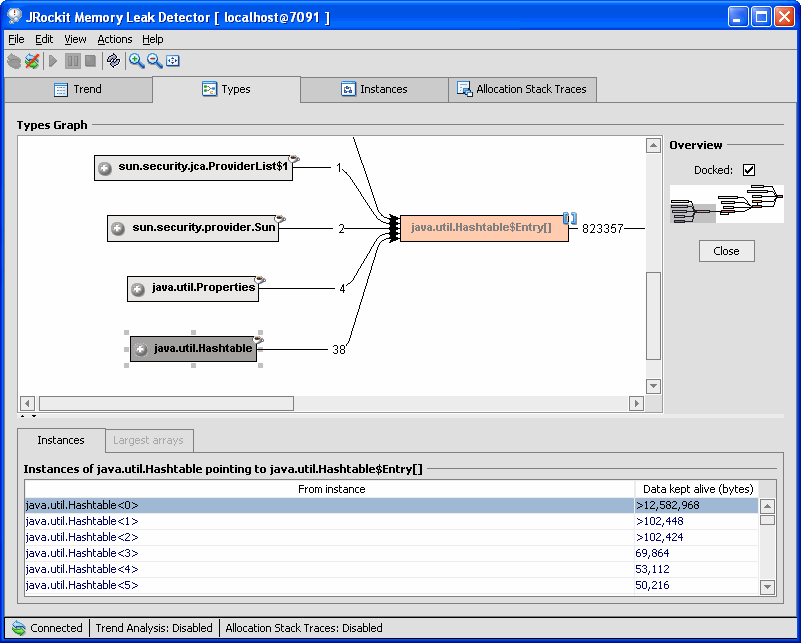
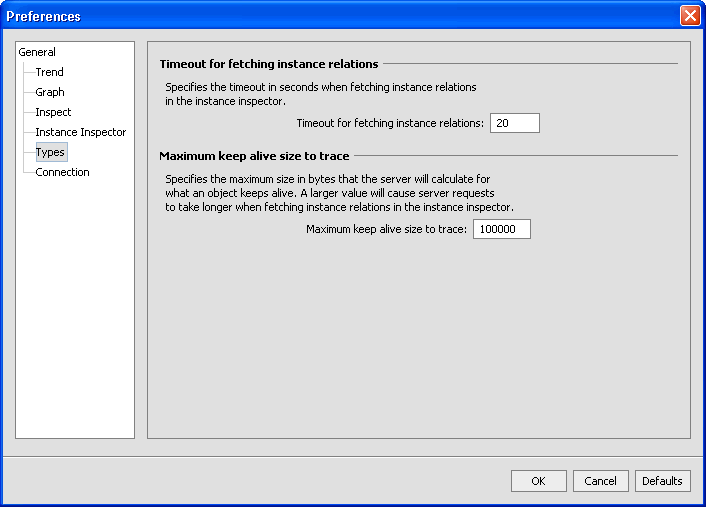
The lower half of the tab lists all instances of type A pointing to type B if the instance list is not too large (see Figure 3-5). If the list is too large, the Memory Leak Detector might time out when trying to display the list. You can change the time out setting under File > Preferences.
The column Data kept alive (bytes) shows how much data a certain instance keeps alive. This data cannot be garbage collected.
Have the Overview part of the window open to see where you are in the graph (see To Get an Overview of the Graph for how to turn on the overview). You can also zoom in/out or re-center the view (see Table 2-2 for an explanation of the zooming tools).
The Instances tab appears (see Figure 3-6).
In the Instance tab, see Figure 3-6, you view the instances of the type that you suspect is leaking memory. You can also see the name of the specific field by looking at the arrow that is referring. Right-click an instance to get a popup menu with the Inspect Instance option. When inspecting an instance you will see all instance variables that the object contains. This information will help you pinpoint where in your application the leaking object is located.
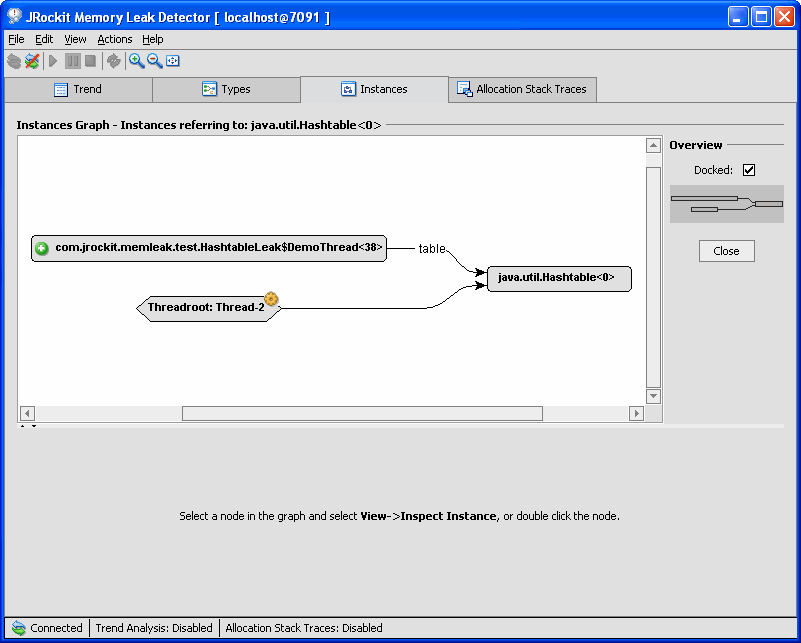
Table 3-2 explains what you will be able to view in the Instances tab.
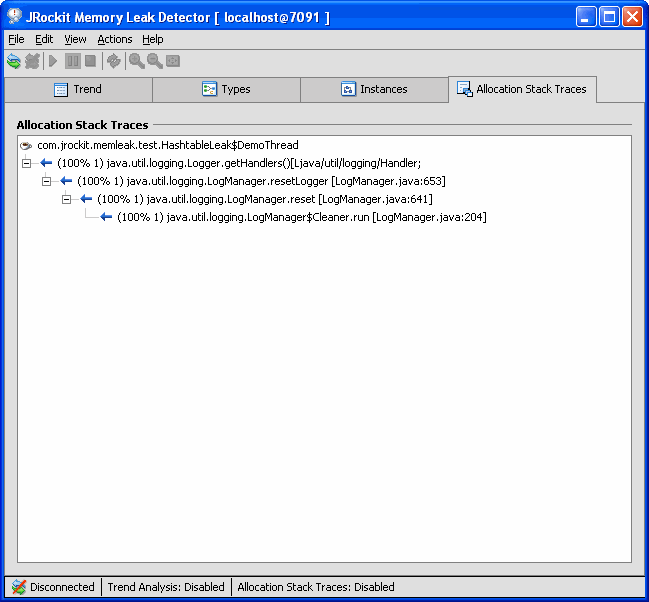
In the Allocation Stack Traces tab, see Figure 3-7, you can check for where in the code allocations of a certain type are done. Enabling allocation stack traces may deteriorate the performance of JRockit. Collecting information about all the allocation points might take a while.
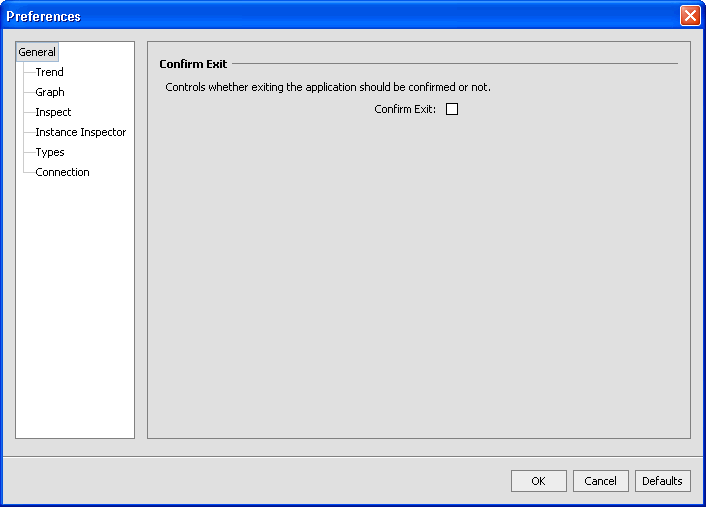
The Memory Leak Detector can be customized in many different ways. Figure 3-8 through Figure 3-13 explains the different settings you can make.
The Preferences window opens (see Figure 3-8).
When you have set your preferences, click OK for them to take effect.
Select the Confirm Exit option if you want to get a confirmation message when you are closing the Memory Leak Detector.
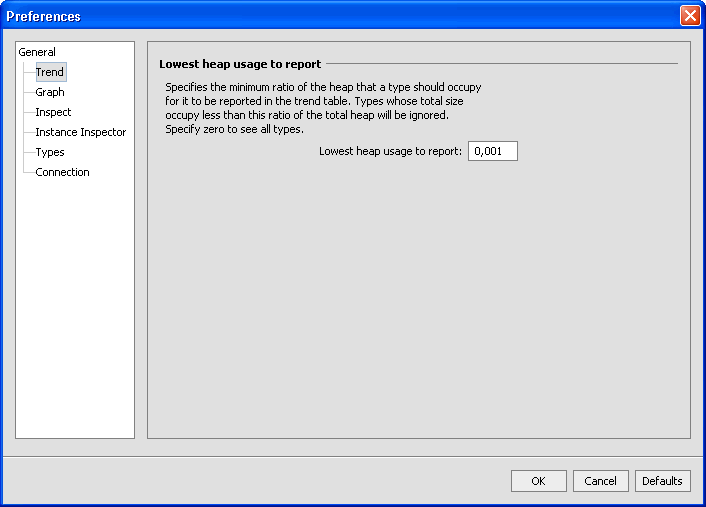
Here you set the ratio of the Java heap that you want displayed. Those types that are smaller than the set ratio are not displayed. If you want to display all types, set the ratio to 0 (zero).

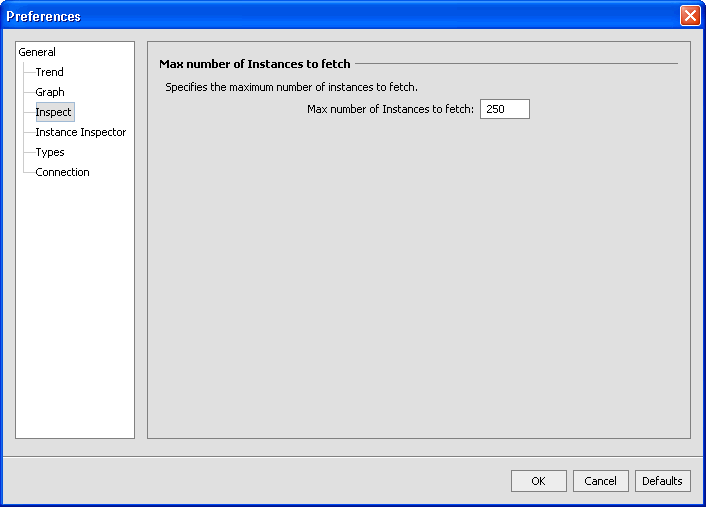
Here you set the number of instances you want to list when doing List instances of a type. The list is shown in the Types tab under Instances.
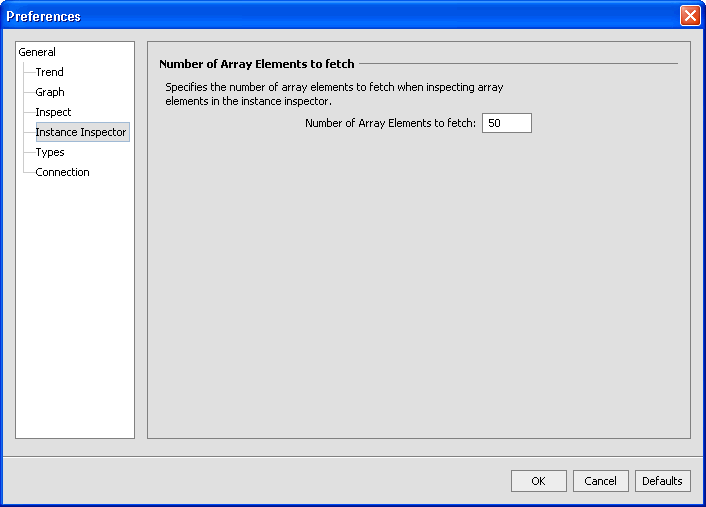
Specify the value for the Max number of Array Elements to fetch. These elements are displayed in the Types tab when you have selected List Largest Arrays.


|