


|
|
This topic contains the following sections:
Oracle Tuxedo System and Application Monitor (TSAM), is an Oracle Tuxedo add-on product. Tuxedo is widely used by enterprises that develop and use in mission-critical applications. It acts as the infrastructure layer in distributed computing environments. The complexity of Tuxedo and the applications running on top of it makes performance measurement extremely complex.
Oracle TSAM monitors the major performance sensitive areas of a Tuxedo-supported enterprise computing environment. It can be used to monitor real-time performance bottlenecks and business data fluctuations, determine service models, and provide notification when pre-defined thresholds are violated.
The following is a list of Oracle TSAM features:
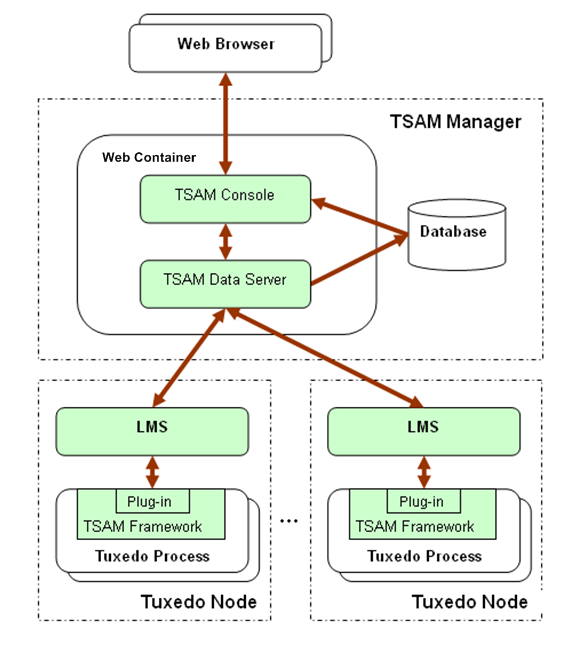
Oracle TSAM includes two components:
Performs Tuxedo-side data collection.
Performs data storage, aggregation, computing and representation.
The Oracle TSAM Agent handles all Tuxedo-side back-end logic. It works in conjunction with the Oracle TSAM Manager, and includes the following sub-components:
You can develop your own plug-ins for additional data processing. A customized plug-in can be linked to an existing plug-in chain, or replace the default plug-in.
For more information, see Oracle TSAM Agent.
The Oracle TSAM Manager is built on J2EE technology. It includes following components:
For more information, see Oracle TSAM Manager.
Figure 1-1 shows the Oracle TSAM architecture.
Tuxedo is typically used by a client program (not necessarily a Tuxedo client process) that calls a service to perform a business computing logic scenario. The service implementation is completely transparent to the caller. This type of middleware transparency provides many benefits for development, deployment, and system administration. However, from a monitoring perspective, it is difficult for the end user or administrator to figure out what happens “behind the scene”. Oracle TSAM call path monitoring helps to alleviate this problem.
A simple Tuxedo application call triggers a set of service invocations. The involved services constitute a tree (“call path tree”). A call path tree strictly defines the following factors:
A “monitoring initiator” is a process that “initiates” tracking a call path tree. The process can be a Tuxedo client, application server, or client proxy server (WSH/JSH). A typical scenario is when a tpcall/tpacall is invoked by the monitoring initiator; call path monitoring begins. All the back-end services involved in this call are displayed on the call path tree representation in the Oracle TSAM Console.
| Note: | Currently only tpcall/tpacall can trigger a call path monitoring. Other communication models are not supported. |
A Tuxedo application server performs two functions:
Service monitoring focuses on Tuxedo service execution status. It does not care about call correlation, as call path monitoring does. Service monitoring can be used with call path monitoring together or performed independently.
Tuxedo has two important system servers: BRIDGE and GWTDOMAIN. BRIDGE connects multiple Tuxedo machines within a Tuxedo domain. GWTDOMAIN connects one Tuxedo domain with another. The system server monitoring tracks message throughput, pending sent messages, and awaiting reply messages on each network link.
A critical use of Tuxedo is transaction monitoring. Tuxedo coordinates activities in a distributed transaction with an XA compliant resource manager, such as a database. Oracle TSAM transaction monitoring tracks each XA call triggered in a transaction allowing you to clearly identify where a global distributed transaction is bottle necked.
Monitoring policy controls monitoring behavior.
tpcall/tpacall calls are monitored.Oracle TSAM performance metrics are listed as follows:
| Note: | DOMAINID:MASTERHOSTNAME:IPCKEY LMID PROCESSNAME PID TID COUNTER |
Listing 1 shows an example of a Correlation ID. The monitored call is started by the program “bankclient” with process ID 8089 and thread ID 1 on machine “SITE1” on Tuxedo domain “TUXDOM1”. The master is “bjsol18” and IPCKEY in TUXCONFIG is “72854”.
TUXDOM1:bjsol18:72854 SITE1 bankclient 8089 1 99
tpreturn service return code. It is defined by Tuxedo ATMI interface.tpcall/tpacall in Tuxedo ATMI interface.tpcall, tpacall, or tpforward.
Oracle TSAM is built on top of Tuxedo and has unique service, call, and transaction tracking capabilities. Enterprise organization usually have many widely distributed services deployed and one client request that requires complex back-end service coordination to perform the processes.
It can be difficult for an administrator to figure out what exactly is happening during these interactions. Oracle TSAM call path monitoring helps to alleviate this problem.
The followings are FAQs will help you to better understand how Oracle TSAM works with your applications:
Enabling call path monitoring for a Tuxedo client or application server allows you to find out all the information behind a simple tpcall/tpacall. The tracking points span multiple machines and multiple domains. You can clearly see the following information in the call path tree:
Service monitoring enables you to measure your service response time, IPC queue length, and execution status. Service monitoring provides the following information:
Oracle TSAM tells you how many service executions succeeded or failed recently or during a period of time. Oracle TSAM also computes the average response time. These are important factors in measuring the quality of your services.
Oracle TSAM also displays your services activity trends. It tells you what the peek time is and when the services requests are low.
Oracle TSAM allows you to monitor the network connection attached to your local domain gateways. You can easily find which link is busy and its data fluctuation trend. You have more in-depth understanding of the business data flow model between departments and organizations.
Oracle TSAM monitors the transaction XA calls. Transaction participants are listed on the transaction monitoring page. For a large distributed transaction, a slow branch can result in the entire transaction being slowly completed. Oracle TSAM lets you know who the transaction participants are, and how much time is used during XA calls.
Turn on the call path monitoring for a particular call to investigate the following:
Turn on call path monitoring. You can find the service execution status for this call.
Turn on call path monitoring using an adequate sampling policy. Oracle TSAM will tell you how many call paths (a “call pattern”) exist in your application.
Turn on Oracle TSAM transaction monitoring. You can see the execution time used by the transaction participants.
Turn on Oracle TSAM transaction monitoring for all involved processes and GWTDOMAIN. The Oracle TSAM Console shows you the transaction mapping between local and remote transactions.
Use Oracle TSAM system server monitoring on the GWTDOMAIN. Oracle TSAM records the information for you, and shows you the throughput trends.
Turn on call path monitoring with the proper monitoring policy and then use “tpgetcallinfo”. The following information is provided.
The monitoring initiator process, tpgetcallinfo(), can also tell you the total time used.
In some cases, too many services supporting a request may add to performance overhead. Use call path tree to investigate. The service number and the tree depth are key analysis factors.
Some services are called more frequently than others. Use call path monitoring to gather the information, and re-consider the service deployment. It is best to have the most used services located on the local machine and LAN. Services across domain services should be used carefully.
Oracle TSAM provides a central view of your Tuxedo applications with multiple domain support. Using Oracle TSAM Console allows you to easily see how many domains, machines, servers and services are configured.
You have two ways to do this. One is using Oracle TSAM plug-in level event trigger; the other is to define alerts using the Oracle TSAM Manager console.
It supports the FML boolean expression for what Tuxedo components you want to check and what metric conditions you want to trigger an event. It does not require performance metrics to be sent to the Oracle TSAM Manager because the evaluation is done by the Oracle TSAM default plug-in.
The Oracle TSAM Manger Console allows you to define an alert with required conditions. When the threshold is reached, Oracle TSAM generates the events. The events can also be posted to Tuxedo Event Brokers.
To add Oracle TSAM functionality to an existing Tuxedo application, do the following steps:
Install the Oracle TSAM Agent and the Oracle TSAM Manager. For more information, see the Oracle TSAM Installation Guide.
For more information, see the Oracle TSAM Deployment Guide.
Login to the Oracle TSAM Manager Console (for example: http://localhost:8080/tsam).
| Note: | The first time you login to the TSAM console you must set the admin password. |
Go to TSAM > Administration > Tuxedo Configuration to find your Tuxedo configuration. For more information, see the Oracle TSAM Console User Guide.
Monitoring policy defines what and how you want to monitor. The monitoring policy can be configured at either TSAM Manager side or TSAM Agent side.
For more information, see Monitoring Policy Management and Configuring Monitoring Policies in the “Oracle TSAM Agent User Guide.”
For more information, see Policy Management in “Oracle TSAM Console User Guide.”
Go to TSAM > Administration > Policy Management, click “Create” to enter the “Policy Specification” page. Input “tsampolicy” in the “Name:” input field.
• Check Oracle TSAM Agent results from Tuxedo
• Monitor services of a particular server
• Monitor XA calls in transaction for a particular group
Login to TSAM Console, and start to monitor Tuxedo system and application.
Go to TSAM > Call Path to monitor call path.
Go to TSAM > Service to monitor service.
Go to TSAM > System Server to monitor system server.
Go to TSAM > Transaction to monitor transaction.
For more information, see the Oracle TSAM Console User Guide.


|