Oracle Tuxedo is widely used by enterprises that develop and use in mission-critical applications. It acts as the infrastructure layer in distributed computing environments. The complexity of Tuxedo and the applications running on top of it makes performance measurement extremely complex.
Oracle TSAM provides comprehensive monitoring and reporting for Oracle Tuxedo system and applications. It includes two components: Oracle TSAM Agent and Oracle TSAM Manager.
The Oracle TSAM agent enables collection of various applications performance metrics (including call path, transactions, services, system servers). The Oracle TSAM Manager provides graphical user interface that correlates and aggregates performance metrics collected from one or more Tuxedo domains. It displays this information in interactive real time.
Why Use Oracle TSAM?
Because the Oracle Tuxedo framework and applications are widely deployed, comprehensive monitoring and reporting capability becomes increasingly critical. For example, you may want to know:
the end-to-end execution time of an ATMI request
where a call hangs
how many requests to a service failed during a certain time period
how many requests went through a domain gateway during a certain time period
the current status of all participants in an XA transaction
Oracle TSAM can provide this information and allows you to easily identify bottlenecks and expedite problem resolution. Oracle TSAM can also help with performance tuning and capacity planning.
Oracle TSAM also allows you to define event alerts. The Oracle TSAM Console reports an event when an alert is triggered notifying you to take proper action.
Oracle TSAM Features
The following is a list of Oracle TSAM features:
Tracking a Tuxedo system call transmissions. Each monitored call is assigned a unique ID and is propagated along a call path tree. TSAM is able to track calls across multiple machines and domains.
Real-time call path tree tracking of a monitored request is displayed and the performance metrics for each step are available.
Call pattern summarization based on historical call tracking data.
Monitoring a particular Tuxedo service, checking its response time, IPC queue length and execution status. The data can be queried using recent or historical data.
Gathers Tuxedo GWTDOMAIN and BRIDGE overall throughput, graphically displaying the business data flow curve.
Tracking transactions with XA API specifications. Displays execution status and time used on each XA call. TSAM helps diagnose global distributed transactions.
The Oracle TSAM Manager console provides the capability to create “Alert” definitions that generate events when predefined thresholds are reached. The events can be posted to Tuxedo and received by Tuxedo Event Broker subscribers.
Programming APIs that retrieve meta data packaged in a monitored call. Helps developers make application decisions dynamically.
Flexible monitoring controls. The sampling can be based on interval or ratio and the monitoring can be turned on or off dynamically without restarting application.
Plug-in mechanism for performance metrics collection at the Tuxedo infrastructure level. It provides great integration capability between TSAM and other third-party products.
Powerful plug-in-level event triggers without sending raw metrics data to the Oracle TSAM Manager. It supports flexible FML boolean expression to achieve advanced event trigger conditions. Events can be posted to the Tuxedo Event Broker and/or the Oracle TSAM Manager.
Scalable Tuxedo-side server monitoring design to meet small, middle and large Tuxedo runtime environments.
J2EE based solution. Easy to deploy, configure and use. It is a pure Web-based solution. The TSAM Console can be accessed anywhere using a compatible Web browser.
A Brief History of Oracle TSAM
Release 1.1
Release 1.1 is the initial TSAM release. TSAM 1.1 introduced the following features:
Call Path Monitoring and Analysis
Service Monitoring and Statistics
System Server Monitoring and Statistics
Transaction Monitoring
Event Alerts
Open Plug-in Framework
Dynamic Monitoring Policy Management
Web-based Reporting and Management
Release 10g Release 3 (10.3)
TSAM 10g Release 3 (10.3) incorporates the following enhancements based on the 1.1 release:
TSAM Manager supports Oracle WebLogic Server and Oracle OC4J
Oracle TSAM Agent: Performs Tuxedo-side data collection.
Oracle TSAM Manager: Performs data storage, aggregation, computing and representation.
Oracle TSAM Agent
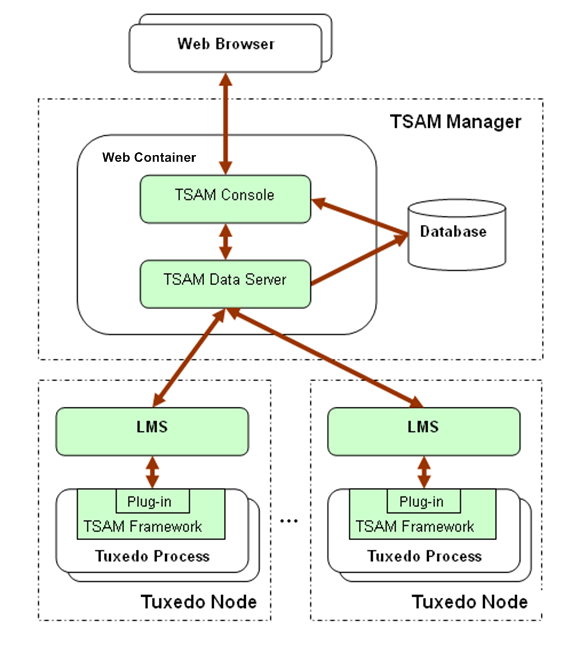
The Oracle TSAM Agent handles all Tuxedo-side back-end logic. It works in conjunction with the Oracle TSAM Manager, and includes the following sub-components:
TSAM Framework: A Tuxedo-side facility that defines and controls performance metrics collection behavior. It uses the Tuxedo traditional interface and can be easily integrated into an existing Tuxedo management suite.
TSAM Plug-in: An extensible mechanism invoked by the TSAM Framework. The Oracle TSAM Agent provides default plug-ins to send data to the Local Monitor Server (LMS), and then to the Oracle TSAM Manager. The default plug-in also checks event triggers, and generates events if needed.
You can develop your own plug-ins for additional data processing. A customized plug-in can be linked to an existing plug-in chain, or replace the default plug-in.
Local Monitor Server (LMS): The LMS is a Tuxedo system server. The TSAM default plug-in sends data to the LMS. The LMS then passes the data to the Oracle TSAM Manager in HTTP/XML message format.
The Oracle TSAM Manager is built on standard J2EE technology. It includes following components:
TSAM Data Server: Data server that accepts data from the LMS and stores the data in the database. It is a J2EE application.
TSAM Console: The TSAM presentation layer. It is a J2EE Web application and can be accessed via a compatible Web browser. After logging on to the TSAM Console, you have access to full Oracle TSAM functionality.