How to Debug Locate
SOAPSpy Tool Locate
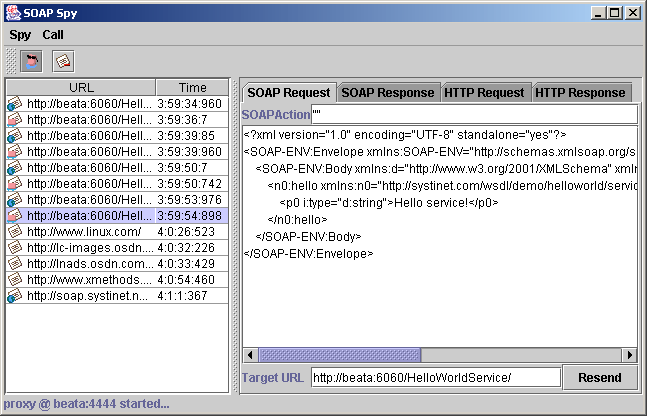
When debugging, it can be useful to track communication between the client and server. SOAPSpy allows the inspection of messages that the client and server exchange. Messages, or more precisely, requests and responses, are coupled to calls. Figure 25 shows the SOAPSpy dialog box.
SOAPSpy works as an HTTP proxy server. It accepts HTTP requests from clients and resends them to their final destinations, or to another HTTP proxy server. SOAPSpy can track not only SOAP and WSDL messages, but also any other documents (HTML pages, binary data, etc.). However, the binary data is shown only schematically; all invalid text characters are translated into question mark (?) characters. SOAPSpy can also work as an HTTP server client: you can make it contact another proxy server instead of connecting to the final destination.
Running SOAPSpy Locate
This tool is placed in the bin subdirectory of your BEA AquaLogic Service Registry server distribution. To start SOAPSpy, enter the command SoapSpy.bat on Windows platforms, or ./SoapSpy.sh on UNIX machines.
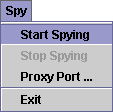
Spying must be started first by selecting Start Spying from the Spy menu or by clicking the spy icon in the main panel, shown in Figure 26.

The lower part of the window contains a status bar, shown in Figure 27, with information about the state of the tool. Once started, the status line displays the proxy host and port number.
The following options can be used on the command line when activating SOAPSpy:
--port [PORT]
Starts SOAPSpy at the given port
--help
Shows the help screen on the console
--version
shows the version of SOAPSpy on the console
To make SOAPSpy contact another proxy server instead of making a direct connection to the destination, use the standard Java system properties for HTTP proxies:
-Dhttp.proxyHost=PROXY_HOST - The host name of the proxy server
-Dhttp.proxyPort=PROXY_PORT - The port of the proxy server
There are two possible ways to load the tool:
./SoapSpy
./SoapSpy --port PROXY_PORT
Using SOAPSpy Locate
The program consists of a call list and a message viewer.
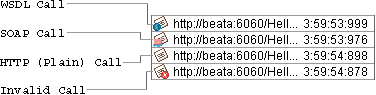
Received calls are stored in a list on the left side of the window. Calls can be selected and examined. Unwanted calls can by removed from the list using the Call menu or context pop-up.
The message viewer displays the selected call, as shown in Figure 28. Every call contains HTTP Request and HTTP Response tabs, which contain raw data caught by SOAPSpy. SOAP calls contain two specific panels, SOAP Request and SOAP Response, for advanced manipulation of SOAP messages. The same applies for WSDL calls.
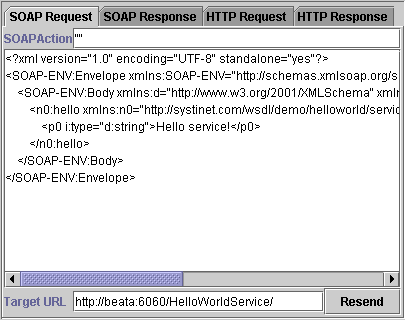
SOAP Request Tab Locate
The SOAP Request tab, shown in Figure 29, consists of the SOAP Action, SOAP message and Target URL where the original request was sent. Every file can be edited. Click the Resend to produce a new HTTP request. The resent request appears in the call list.
How to Run Clients Using SOAPSpy Locate
Java system properties http.proxyHost and http.proxyPort need to be set. Use the command java -Dhttp.proxyHost=CLIENT_COMPUTER_NAME -Dhttp.proxyPort=4444... before running SoapSpy. E.g.:
java -Dhttp.proxyHost=%CLIENT_COMPUTER_NAME% -Dhttp.proxyPort=4444 org.my.FooClient
![[Important]](../images/important.gif) | Important |
|---|---|
Because SoapSpy works with the java.net proxy classes, it will not work with a localhost address. This applies to the endpoint URL that your client calls. If you do not see any activity when using SoapSpy, this is a likely cause. If you want to try running a service locally, simply obtain the machine's hostname via the java.net.InetAddress class. | |
Logging Locate
BEA AquaLogic Service Registry wraps the Log4j logging service to log errors, warnings, and other information. By default:
All such events are logged to REGISTRY_HOME\log\logEvents.log.
All errors including stack traces are logged to REGISTRY_HOME\log\errorEvents.log.
Behavior descriptions are configured in REGISTRY_HOME\conf\log4j.config.
To use the same logging mechanism in custom server code (such as the Custom Validation Service):
Import com.idoox.debug.Category to your java class:
import com.idoox.debug.Category;Create static instance with name of the category:
private static Category log = Category.getCategory("com.company.MyValidationService");It is a good habit to name the category according to its class name. You can use the category
...
try{
      ...
} catch(Exception e){
   log.error("Fatal error", e);
    }
...