

|
An Evaluation Summary is created each time you evaluate a domain, and is persisted in the Guardian Workspace. The Evaluation Summary editor in the Document Pane allows you to interact with the Evaluation Summary and determine if you need to take any corrective action.
These are the different ways to open an Evaluation Summary:
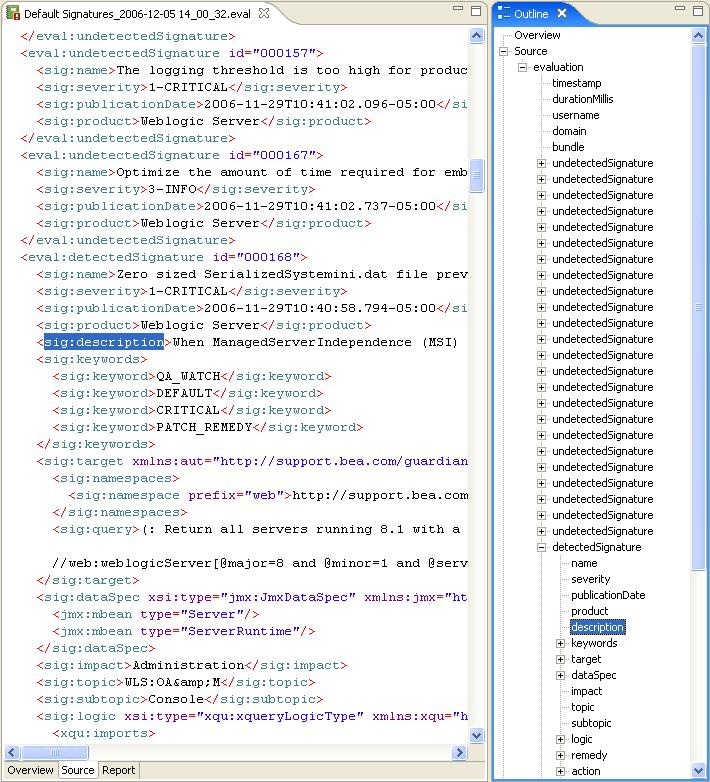
On the bottom of the Evaluation Summary editor are the following tabs for the different Evaluation Summary representations. Please note that these representations are read only:
For a given bundle of signatures, some signatures may not be used in the evaluation because they target different products than the domain has. The ones that do target what the domain has are counted as Targeted Signatures. The Targeted Signatures are divided into Detected Signatures, which are actually found on the domain; and Undetected Signatures, which are not found on the domain. If a signature fails to evaluate, it is counted as an Undetectable Signature, and is considered flawed.
Clicking a detected signature displays information about it in the Description and Remedy sections. Information about the first detected signature is displayed by default. You can sort the detected signature table by clicking any of the column headings. The detected signatures are sorted by severity and name by default.
The Severity column of the detected signature table includes an icon that approximates the amount of attention you should give each signature that has been detected.
Remedy also includes a link, Get more help from BEA Support, which opens the Support Case Wizard. Opening a support case allows you to get more help from BEA to analyze and repair the potential problem that the signature detected.
When the Outline View is open and the Evaluation Summary editor is active, you can use the Outline View to control what the Evaluation Summary editor displays. Clicking the Overview, Source, and Report nodes in the Outline View brings the corresponding tab of the Evaluation Summary editor to the forefront. Expanding the Outline View's Source node allows you to select specific XML tag names, causing the Evaluation Summary editor to jump to those tags and highlight them.


|