Using the JRockit Runtime Analyzer
|
|
Looking at a Recording
This section describes the information displayed on the different tabs on the JRA tool. A lot of the information requires a very deep understanding of the inner workings of the BEA JRockit virtual machine to be useful. It is out of the scope of this document to explain the meaning of all that data in detail. The following topics are covered in this section:
- Viewing General Data about the Application
- Viewing Hot Methods
- Viewing Garbage Collection Data
- Viewing Java Heap Content
- Viewing Object Statistics
- Viewing Method Optimizations
- Viewing Lock Activities in Your Application and JRockit
- Adding Comments to the Recording
Viewing General Data about the Application
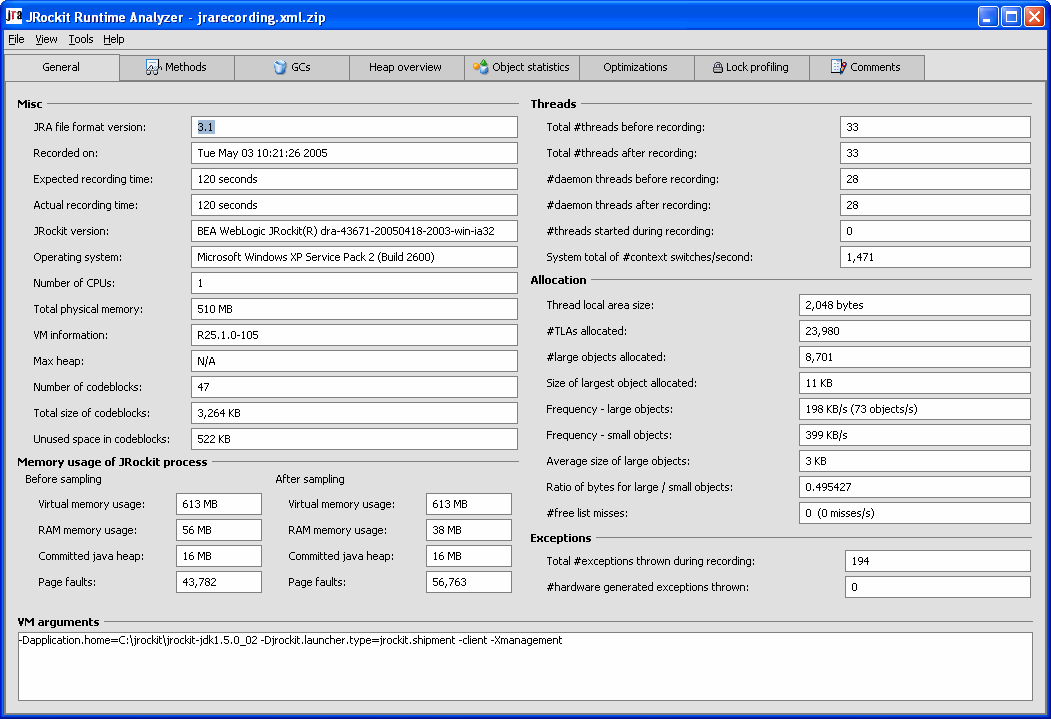
The General tab (see Figure 2-1) displays data about the recorded application behavior, such as thread, allocation, exception and memory usage statistics. It also displays the command line options that were used to start BEA JRockit (VM arguments section).
Note: If you are running an older version of JRockit (older than 5.0), data will not be collected for all fields, i.e. the field is left blank or marked as "unknown."
Most of the information that is displayed in the General tab is pretty straight forward and self-explanatory; however, some labels require further explanation. Below follows explanations on selected label of the General tab.
Miscellaneous Information
- The value Actual recording time can differ from expected recording time, e.g. if the application that runs on BEA JRockit finished while a recording was still in progress.
- The Max heap, maximum heap size, that is set with a BEA JRockit startup option.
- The value Number of codeblocks is a JVM internal value. All generated code is divided into (non-heap) memory blocks called codeblocks.
Memory Usage of JRockit Process Information
This section shows a snapshot of the memory usage before and after the recording of JRockit's memory usage.
- The value Committed java heap is the current total heap size. It is less than or equal to the maximum heap size.
Threads Information
This section shows information on the number of Java threads that existed before and after the recording.
- The value System total of # (number) context switches per second is fetched from the operating system. An unusually high context switch value compared to other applications may indicate contention in your application.
Allocation Values Information
- The Thread local area (TLA) size is a JRockit internal value. It is a small memory area, local to a thread, where the JVM can allocate small objects without having to take the heap lock.
- Ratio of bytes for large/small objects. Per default, JRockit considers an object to be large if it is larger than the thread local area size; it is small if it would normally fit in a thread local area. Large objects are always allocated in the old space (second generation) of the heap, never in the nursery.
- The Number (#) free list misses is a JRockit internal value. JRockit has a list of free memory blocks on the Java heap. During allocation, an object is normally put in the first free block on the "free list." If it does not fit there, JRockit will try the next block, and the next, etc. Each block where the code block did not fit is considered a "free list miss."
Exceptions Information
This section displays information on the total number of Java exceptions that are thrown during a recording. This includes both caught and uncaught exceptions. Excessive exception throwing can be a performance problem. Hardware generated exceptions are originating from a "trap" in the hardware and are usually the most expensive kind of exception.
Viewing Hot Methods
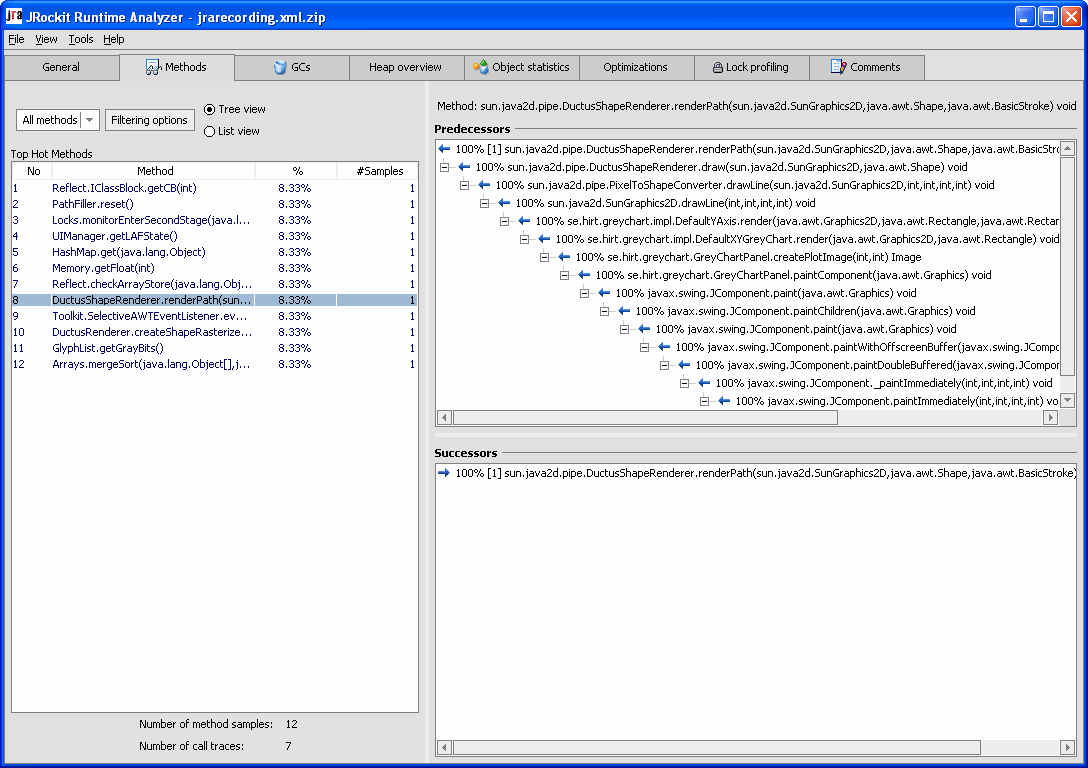
The Methods tab (see Figure 2-2) lists the top hot methods during the recording. The method sampling in JRockit is based on CPU sampling. This requires that you put load on the system to get any samples.
The Top Hot Methods lists all methods sampled during the recording and sorts them with the most sampled method s first. These are the methods where most of JRockit's time is spent.
The hot methods data is collected periodically by JRockit sampling the running threads and looking at which method the threads are executing. If your recording has native sampling enabled, you can also see methods prefixed by jvm#, which are native methods in the JVM. You can limit the methods shown in the top list by clicking Filtering options and select the least number of samples that you want displayed.
By selecting a method in the list, you can see its sampled Predecessors and Successors in the tree view to the right. These are the methods that call the method and the methods that the selected method calls. The number in brackets is the number of sampled call traces of which the method is part. The percentages show how common a particular path is in the method tree.
If you prefer to see the successors and predecessors in a list view, you can change the view by selecting List view instead of Tree view.
Viewing Garbage Collection Data
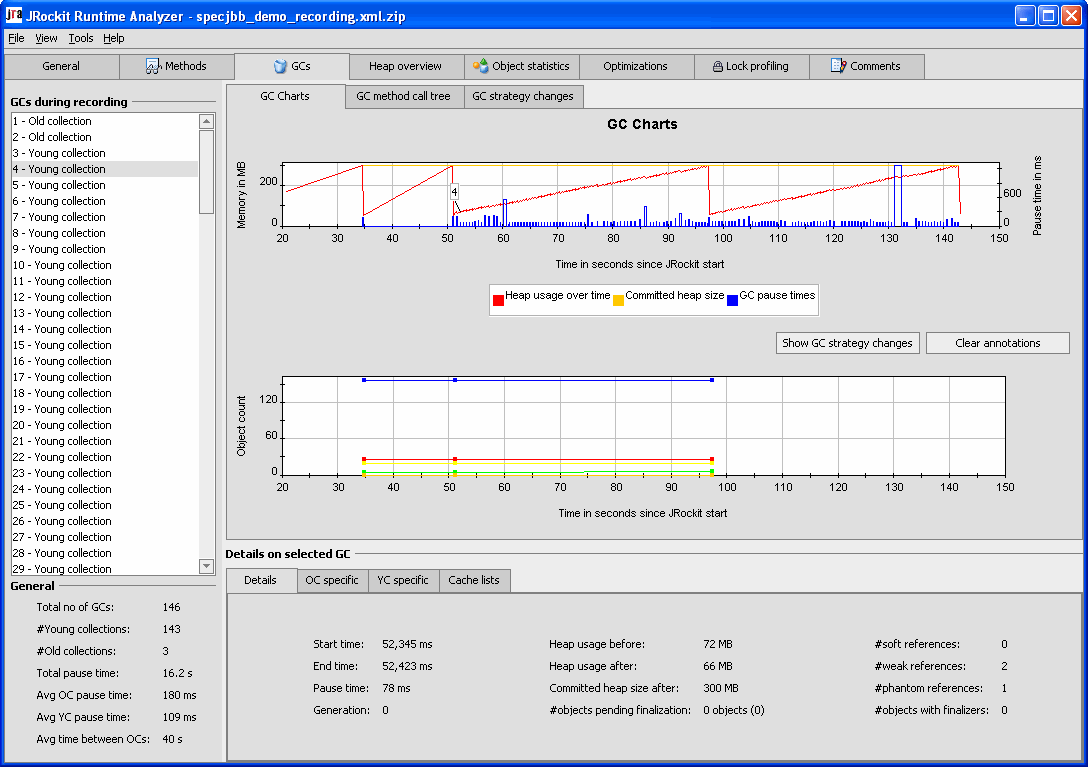
The GCs tab (see Figure 2-3) shows detailed information about each garbage collection (GC) event that has occurred. Graphs show the heap usage before and after each garbage collection as well as pause times and number of java.lang.ref.* objects discovered. You select a specific garbage collection event in the list, GCs during recording, to view details about it in the lower right pane.
GCs During Recording Information
This section lists all garbage collection (GC) events during the recording, provided that the garbage collection sampling was enabled. A garbage collection can be an old collection, which is a garbage collection in the old space of the Java heap or a young collection, which is a garbage collection in the young space (nursery). Click on a garbage collection in the list to see it in the GC Charts tab and the Details on selected GC part.
GC Charts Tab Information
The information that is displayed on the GC Charts tab contains two different charts and two buttons:
- The upper chart, Heap usage chart, shows how the heap usage varies with the garbage collections (in red) and how long the garbage collection pause times are (in blue).
- The lower chart, References chart, shows different types of reference counts after each old collection. For more information, see the javadocs for
java.lang.refpackage.
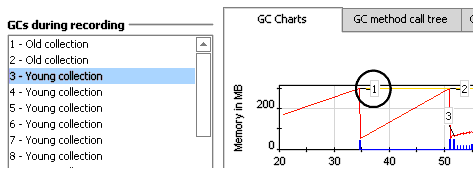
By clicking a garbage collection sample in the left-hand list of GCs, a small flag, annotation, is lit to indicate that specific garbage collection on the chart. See Figure 2-4.
Figure 2-4 The Annotation that Indicates Statistics for the Selected Garbage Collection
- Click the Show GC strategy changes button to view garbage collection strategy changes in the heap usage chart (if any).
- Click the Clear annotations button to remove all annotations from the charts.
- The GC method call tree tab shows an aggregation of the call traces of the threads triggering a garbage collection.
- The GC strategy changes tab shows the list of garbage collection strategy changes that occurred during the recording. These changes can only happen if you are running BEA JRockit with the default
-Xgcprio:throughputoption (-Xgcpriofor versions earlier than JRockit 5.0).
General Information
This section displays general garbage collection statistics for the duration of the recording, for example, the average old collection pause time (Avg OC pause time) or the average young collection pause time (Avg YC pause time).
Selected GC Infomation
The Details on selected GC section contains four tabs with in-depth information relevant to the garbage collection round you have selected.
Details Tab
The following information is displayed in the Details tab (see Figure 2-5).
- Start and End time(s)—the time(s) when the garbage collection started/ended, counted in milliseconds from when JRockit started.
- Pause time—the time in milliseconds that the garbage collector stops all threads in JRockit. This is not the same as end time-start time in the case of a concurrent garbage collector.
- Generation—1 indicates a garbage collection in old space, 0 a garbage collection in young space. In the case of a parallel garbage collector, only generation 1 exists.
- Heap usage before/after—the used heap size before/after the garbage collection.
- Committed heap size after—the total size of the heap (used + unused memory) after the garbage collection.
- # objects pending finalization—if a number in parentheses is shown, this is the value before the recording.
OC Specific Tab
The following information is displayed in the Old Collection (OC) specific tab (see Figure 2-6).
Figure 2-6 Old Collection (OC) Specific Tab
- Mark/Sweep phase—indicates if the phase is concurrent or parallel.
- Mark/Sweep phase time—indicates the time spent in this phase measured in milliseconds.
- Compaction—ratio and size of the heap that was compacted in this old space garbage collection.
- Desired/Actual evacuation—the desired evacuation is the size of the area on the Java heap that you want to evacuate and the actual evacuation is the size of the area that JRockit managed to evacuate. The value for actual evacuation can be smaller than the desired due to temporarily pinned objects (objects that are not allowed to be moved during garbage collection). The evacuation takes place during compaction or shrinking of the Java heap.
- GC reason—indicates the reason for doing this garbage collection.
- Nursery size—indicates the size of the young space of the heap before and after garbage collection (in some cases the nursery size can increase).
- Nursery position—memory address of nursery (sum internal).
YC Specific Tab
The following information is displayed in the Young Collection (YC) specific tab (see Figure 2-7).
Figure 2-7 Young Collection (YC) Specifics Tab
- Nursery usage before/after—the amount of used memory in the nursery before and after the garbage collection.
Cache Lists Tab
Here you can view the specification for the different cache lists (see Figure 2-8). Each cache list contains settings for upper and lower cache size.
- Index—this is the identification number for the cache list.
- #free blocks—the number of free blocks in the cache list.
- Cache size—the total size of this cache list.
- Avg free block size—the average size of each free memory block in the cache list.
- Low limit—the lower limit of a free memory block. There will be no smaller memory block than this in the selected cache list.
- High limit—the upper limit of a free memory block. There will be no larger memory blocks than this in the selected cache list.
Viewing Java Heap Content
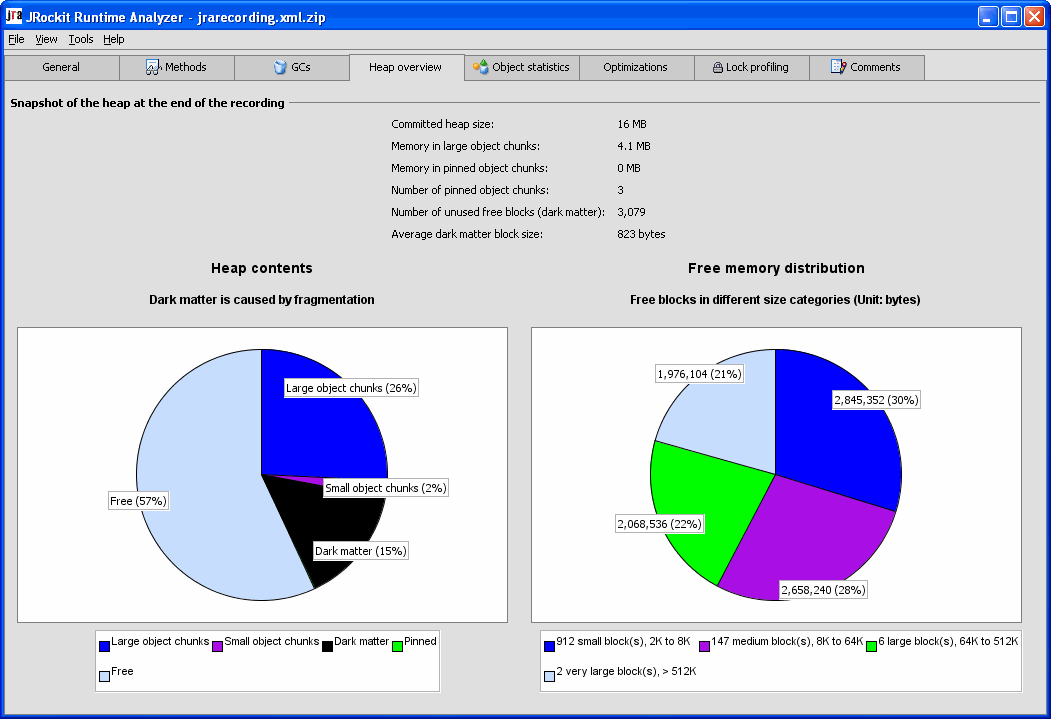
The Heap overview tab (see Figure 2-9) gives a quick overview of what the memory in the Java heap consists of at the time of the recording. The tab consists of two pie charts that display the proportions of the: Heap contents (to the right) and Free memory distribution (to the left).
The information that is listed at the top of the Heap overview tab shows various statistics about the memory use on the Java heap.
Figure 2-9 The Heap Overview Tab
Heap Contents Pie Chart
The Heap contents pie chart shows how much of the heap that consists of large and small object chunks, dark matter, and free space. The amount of dark matter indicates how much space in the Java heap that is wasted due to fragmentation of the Java heap. It is normal to have a certain amount of dark matter in the heap.
Free Memory Distribution Pie Chart
The Free memory distribution pie chart shows how the free memory is distributed in free blocks of different sizes on the Java heap.
Viewing Object Statistics
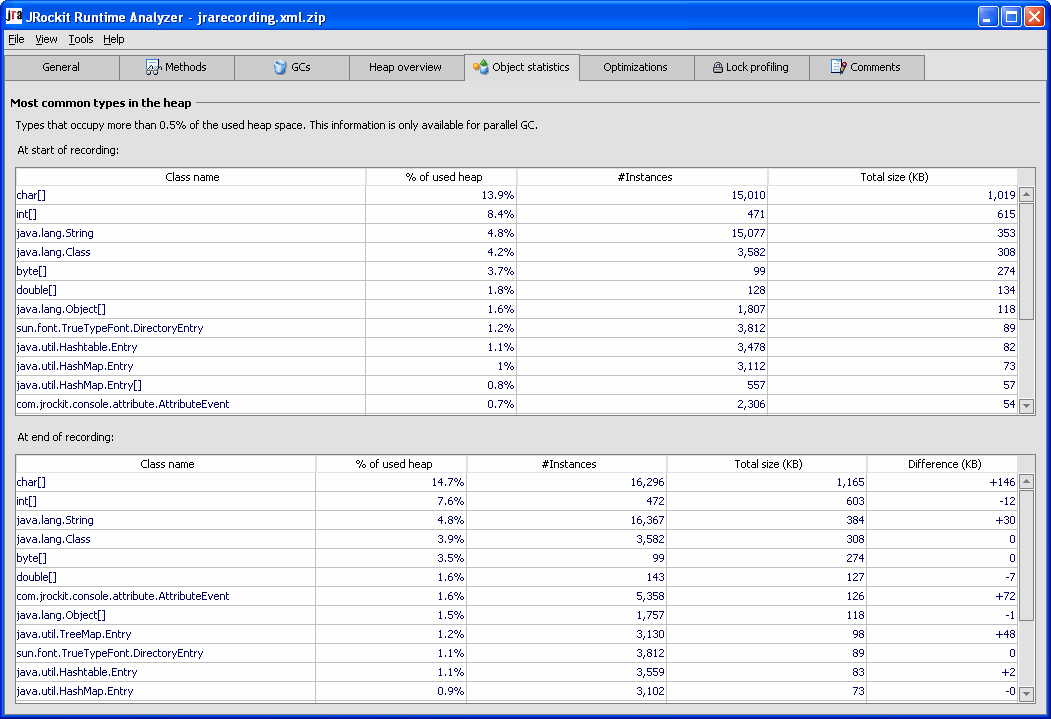
At the beginning and end of a recording session, snapshots are taken of the most common types/classes of objects that occupy the Java heap, that is, the types which instances in total occupy most memory. The results are shown on the Object statistics tab (see Figure 2-10). Abnormal results in the object statistics might help you detect the existence of a memory leak in your application.
Figure 2-10 The Object Statistics Tab
Viewing Method Optimizations
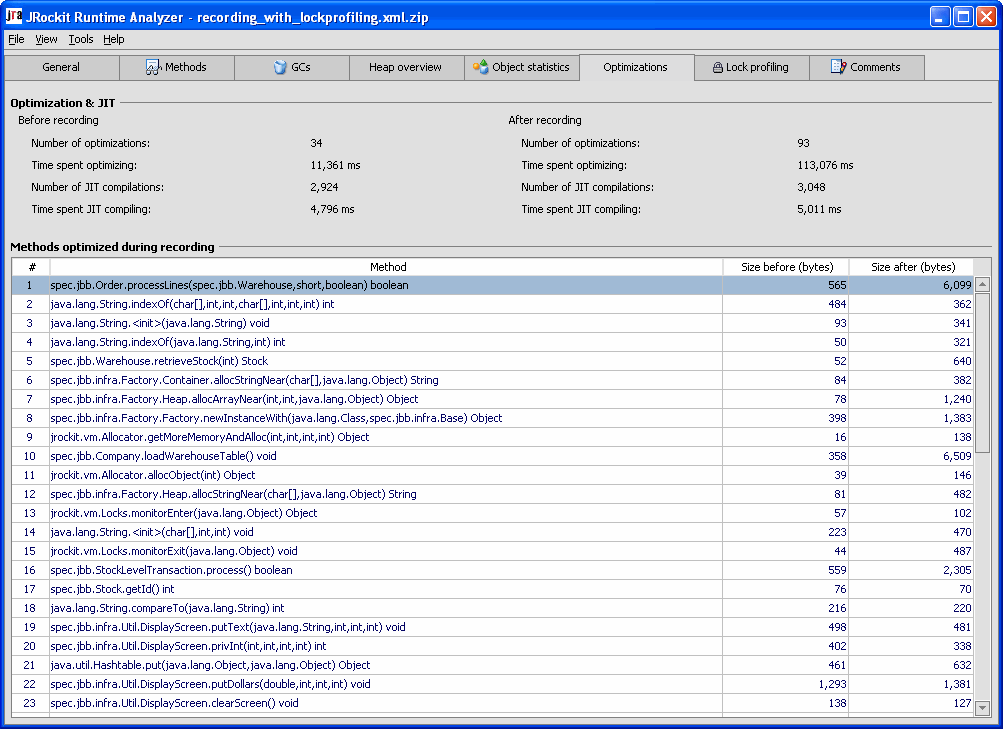
The Optimizations tab (see Figure 2-11) displays the methods that were optimized by the adaptive optimization system in BEA JRockit during the recording.
The optimized methods are displayed in chronological order. The sizes in the Methods optimized during recording table are the method size in bytes before and after optimization. Some optimizations, like inlining, causes the method size to increase. The information that is available under Optimization & JIT displays how JRockit has performed in optimizing the code of your application.
Figure 2-11 The Optimizations Tab
Viewing Lock Activities in Your Application and JRockit
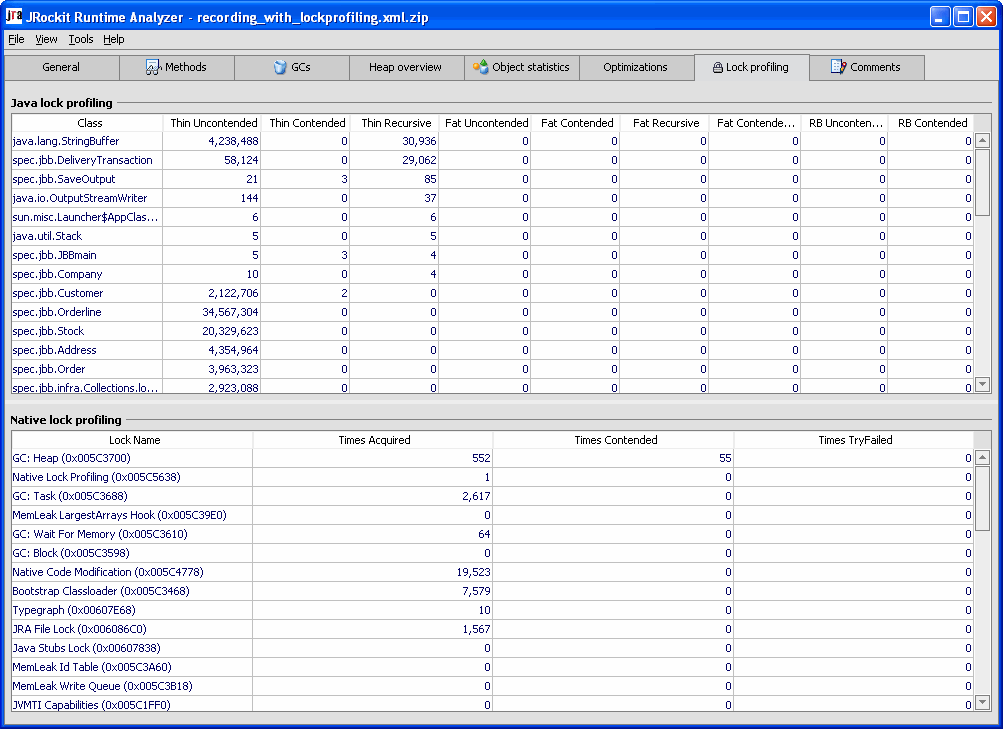
The Lock Profiling tab (see Figure 2-12) shows comprehensive information about lock activity for the application JRA is monitoring. A lock profile can only be generated when the -Djrockit.lockprofiling command is issued at the JRockit command line.
java -Djrockit.lockprofiling -XXjra:<AnyJRAParam> -jar MyApplication.jar
For more information on locks, please refer to the appendix About Thin, Fat, Recursive, and Contended Locks in BEA JRockit.
Figure 2-12 Lock Profiling Tab
Java Lock Profiling
The information that is displayed under the Java lock profiling chart shows the number of locks of the threads in your application. You see information on the number of thin uncontended, thin contended, and thin recursive locks; the number of fat uncontended, fat contended, and fat recursive locks; and the number of reservation bit (RB) uncontended and contended.
Click on the column header to sort the information for that column content.
Native Lock Profiling
If you are looking at a recording of JRockit J2SE 5.0 or later, the recording includes information about native locks. Native locks are locks in the JRockit internal code and is nothing your application can control. If you find high contention on a JRockit internal lock that might be causing issues for your application, either contact BEA support or contact JRockit through the BEA JRockit newsgroup at the dev2dev web site.
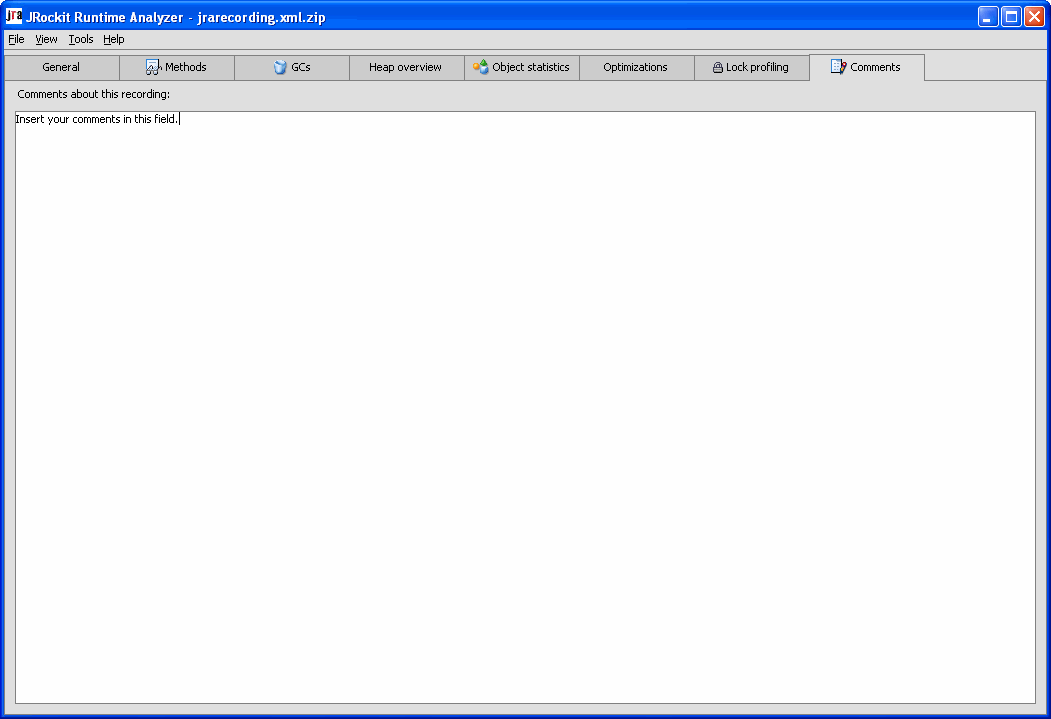
Adding Comments to the Recording
On the Comments tab (see Figure 2-13), you have a simple text editor where you can add comments about the recording. This can be a useful place to add comments when sending the JRA recording to BEA. To save you comments, click File > Save comments.
