The Log MBean allows for remote monitoring of log messages
(see Chapter 3, Logging).
The MBean has a single notification that, if listened to, will
add an appender to the root logger that will send log messages
as notifications. This MBean currently only provides log messages
when using the Log4J logging service. The name of the Log MBean
is kodo:type=log,name=LogMBean.
The Kodo DataSource (see
Section 4.1, “Using the Kodo DataSource”)
is managed by an MBean. The name of the MBean
is kodo:type=PoolingDataSource.
The Kodo DataSource has a number of
attributes which allow for
viewing / editing of pool settings, and viewing of pool
statistics. The Kodo DataSource
also has a number of statistic notifications.
The prepared statement cache (see
MaxCachedStatements
under Section 4.1, “Using the Kodo DataSource”)
is managed by an MBean. The name of the MBean
is kodo:type=PreparedStatementCache.
The cache has a single MaxCachedStatements
Attribute for viewing / editing
the number of statements to cache, and a number of attributes
for viewing cache statistics.
The cache also has a number of statistic notifications.
The query cache (see Section 10.1.3, “Query Cache”)
is managed by an MBean. The name of the MBean
is kodo:type=QueryCacheImpl.
The cache has a CacheSize
attribute for viewing / editing the size of the LRU cache, and
a SoftReferenceSize attribute for editing the
size of the soft cache. It also has a number of attributes
for viewing cache statistics. The cache also has a
clear
operation and a number of statistic notifications.
Each data cache (see Section 10.1, “Data Cache”)
is managed by an MBean. The name of the MBean is
kodo:type=DataCacheImpl,name=<cache name>
where <cache name> is the name of the
cache.
Each cache has a number of attributes which allow for viewing / editing of cache settings, and viewing of cache statistics. Each cache also has a number of statistic notifications.
Each TimeWatch statistic is managed by an
MBean. For information on creating TimeWatch
statistics, see
TimeWatch and
KodoTimeWatchManager in the Kodo Javadoc.
The name of the MBean is
kodo.TimeWatch:type=stat,name=<watchable name>,
			stat=<block name>
where <watchable
name> is the name of the
TimeWatch and where
<block name> is the name of the named
code block.
The runtime MBean allows for remote monitoring of the JVM
in which Kodo is running. The MBean provides attributes for viewing
the amount free memory available, and the total memory allocated to
the JVM. It also has statistic notifications for free and total
memory. The name of the runtime MBean is
kodo:type=runtime.

The Kodo profiling MBean allows for profiling of application
code. It is designed to help optimize the use of Kodo, and
is not intended to be a generic profiling tool. Only Kodo-specific
APIs are instrumented. This section describes how to
setup the profiling capability within the Kodo Management
Console. For more information about the profiling
capability, see Chapter 13, Profiling.
To use the profiling MBean, perform the following steps:
Enable the MBean: Set the
kodo.ManagementConfigurationproperty toremote-mgmt-proforlocal-mgmt-prof.Start the
Kodo Management Consoleeither locally (see Section 12.1, “Configuration”) or remotely (see Section 12.2.1, “Remote Connection”).Select the MBean. The name of the MBean is
kodo:type=Profiling.Listen to the MBean notifications. See Section 12.2.2.1.2, “Listening to Notifications” (this happens automatically, but if you turn off notifications, you will need to turn them on again in order to see updates).
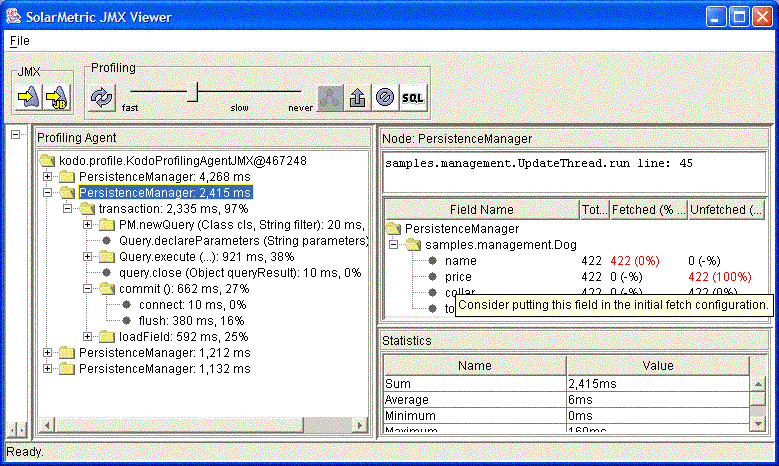
The MBean Panel contains a custom viewer when
the profiling MBean is selected. This custom viewer contains the
Kodo Profiling Console.
Additionally, the console toolbar will have profiling toolbar
options. Please see Chapter 13, Profiling for more
information.