The Kodo profiling capability allows for profiling of application code. It is designed to help optimize the use of Kodo, and is not intended to be a generic profiling tool. Only Kodo specific APIs are instrumented.
![[Important]](img/important.gif) | Important |
|---|---|
This feature requires Kodo Enterprise Edition or Kodo Professional Edition. |
The profiling capability can either be used standalone
using the Kodo Profiling Console, or inside
the Kodo Management Console using the
Profiling MBean. To use the profiling capability within the
Kodo Management Console see
Section 12.4.8, “Profiling MBean”.
The profiling capability can be used standalone locally.
To bring up the Kodo Profiling Console,
set the following property (see
Section 2.7.43, “kodo.ManagementConfiguration”):
JPA XML format:
<property name="kodo.ManagementConfiguration" value="profiling-gui"/>
JDO properties format:
kodo.ManagementConfiguration: profiling-gui
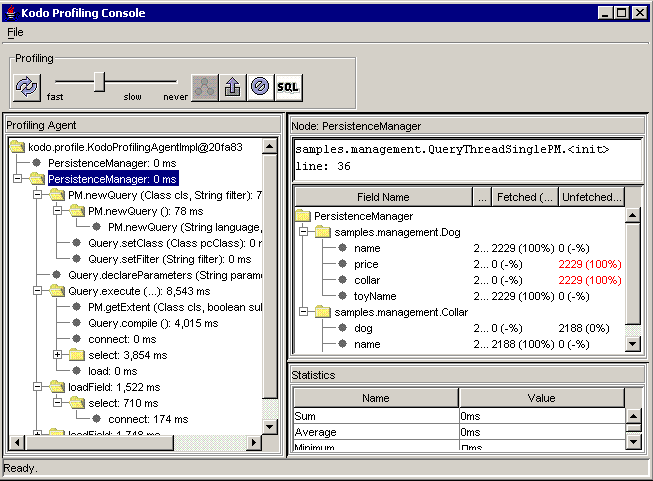
The left pane of the Profiling Console contains a tree. Each node in
the tree represents a call in a call stack. The root of each call
stack is an EntityManager or
PersistenceManager.
Each node may be composed of three items - the node name, the amount of time spent in each node, and the percentage of the total time spent in the parent node that this child node contributes. You can see details about a node in the right panes by selecting a node. The top right pane(s) yield detailed information about the node (e.g. the location in code where a transaction was started, or the SQL generated for a query), and the bottom right pane contains statistics about the node.
The Profiling Console has a Profiling Toolbar. It has the following controls:
Refresh: Refreshes the statistics shown in the tree.Refresh slider: Set the interval at which the tree will be refreshed.Show descendants: Show the tree withEntityManagers /PersistenceManagers as roots.This is the normal view. This option is available only when the
Show ancestorsview is in use. See theShow ancestorsfeature below.Export...: Export the current profiling data to a file for later viewing. Exported profiling data is stored in files ending in.prx. The export can be viewed using theprofilingviewerapplication. To do this run theprofilingviewerapplication and pass in the name of the exported file.Reset: Resets the statistics shown in the tree.Show SQL: Show an inverted tree where the root nodes are SQL statements, and their ancestors are shown as children in the tree.
The profiling call tree has a context menu containing the following options:
Refresh: Refreshes the statistics shown in the tree.Show ancestors: Show an inverted tree where the nodes of the same name and description as the selected node are used as the roots, and their ancestors are shown as children in the tree.Show descendants: Show the tree withEntityManagers /PersistenceManagers as roots.This is the normal view. This option is available only when the
Show ancestorsview is in use.Export...: Export the current profiling data to a file for later viewing. Exported profiling data is stored in files ending in.prx. The export can be viewed using theprofilingviewerapplication. To do this run theprofilingviewerapplication and pass in the name of the exported file.Reset: Resets the statistics shown in the tree.
The detail information for an EntityManager
or PersistenceManager
includes information about objects that were fetched in the
context of that manager. The detail area consists of information
about where in code the manager was created, and a table
with information on each field in each persistence-capable class.
The table has the following columns:
Field Name: The name of the persistent field.Total: The total number of times the object containing that field was loaded in the context of the containing manager.Fetched / % Used: The first number represents the number of times the field was fetched during the initial load. The second number represents the percentage of initially fetched fields that are actually accessed. A low percentage indicates that perhaps that field should not be in the default fetch group or in a fetch group configured for initial load.Unfetched / % Used: The first number represents the number of times the field was not fetched during the initial load. The second number represents the percentage of the time the initially unfetched field is actually accessed. A high percentage indicates that perhaps that field should be in the default fetch group or in a fetch group configured for initial load.