

|
|
|
|
|
|
Monitoring the C-Hub
The following sections describe how to monitor a c-hub:
Viewing Statistics on the C-Hub
To view statistics on the current c-hub, select Monitoring in the left navigation bar, then click the Hub tab.
Figure 18-1 Viewing Statistics on the C-Hub
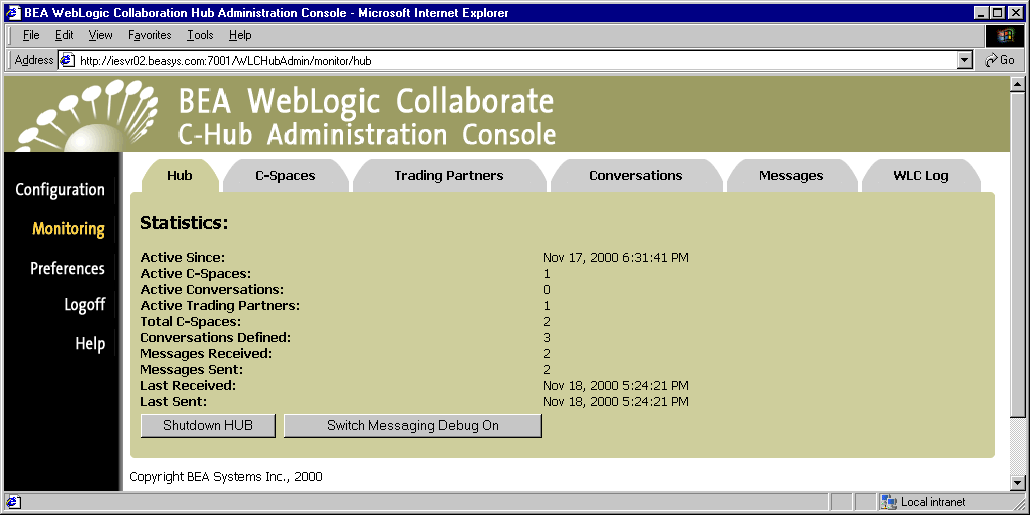
The following table explains the fields on this screen.
Note: You can also shut down a running c-hub from this tab. For more information on this, see Shutting Down a Running C-Hub.
Monitoring C-Spaces on the C-Hub
To view c-spaces for a c-hub, select Monitoring in the left navigation bar, then click the C-Spaces tab.
Figure 18-2 Monitoring C-Spaces
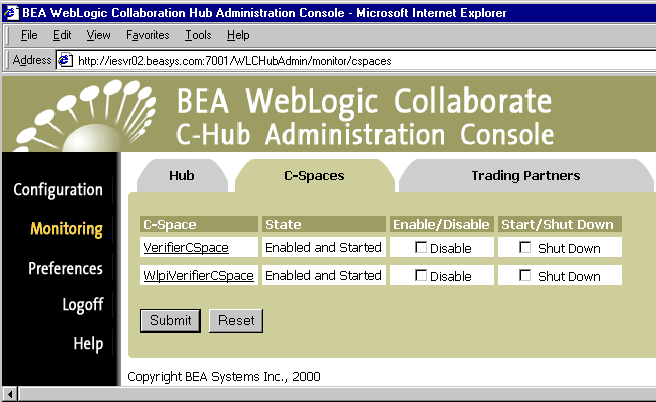
The following table explains the fields on this screen.
Getting Details on a C-Space
From the main C-Spaces tab you can click on a value in the C-Spaces field to view the details about the selected c-space.
Figure 18-3 Details on a Selected C-Space
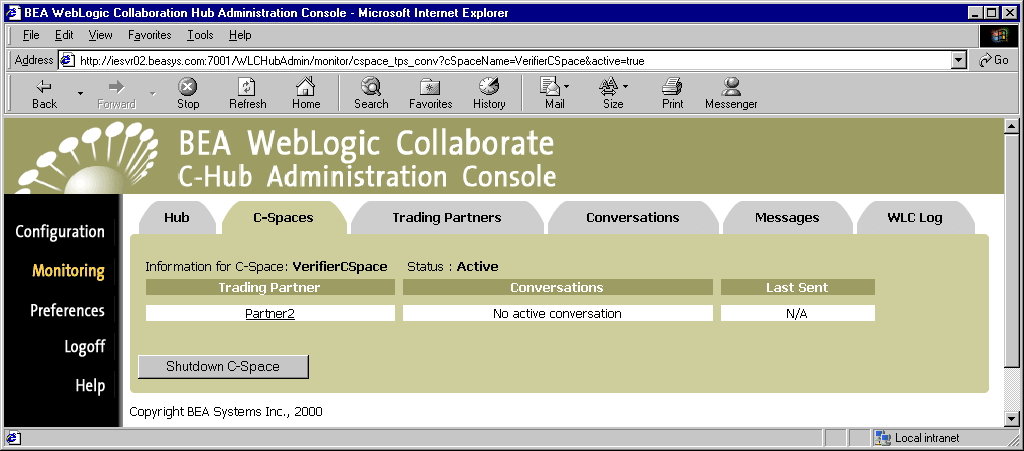
The following table explains the fields on this screen.
Monitoring Trading Partners on the C-Hub
To view trading partners for a c-hub, select Monitoring in the left navigation bar, then click the Trading Partners tab.
Figure 18-4 Monitoring Trading Partners
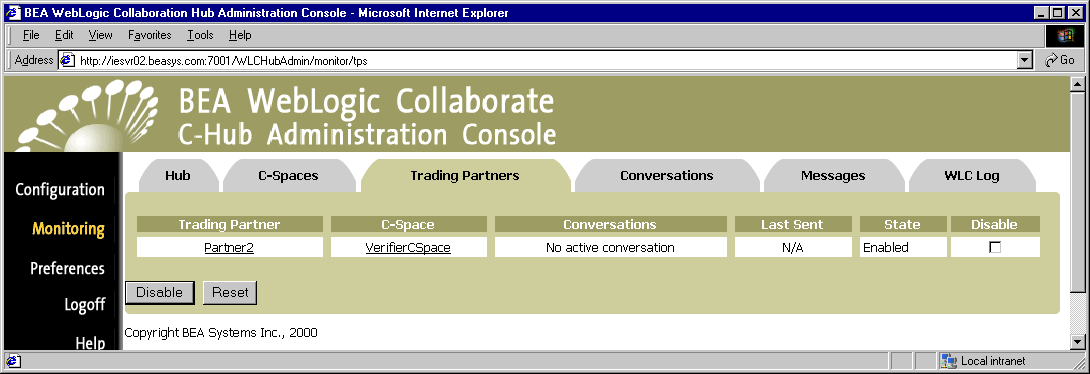
The following table explains the fields on this screen.
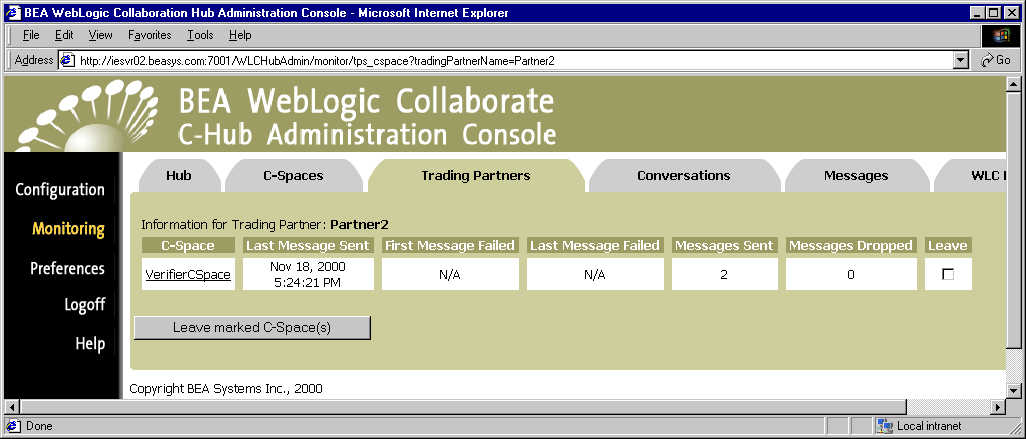
Getting Details on a Trading Partner
From the main Trading Partners monitoring tab you can click on a value in the Trading Partner field to view the details about the selected trading partner.
Figure 18-5 Details on a Selected Trading Partner
The following table explains the fields on this screen.
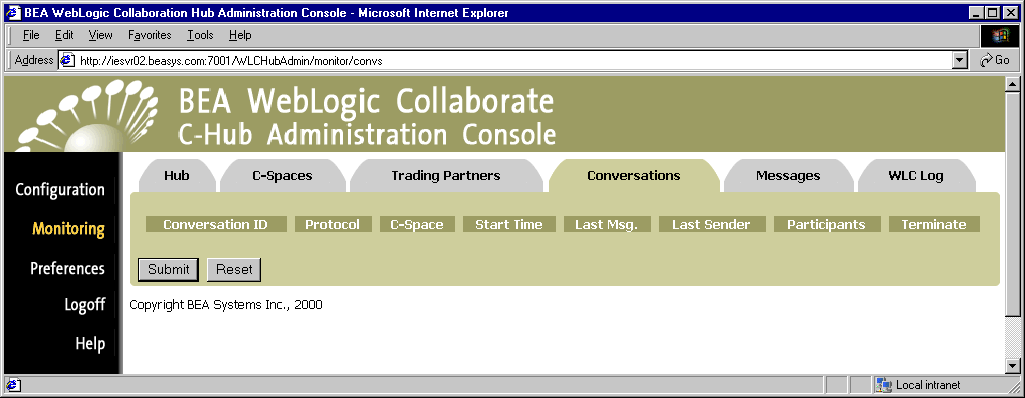
Monitoring Conversations on the C-Hub
To view conversations for a c-hub, select Monitoring in the left navigation bar, then click the Conversations tab.
Figure 18-6 Monitoring Conversations
The following table explains the fields on this screen.
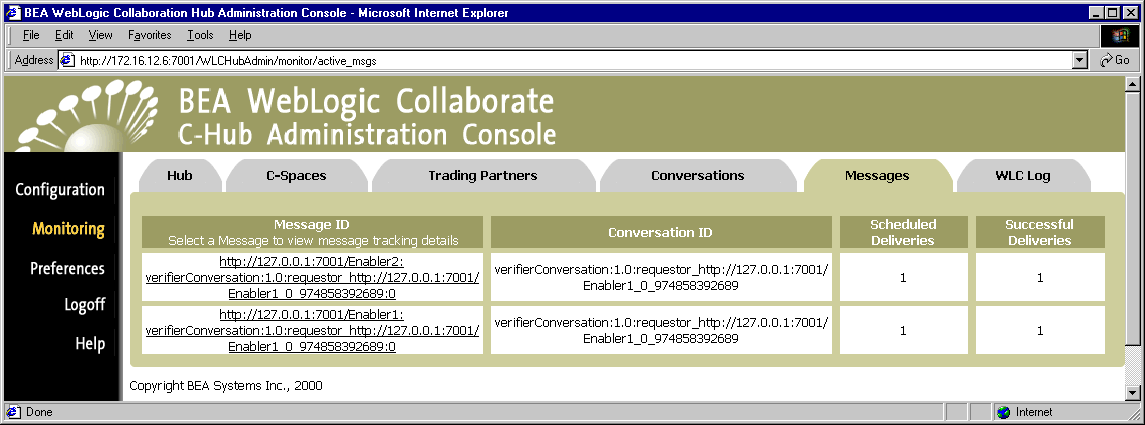
Viewing Messages on the C-Hub
To view outstanding Messages for a c-hub, select Monitoring in the left navigation bar, then click the Messages tab. (Outstanding messages are messages that have not been delivered to all scheduled destinations.)
Figure 18-7 C-Hub Messages
The following table explains the fields on this screen.
Viewing Details for a Particular Message
From the main Message monitoring tab you can click on a Message in the Message ID column to view the details about the selected message.
Figure 18-8 Viewing Details for the Selected Message
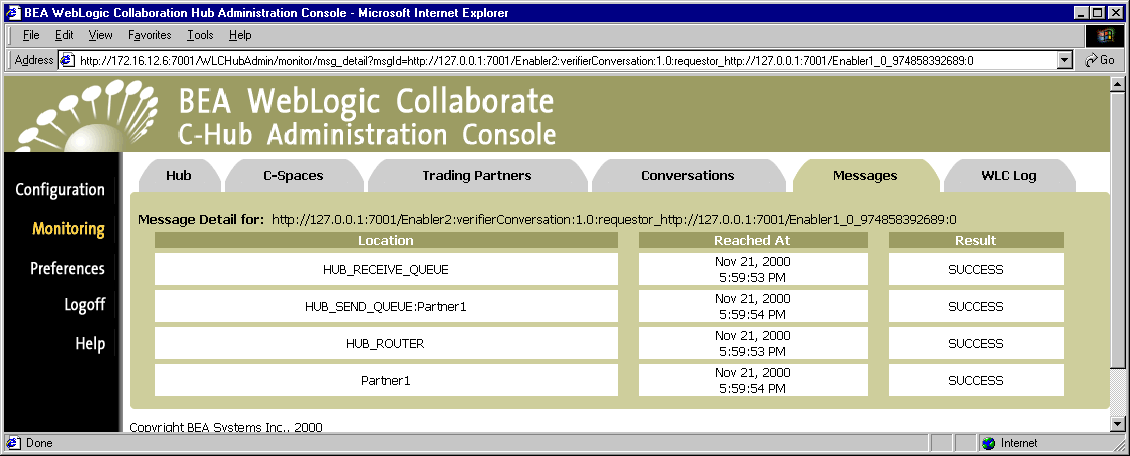
The following table explains the information reported on the details of a particular message.
|
Field |
Description |
|---|---|
|
Location |
Locations to which the message has been sent. |
|
Reached At |
|
|
Result |
The possible results are: |
Viewing the WebLogic Collaborate Log
To view WebLogic Collaborate (WLC) log, select Monitoring in the left navigation bar, then click the WLC Log tab.
Figure 18-9 Viewing the WLC Log
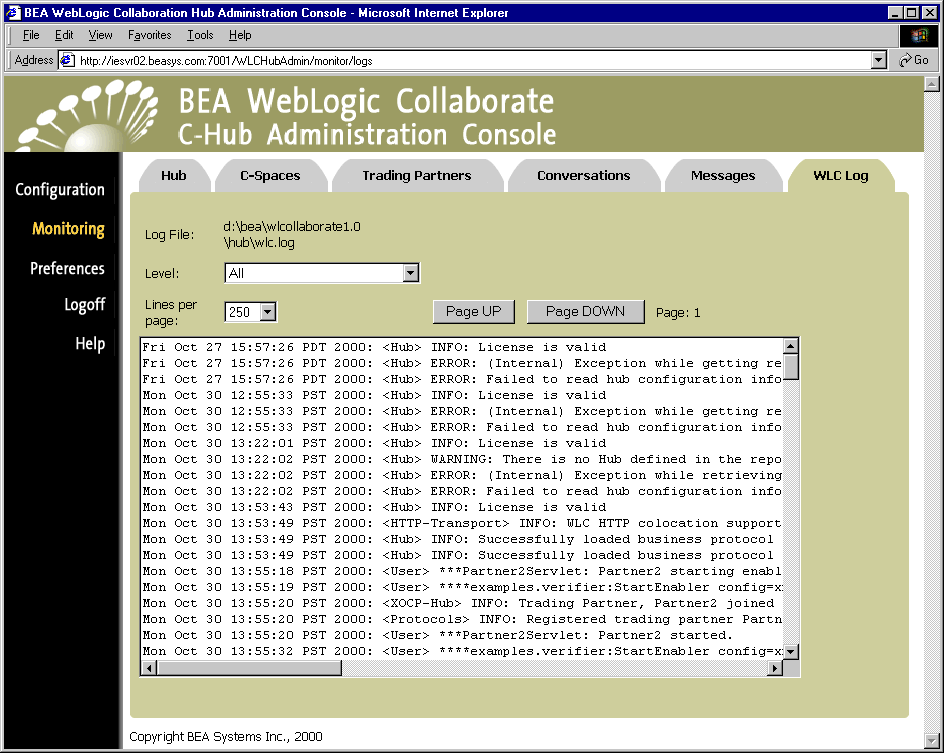
You can set the Level and Lines per Page filters in the drop-down menus as explained in the following table.
A list of error messages is dynamically displayed based on the Level and Lines per Page filters you apply. You can use the Page UP and Page DOWN buttons to browse through long lists of messages.

|

|
|
|
|
Copyright © 2001 BEA Systems, Inc. All rights reserved.
|