


|
This example is based on a simple Purchase Order application that processes the following Business Object Documents (BODs) defined according to Open Applications Group (OAG) standards:
| Note: | The tests described in this guide were conducted in a controlled environment; so the numbers presented here may not match the results that you get when you run the tests in your environment. The numbers are meant to illustrate the capacity planning process. |
The following figure shows the configuration of the application.
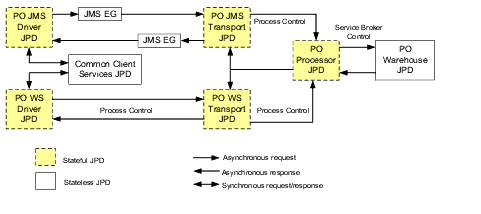
The application has the following components:
Each line item in the purchase order has a description, which is mapped to a specific warehouse by using dynamic control properties.
In this example, the workload is designed with zero think time because the process is automated (no human user interaction) and the goal is in terms of transactions processed per second.
For this example, a mix of 50% PO WS Driver JPD users and 50% PO JMS Driver JPD users is considered. A Mercury LoadRunner-based Java program is used as a load generation client for the tests. The client triggers the Driver JPDs by using SOAP/HTTP and waits for a callback before sending the next request.
The entire flow of operations for processing the purchase order - invoking the driver JPD, sending the purchase order document, and receiving an acknowledgement document - is considered a single unit of work.
The target SLA for this example is 50 purchase orders processed per second, with a maximum average CPU utilization of 70%.
The following sections describe the hardware and software configurations for executing the scalability tests.
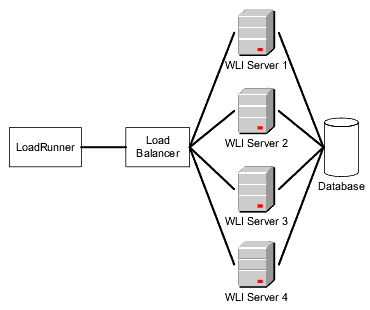

-Xms 1536m -Xmx 1536m -Xgc:parallelwli.internal.instance.info.buffer)The software configuration for vertical scalability tests is the same as for horizontal scalability tests, except for the following JMS EG settings:
These settings increase the number of message-driven beans for JMS EG in WLI 9.2 from the default value of five to 16. This change has been done in the vertical scaling scenario because the default value was not sufficient to handle a large number of incoming messages.
/3 GB switch.Init.ora parameters:*.aq_tm_processes=1*.background_dump_dest='D:\oracle\admin\PERFDB2\bdump'*.compatible='9.2.0.0.0'*.control_files='D:\oracle\oradata\PERFDB2\CONTROL01.CTL','D:\oracle\oradata\PERFDB2\CONTROL02.CTL','D:\oracle\oradata\PERFDB2\CONTROL03.CTL'*.core_dump_dest='D:\oracle\admin\PERFDB2\cdump'*.db_block_size=8192*.db_cache_size=25165824*.db_domain=''*.db_file_multiblock_read_count=16*.db_name='PERFDB2'*.dispatchers='(PROTOCOL=TCP) (SERVICE=PERFDB2XDB)'*.fast_start_mttr_target=300*.hash_join_enabled=TRUE*.instance_name='PERFDB2'*.java_pool_size=33554432*.job_queue_processes=10*.large_pool_size=8388608*.open_cursors=300*.pga_aggregate_target=55165824*.processes=1000*.query_rewrite_enabled='FALSE'*.remote_login_passwordfile='EXCLUSIVE'*.shared_pool_size=90331648*.sort_area_size=524288*.star_transformation_enabled='FALSE'*.timed_statistics=TRUE*.undo_management='AUTO'*.undo_retention=10800*.undo_tablespace='UNDOTBS1'*.user_dump_dest='D:\oracle\admin\PERFDB2\udump'
The following sections describe the results of the scalability tests.
The following figure shows the results of the vertical scalability tests.
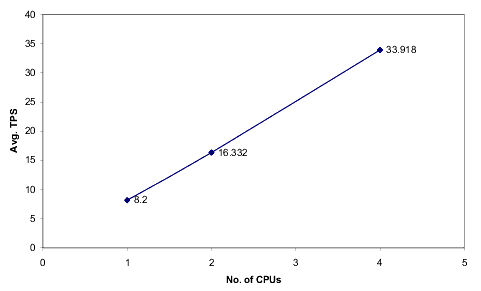
The tests were executed with 1, 2, and 4 CPUs for WLI. The load was increased gradually till the CPU utilization reached 70%. The graph shows that the SLA of 50 purchase orders processed per second with a maximum average CPU utilization of 70% cannot be achieved with four CPUs.
You can fit a curve for the results obtained from the tests, derive an equation for the curve, and use it to estimate the additional hardware resources required, as described in Capacity Estimation.
The following figure shows the results of the horizontal scalability tests.
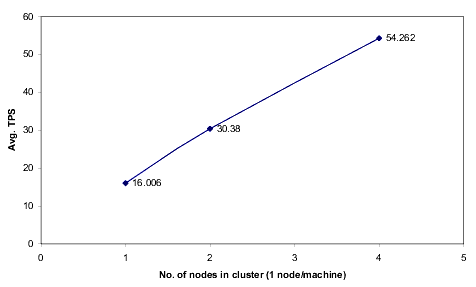
The tests were executed with 1, 2, and 4 machines, with one managed server in each machine. The graph shows the average TPS at 70% CPU utilization. The graph shows that a 4-node WLI cluster (with one machine per node) can process 54.262 purchase orders at 70% CPU utilization.
In the example described here, the required SLA was achieved with the available hardware resources in the horizontal scaling scenario, whereas it was not achieved in the vertical scaling scenario.
If the required SLA is not achieved, you can fit a curve for the results obtained from the tests, derive an equation for the curve, and use it to estimate the additional hardware resources required.
The following figure shows capacity estimation in the vertical scaling scenario.
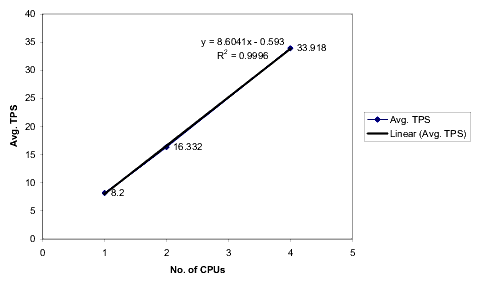
For this example, the equation is y = 8.6041x - 0.593, where y is the average TPS and x is the number of CPUs. The curve indicates that WLI applications scale linearly.
| Note: | This equation is based on the test setup described in this guide. The equation that you must use to estimate capacity would depend on your test setup, nature of your application, and the SLA. In addition, the tests described in this document assume an environment where database- and database I/O-related bottlenecks do not exist. |
The following figure shows capacity estimation in the horizontal scaling scenario.
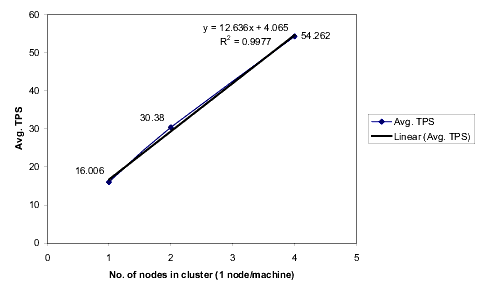
The equation is y = 12.636x + 4.065, where y is the average TPS and x is the number of nodes in the cluster.
| Note: | This equation is based on the test setup described in this guide. The equation that you must use to estimate capacity would depend on your test setup, nature of your application, and the SLA. In addition, the tests described in this document assume an environment where database- and database I/O-related bottlenecks do not exist. |


|