| Bookshelf Home | Contents | Index | PDF | |
|
Configuring Siebel Business Applications > Configuring Special-Purpose Applets > Configuring a Chart Applet > Configuring Lists in Chart AppletsA chart applet typically provides one or more lists that allow the user to determine how Siebel CRM displays or uses data. Figure 61 includes these lists. Explanation of CalloutsThe following types of lists are available:
Required Properties of the ListsEach list in a chart applet requires a corresponding ComboBox control that is a child object of the chart applet. Table 46 describes the required properties for each type of list. Configuring the Show List of a Chart AppletThe show list allows the user to modify data that Siebel CRM displays on the Y-axis. It displays a list of field and function combinations that determine the values that Siebel CRM plots along the Y-axis. The title of the Y-axis mirrors the label of the show list. To configure the show list of a chart applet
Example of a Show List That Is Defined ExplicitlyYou can define a show list with an explicit format that displays the following choices: Table 47 describes the properties and their values that are required to implement this example.
In this example, the values in each comma separated list creates the following relationships between the properties:
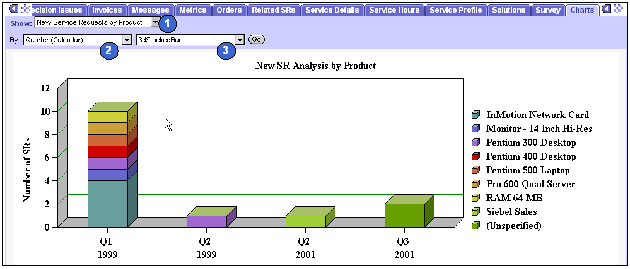
Example of a Show List That Is Defined ImplicitlyIt is recommended that you explicitly define the show list. Siebel CRM retains the ability to implicitly define the Show list for backwards compatibility with earlier versions of Siebel CRM. It is more restrictive. The Lead Source Analysis chart in the Opportunity New Business Analysis view in Siebel Sales (Oppty Chart Applet - New Business) is an example of a Show list that Siebel CRM defines with an implicit format and function list. This list displays the following choices: Table 48 describes the properties and their values that are required to implement this example.
The value of Revenue in the Data Point Field property applies to all entries in the list. In this example, the values in each comma separated list creates the following relationships between the properties:
The value of the Count in the Data Function property is not required. It can be empty. If the number of entries in the Data Function property is not the same as the number of entries in the Picklist Functions property, then Siebel CRM supplies the following predefined list in the Data Function property: Configuring the By List of a Chart AppletThe by list allows the user to modify data on the X-axis:
To configure the by list of a chart applet Calendar Increments in the List and the X-AxisIf the Category Field property contains the name of a single field that is a DTYPE_DATE data type, then the X-axis displays calendar increments and the chart is a period chart. In this situation, Siebel CRM enters data into the list with calendar increment options, including user defined periods, such as Day, Week, Month, Quarter, and Year. You can administer these increments in the Periods view of the Administration - Data screen. For example, in the New Business Analysis chart the category field is Created, which is the date that Siebel CRM created the opportunity record. The increment that the user chooses in the by list determines the date increments that the category axis contains. Text labels in the X-Axis and Category and Series Field Names in the ListIf the Category Field property contains the name of a single text field from the business component, and if a series field is defined in the Series Field property, then the by list includes the names of the category field and the series field. The user can choose either field to update the X-axis with labels from the contents of that field. The unchosen field provides labels for the legend box. The legend box is the Z-axis. The default value is the category field and Siebel CRM initially displays it on the X-axis. For example, the chart in the Service Request Product Analysis view in the Siebel Service application includes a Product category field and a Severity series field. When Siebel CRM initially displays the chart, the X-axis labels are product names and the legend labels are severity levels. Siebel CRM displays the Product and Severity field names in the by list. The severity allows the user to display severity levels in the X-axis and product names in the legend. Text Labels in the X-Axis and Multiple Field Names in the ListIf the Category Field property contains a comma separated list of field names, then Siebel CRM displays this list in the by list. The user chooses the field that provides data for the X-axis. The default value is the first value in the list. You must not include an empty space before or after a field name in the list. Numeric Values in the X-Axis and No ListIf the Category Field property contains the name of a single numeric field, then the X-axis includes numeric increments, similar to the process of creating increments for the Y-axis. In this situation, Siebel CRM does not display the by list. For example, the Probability Cluster Analysis chart in the Opportunity Probability Cluster Analysis view includes the Rep% category field, which is the probability of a sale. In this chart, Siebel CRM plots probability against the X-axis, the X-axis increments are percentages from 0% to 100%, and Siebel CRM displays no by list. Configuring the Second By List of a Chart AppletYou can configure the second by list. To configure the second by list of a chart applet The following values in the Series Field property in the chart object determines the behavior of the second by list:
|
 |
|
| Configuring Siebel Business Applications | Copyright © 2013, Oracle and/or its affiliates. All rights reserved. Legal Notices. | |