3 Server and Domain Tasks
This section contains the typical server and domain tasks you can perform with Oracle CEP Visualizer.
Oracle CEP Visualizer is fairly self-explanatory and intuitive, so not all tasks are discussed here, but rather, just those that are most common and typical and from which other similar tasks can be deduced.
This chapter describes:
3.1 Overview of Server and Domain Tasks
Using Oracle CEP Visualizer, you can perform a variety of server management tasks, including managing:
3.1.1 Jetty
Oracle CEP supports Jetty (see http://www.mortbay.org/jetty/) as the Java Web server to deploy HTTP servlets and static resources.
Oracle CEP support for Jetty is based on Version 1.2 the OSGi HTTP Service. This API provides the ability to dynamically register and unregister javax.servlet.Servlet objects with the run time and static resources.
Oracle CEP allows you to configure how your application prioritizes the execution of its work. Based on rules you define and by monitoring actual run time performance, you can optimize the performance of your application and maintain service level agreements. You define the rules and constraints for your application by defining a work manager.
For more information, see:
-
"Configuring Jetty for Oracle CEP" in the Oracle CEP Administrator's Guide
-
"Jetty Work Managers" in the Oracle CEP Administrator's Guide
3.1.2 JMX
Oracle CEP provides standards-based interfaces that are fully compliant with the Java Management Extensions (JMX) specification. Software vendors can use these interfaces to monitor Oracle CEP MBeans, to change the configuration of an Oracle CEP domain, and to monitor the distribution (activation) of those changes to all server instances in the domain.
Oracle CEP Visualizer and the wlevs.Admin command line tool both use JMX to connect to a server. However, to use these tools, and the JMX interfaces in general, you must configure Oracle CEP with the JMX configuration information in the config.xml file.
For more information, see:
-
"Configuring JMX for Oracle CEP" in the Oracle CEP Administrator's Guide
3.1.3 Data Sources
Oracle CEP supports Java Database Connectivity (JDBC) 3.0 for relational database access.
The JDBC API provides a standard, vendor-neutral mechanism for connecting to and interacting with database servers and other types of tabular resources that support the API. The JDBC javax.sql.DataSource interface specifies a database connection factory that is implemented by a driver. Instances of DataSource objects are used by applications to obtain database connections (instances of java.sql.Connection). After obtaining a connection, an application interacts with the resource by sending SQL commands and receiving results.
For more information, see:
-
"Configuring JDBC for Oracle CEP" in the Oracle CEP Administrator's Guide
3.1.4 HTTP Publish-Subscribe Server
Oracle CEP includes an HTTP publish-subscribe server to which applications can publish messages. Applications publish messages to a particular channel; other applications can then subscribe to this channel to receive these published messages.
You can use Oracle CEP Visualizer to modify existing channels, as well as create new ones and delete existing ones. When you configure channels with Oracle CEP Visualizer, they are permanent and survive server restart. Channels configured using APIs from a custom http pub-sub adapter are dynamic and do not survive server restart.
Oracle CEP Visualizer includes the following preconfigured channels that are used by Oracle CEP Visualizer itself; they cannot be deleted or modified:
-
/evsmonitor -
/evsalert -
/evsdomainchange
For more information, see:
-
Section 3.5, "Managing HTTP Publish-Subscribe Server Channels"
-
Section 4.5.1, "How to Configure Security for an HTTP Publish-Subscribe Channel"
-
"Configuring HTTP Publish-Subscribe for Oracle CEP" in the Oracle CEP Administrator's Guide
3.1.5 Event Type Repository
Event types define the properties of the events that are handled by Oracle CEP applications. All the event types used by the applications of a server make up the event type repository.
For more information, see:
-
"Creating Oracle CEP Event Types" in the Oracle CEP IDE Developer's Guide for Eclipse
3.1.6 Persistent Event Store
The Oracle CEP event repository feature allows you to persist the events that flow out of a component of the event processing network (EPN) to a store, such as a database table, and then play them back at a later stage or explicitly query the events from a component such as an event bean. By default, Oracle CEP stores recorded events in a database, which means that before you can start using the record and playback feature in your own application, you must specify where the database server is located along with the name of the database server that will contain the recorded events.
For more information, see:
-
"Storing Events in the Persistent Event Store" in the Oracle CEP IDE Developer's Guide for Eclipse
3.1.7 Multi-Server Domains
An Oracle CEP multi-server domain (or cluster) is a set of two or more servers logically connected for the purposes of management, and physically connected using a shared User Datagram Protocol (UDP) multicast address and port. All servers in an Oracle CEP multi-server domain are aware of all other servers in the domain and any one server can be used as an access point for making changes to the deployments in the domain.
Oracle CEP supports the following clustering systems:
-
Oracle Coherence: a JCache-compliant in-memory distributed data grid solution for clustered applications and application servers. It coordinates updates to the data using cluster-wide concurrency control, replicates data modifications across the cluster using the highest performing clustered protocol available, and delivers notifications of data modifications to any servers that request them. You take advantage of Oracle Coherence features using the standard Java collections API to access and modify data, and use the standard JavaBean event model to receive data change notifications.
Note:
Before you can use Oracle CEP with Oracle Coherence, you must obtain a valid Oracle Coherence license such as a license for Coherence Enterprise Edition, Coherence Grid Edition, or Oracle WebLogic Application Grid. For more information on Oracle Coherence, seehttp://www.oracle.com/technology/products/coherence/index.html.
For more information, see:
-
"Administrating Oracle CEP Multi-Server Domains" in the Oracle CEP Administrator's Guide
3.1.8 Cache
A cache is a temporary storage area for events, created exclusively to improve the overall performance of your Oracle CEP application; it is not necessary for the application to function correctly. Oracle CEP applications can optionally publish or consume events to and from a cache to increase the availability of the events and increase the performance of their applications.
A caching system refers to a configured instance of a caching implementation. A caching system defines a named set of configured caches as well as the configuration for remote communication if any of the caches are distributed across multiple machines.
Oracle CEP supports the following caching systems:
-
Oracle CEP local cache: a local, in-memory single-JVM cache.
-
Oracle Coherence: a JCache-compliant in-memory distributed data grid solution for clustered applications and application servers. It coordinates updates to the data using cluster-wide concurrency control, replicates data modifications across the cluster using the highest performing clustered protocol available, and delivers notifications of data modifications to any servers that request them. You take advantage of Oracle Coherence features using the standard Java collections API to access and modify data, and use the standard JavaBean event model to receive data change notifications.
Note:
Before you can use Oracle CEP with Oracle Coherence, you must obtain a valid Oracle Coherence license such as a license for Coherence Enterprise Edition, Coherence Grid Edition, or Oracle WebLogic Application Grid. For more information on Oracle Coherence, seehttp://www.oracle.com/technology/products/coherence/index.html. -
Third-party caches: you can create a plug-in to allow Oracle CEP to work with other, third-party cache implementations.
For more information, see:
-
"Configuring Oracle CEP Caching" in the Oracle CEP IDE Developer's Guide for Eclipse
3.1.9 Logs
Oracle CEP Visualizer allows you to change the server-wide logging configuration, such as the severity of log messages you want the server to print out, the name of the log file, and so on.
You can also view and modify the logging level of individual components and configure logging for new components..
For more information, see:
-
"Configuring Logging and Debugging for Oracle CEP" in the Oracle CEP Administrator's Guide
3.2 Managing the Jetty Web Server
This section describes:
For more information, see Section 3.1.1, "Jetty".
3.2.1 How to View Jetty Web Server Configuration
Using the Oracle CEP Visualizer, you can view the Jetty Web server configuration for a selected Oracle CEP server.
To view Jetty web server configuration:
-
In the left pane, click the Domain > Server node, where Domain refers to the name of your Oracle CEP domain and Server refers to the name of the server instance.
-
In the right pane, click the HTTP Server tab.
-
In the right pane, the properties of the Jetty server are displayed:
-
The name of the Jetty server.
-
The network I/O object to which the Jetty server is bound.
-
The work manager name to which the Jetty server is bound.
-
The list of Web applications that are deployed to this Jetty server, along with the path of the application and its context path.
-
3.2.2 How to Change Jetty Web Server Configuration
You can only view the configuration of the Jetty servers configured in your Oracle CEP server using Oracle CEP Visualizer. To change the configuration, you must manually update the server's config.xml file.
For details, see "Configuring Jetty for Oracle CEP" in the Oracle CEP Administrator's Guide.
3.2.3 How to View Work Manager Configuration
Using the Oracle CEP Visualizer, you can view the work manager configuration for a selected Oracle CEP server.
To view the work manager configuration:
-
In the left pane, click the Domain > Server node, where Domain refers to the name of your Oracle CEP domain and Server refers to the name of the server instance.
-
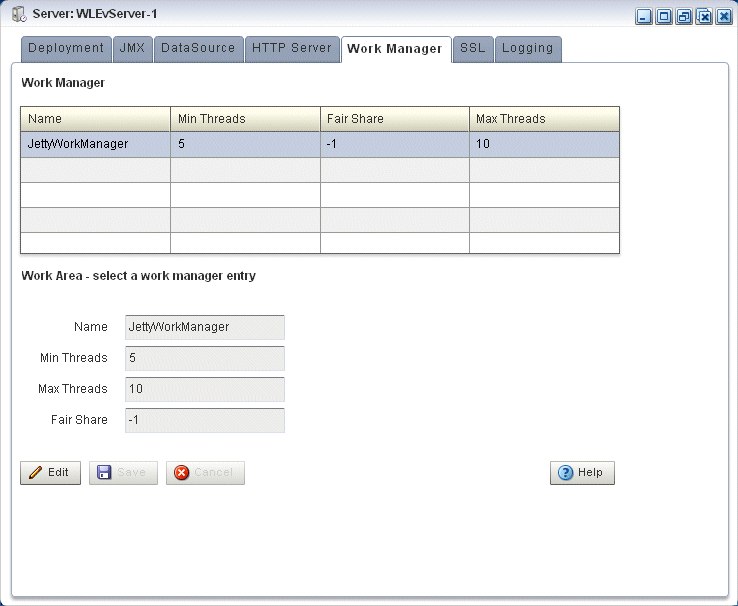
In the right pane, click the Work Manager tab.
The Work Manager tab appears as shown in Figure 3-1.
-
In the Work Manager table, select the work manager you want to configure by clicking on its name.
-
Click the Change button at the bottom of the page.
-
Update the work manager configuration properties:
-
Min threads—The minimum number of threads that the server allocates so as to reduce the initial time it takes to perform a task. -
Max threads—The maximum number of concurrent threads that execute requests from the constrained work set. -
Fair Share—The average thread-use time required to process requests.
-
-
Click Save to save your changes or Cancel to cancel the update.
3.2.4 How to Create a Work Manager
You cannot delete existing work managers or create new ones using Oracle CEP Visualizer; rather, you must manually update the server's config.xml file.
For details, see "Jetty Work Managers" in the Oracle CEP Administrator's Guide.
3.2.5 How to Delete a Work Manager
You cannot delete existing work managers or create new ones using Oracle CEP Visualizer; rather, you must manually update the server's config.xml file.
For details, see "Jetty Work Managers" in the Oracle CEP Administrator's Guide.
3.3 Managing JMX
This section describes:
For more information, see Section 3.1.2, "JMX".
3.3.1 How to View JMX Configuration
Using the Oracle CEP Visualizer, you can view the JMX configuration for a selected Oracle CEP server.
-
In the left pane, click the Domain > Server node, where Domain refers to the name of your Oracle CEP domain and Server refers to the name of the server instance.
-
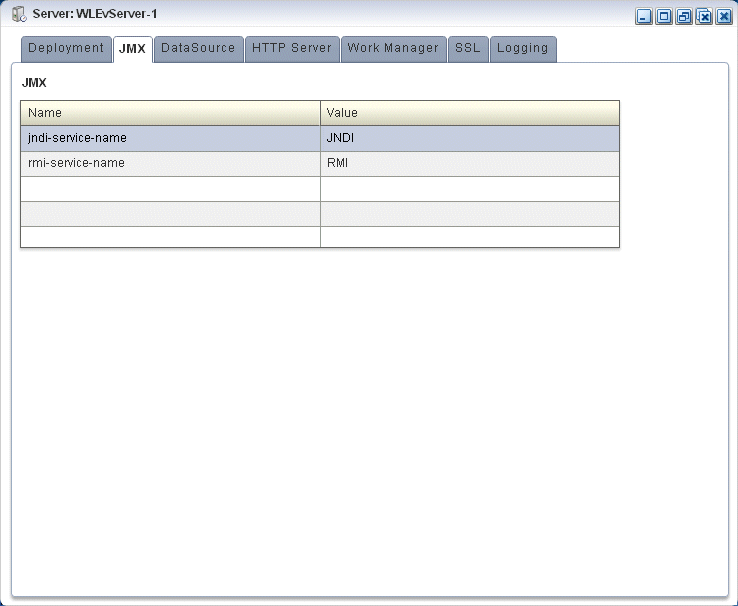
In the right pane, click the JMX tab.
The JMX tab appears as Figure 3-2 shows.
-
The JMX properties are displayed in the table:
-
jndi-service-name—The name of the JNDI service to which the JMX server will bind its object. -
rmi-service-name—The name of the RMI service with which the JMX server will register to receive calls. -
rmi-jrmp-port—The port on which to listen for RMI JRMP JMX requests. -
rmi-registry-port—The port on which to start the RMIRegistry.
Note:
Oracle CEP does not support the JRMP protocol: an Oracle CEP JMX client does not use thermi-jrmp-portorrmi-registry-portproperties. Instead, JMX clients must use the more secure MSA protocol for both local and remote access to the Oracle CEP JMX server. When you connect to the Oracle CEP JMX server that is running onlocalhostor on a remote host, you must always use the JMX URLservice:jmx:msarmi://HOST-NAME:PORT/jndi/jmxconnectorso that you are always using the MSA connector (whereHOST-NAMEis eitherlocalhostor the name of the remote host andPORTis the Oracle CEP server JNDI port). For more information, see "Accessing the Oracle CEP JMX Server" in the Oracle CEP Administrator's Guide. -
3.3.2 How to Modify JMX Configuration
You can only view the JMX configuration of your Oracle CEP server using Oracle CEP Visualizer. To change the configuration, you must manually update the server's config.xml file.
For more information, see "Configuring JMX for Oracle CEP" in the Oracle CEP Administrator's Guide.
3.4 Managing Data Sources
This section describes:
For more information, see Section 3.1.3, "Data Sources".
3.4.1 How to View a Data Source Configuration
Using the Oracle CEP Visualizer, you can view the data source configuration for a selected Oracle CEP server.
To view a data source configuration:
-
In the left pane, click the Domain > Server node, where Domain refers to the name of your Oracle CEP domain and Server refers to the name of the server instance.
-
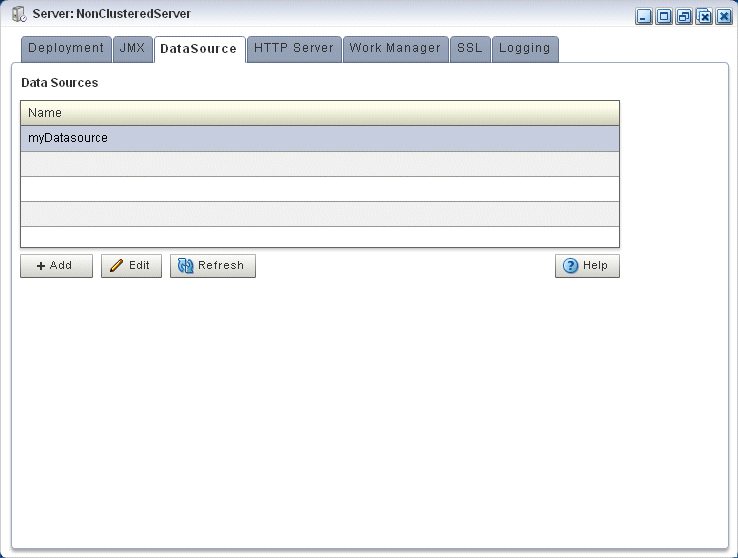
In the right pane, click the DataSource tab.
The DataSource tab appears as Figure 3-3 shows.
3.4.2 How to Add a Data Source Configuration
Using the Oracle CEP Visualizer, you can add the data source configuration for a selected Oracle CEP server.
To add a data source configuration:
-
In the left pane, click the Domain > Server node, where Domain refers to the name of your Oracle CEP domain and Server refers to the name of the server instance.
-
In the right pane, click the DataSource tab.
The DataSource tab appears as Figure 3-4 shows.
-
Click Add.
The New Datasource dialog appears as Figure 3-5 shows. There are three accordion tabs:
-
Data Source: use this tab to identify the data source and specify whether or not to use a global transaction protocol.
-
Global Tx Protocol: use this tab to specify connection properties and whether or not to use XA.
-
Connection Pool: use this tab to specify connection pool properties.
-
-
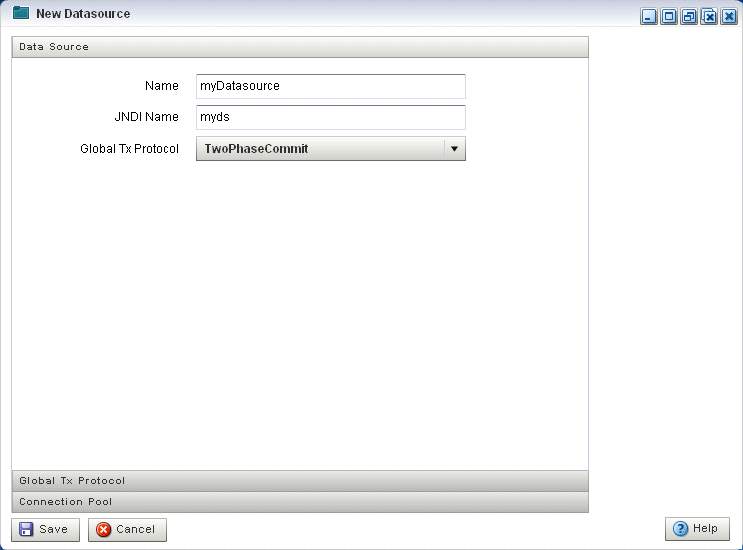
Click the Data Source tab.
The DataSource tab appears as Figure 3-5 shows.
Figure 3-5 New Datasource: Data Source Tab
Description of "Figure 3-5 New Datasource: Data Source Tab"
-
Configure the DataSource tab as Table 3-1 describes.
Table 3-1 New Datasource: Data Source Parameters
Parameter Description NameThe name for this data source configuration.
JNDI NameJNDI path to where this data source will be bound. This is the name your Oracle CEP application uses to look up the data source in JNDI.
Global Tx ProtocolSelect the protocol for Oracle CEP to use for the transaction branch when processing a global transaction:
-
OnePhaseCommit -
TwoPhaseCommit(Default) -
LoggingLastResource -
EmulateTwoPhaseCommit -
None
-
-
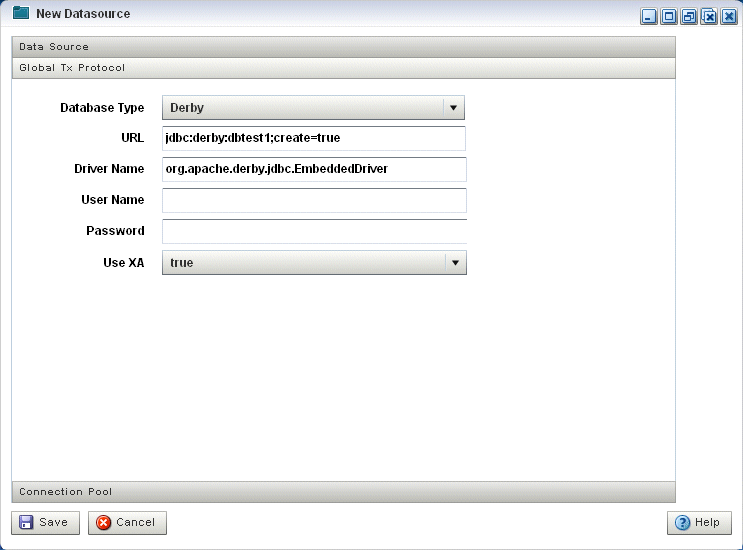
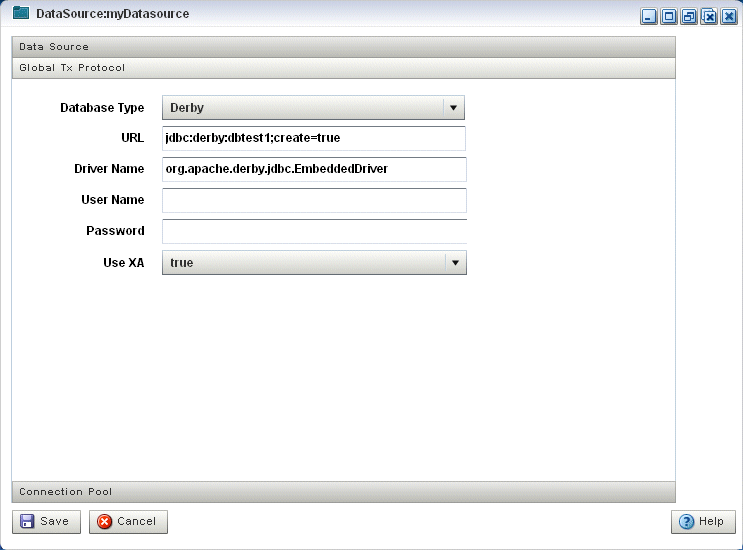
Click the Global Tx Protocol tab.
The Global Tx Protocol tab appears as Figure 3-6 shows.
Figure 3-6 New Datasource: Global Tx Protocol Tab
Description of "Figure 3-6 New Datasource: Global Tx Protocol Tab"
-
Configure the Global Tx Protocol tab as Table 3-2 describes.
Table 3-2 New Datasource: Global Tx Protocol Parameters
Parameter Description Database TypeSelect the type of JDBC driver to use:
-
Derby -
Oracle -
SQL Server 2005 -
Other
URLSpecify the database connection URL appropriate for your database. This URL includes the name of the database, the host and port of the computer on which the database server is running, and so on
User NameSpecify database user account name that you want to use for each connection in the data source.
PasswordSpecify database user password that you want to use for each connection in the data source
Use XASpecify whether or not to use distributed transactions:
-
true: enable distributed transactions. -
false: disable distributed transactions.
-
-
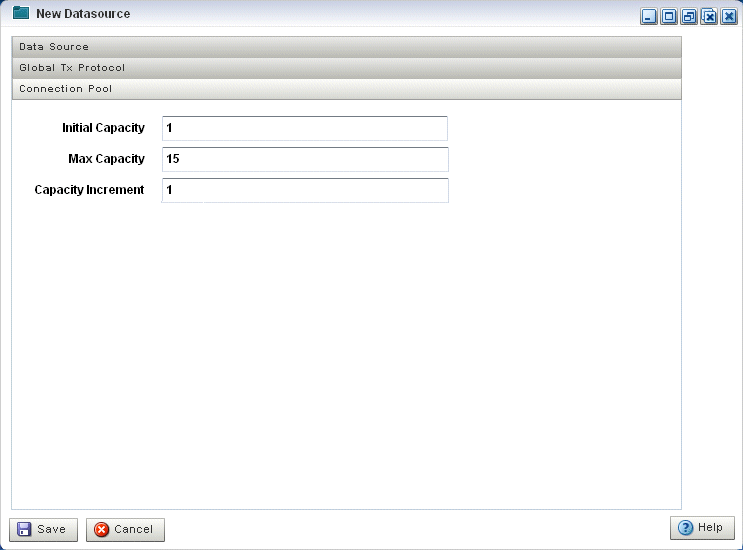
Click the Connection Pool tab.
The Connection Pool tab appears as Figure 3-7 shows.
Figure 3-7 New Datasource: Connection Pool Tab
Description of "Figure 3-7 New Datasource: Connection Pool Tab"
-
Configure the Connection Pool tab as Table 3-3 describes.
Table 3-3 New Datasource: Connection Pool Parameters
Parameter Description Initial CapacitySpecify the number of physical connections to create when creating the connection pool.
Max CapacitySpecify the maximum number of physical connections that this connection pool can contain.
Capacity IncrementSpecify how many connections to add when all the connections in the connection pool are in use and the connection pool receives a new connection request.
-
Click Save.
The new datasource is added to the Oracle CEP server configuration.
3.4.3 How to Edit Data Source Configuration
Using the Oracle CEP Visualizer, you can edit the data source configuration for a selected Oracle CEP server.
To edit data source configuration:
-
In the left pane, click the Domain > Server node, where Domain refers to the name of your Oracle CEP domain and Server refers to the name of the server instance.
-
In the right pane, click the DataSource tab.
The DataSource tab appears as Figure 3-8 shows.
-
In the Data Sources table, select the data source you want to edit by clicking on its name.
-
Click Edit.
The Datasource dialog appears as Figure 3-9 shows.
-
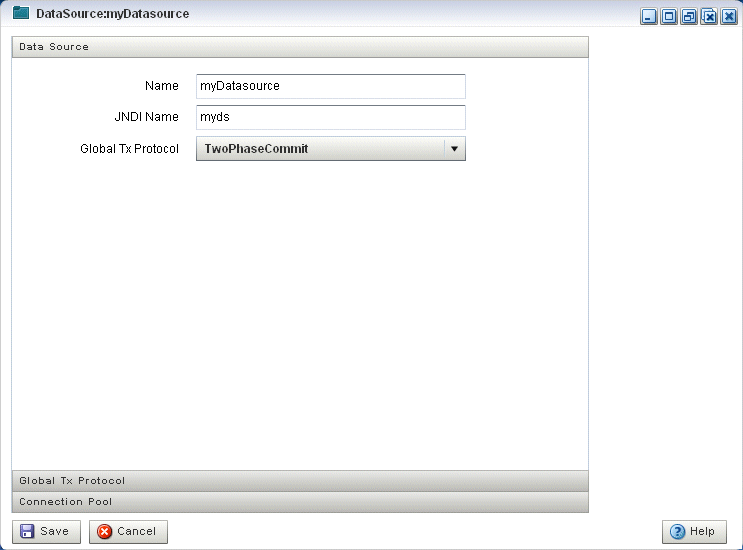
Click the Data Source tab.
The DataSource tab appears as Figure 3-9 shows.
Figure 3-9 Edit Datasource: Data Source Tab
Description of "Figure 3-9 Edit Datasource: Data Source Tab"
-
Configure the DataSource tab as Table 3-4 describes.
Table 3-4 Edit Datasource: Data Source Parameters
Parameter Description NameThe name for this data source configuration.
JNDI NameJNDI path to where this data source will be bound. This is the name your Oracle CEP application uses to look up the data source in JNDI.
Global Tx ProtocolSelect the protocol for Oracle CEP to use for the transaction branch when processing a global transaction:
-
OnePhaseCommit -
TwoPhaseCommit(Default) -
LoggingLastResource -
EmulateTwoPhaseCommit -
None
-
-
Click the Global Tx Protocol tab.
The Global Tx Protocol tab appears as Figure 3-10 shows.
Figure 3-10 Edit Datasource: Global Tx Protocol Tab
Description of "Figure 3-10 Edit Datasource: Global Tx Protocol Tab"
-
Configure the Global Tx Protocol tab as Table 3-5 describes.
Table 3-5 Edit Datasource: Global Tx Protocol Parameters
Parameter Description Database TypeSelect the type of JDBC driver to use:
-
Derby -
Oracle -
SQL Server 2005 -
Other
URLSpecify the database connection URL appropriate for your database. This URL includes the name of the database, the host and port of the computer on which the database server is running, and so on
User NameSpecify database user account name that you want to use for each connection in the data source.
PasswordSpecify database user password that you want to use for each connection in the data source
Use XASpecify whether or not to use distributed transactions:
-
true: enable distributed transactions. -
false: disable distributed transactions.
-
-
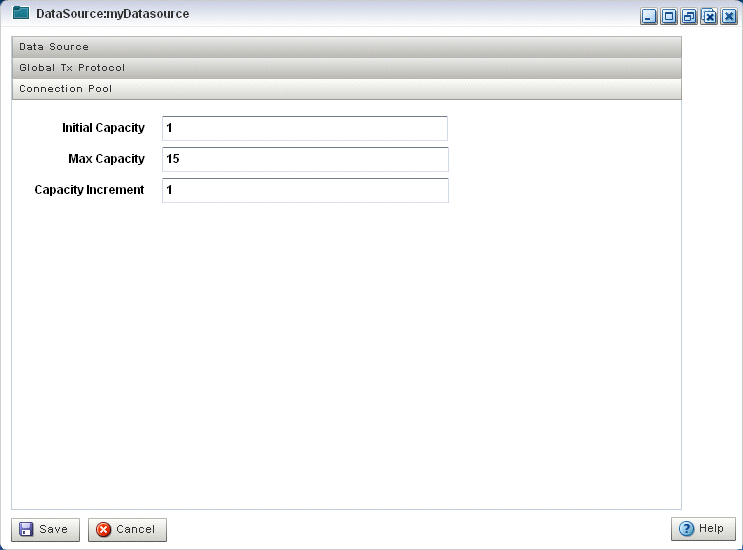
Click the Connection Pool tab.
The Connection Pool tab appears as Figure 3-11 shows.
Figure 3-11 Edit Datasource: Connection Pool Tab
Description of "Figure 3-11 Edit Datasource: Connection Pool Tab"
-
Configure the Connection Pool tab as Table 3-6 describes.
Table 3-6 Edit Datasource: Connection Pool Parameters
Parameter Description Initial CapacitySpecify the number of physical connections to create when creating the connection pool.
Max CapacitySpecify the maximum number of physical connections that this connection pool can contain.
Capacity IncrementSpecify how many connections to add when all the connections in the connection pool are in use and the connection pool receives a new connection request.
-
Click Save.
The datasource is updated in the Oracle CEP server configuration.
3.5 Managing HTTP Publish-Subscribe Server Channels
This section describes:
-
Section 3.5.1, "How to View HTTP Publish-Subscribe Server Channels"
-
Section 3.5.2, "How to Add an HTTP Publish-Subscribe Server Channel"
-
Section 3.5.3, "How to Delete an HTTP Publish-Subscribe Server Channel"
-
Section 3.5.4, "How to View Messages Published to HTTP Publish-Subscribe Server Channels"
For more information, see Section 3.1.4, "HTTP Publish-Subscribe Server".
3.5.1 How to View HTTP Publish-Subscribe Server Channels
Using the Oracle CEP Visualizer, you can view the HTTP publish-subscribe server channels currently open on the Oracle CEP server, including:
-
Static channels: those channels configured in the Oracle CEP server
config.xmland used by Oracle CEP Visualizer itself. -
Dynamic channels: those channels that are not configured in the Oracle CEP server
config.xmlbut created dynamically when the Oracle CEP sever is running. You can view statistics for dynamic channels, including the number of messages sent to this channel and the number of subscribers. Dynamic channel configuration is read-only. -
User-defined channels.
Note:
When one application (application-1) advertises a channel that a second application (application-2) subscribes to and uses as a foreign stage, you cannot view the details of the advertised channel from application-2. To view the details of this channel, you must do so from application-1.To view HTTP publish-subscribe server channels:
-
Be sure you log on to Oracle CEP Visualizer using an administration user.
For more information, see:
-
"Configuring Security for Oracle CEP" in the Oracle CEP Administrator's Guide.
-
-
In the left pane, click the Domain > Server > Services > Http Pub/Sub Server node, where Domain refers to the name of your Oracle CEP domain and Server refers to the name of the server instance.
A table appears in the right pane with the list of HTTP pub-sub servers configured for Oracle CEP.
-
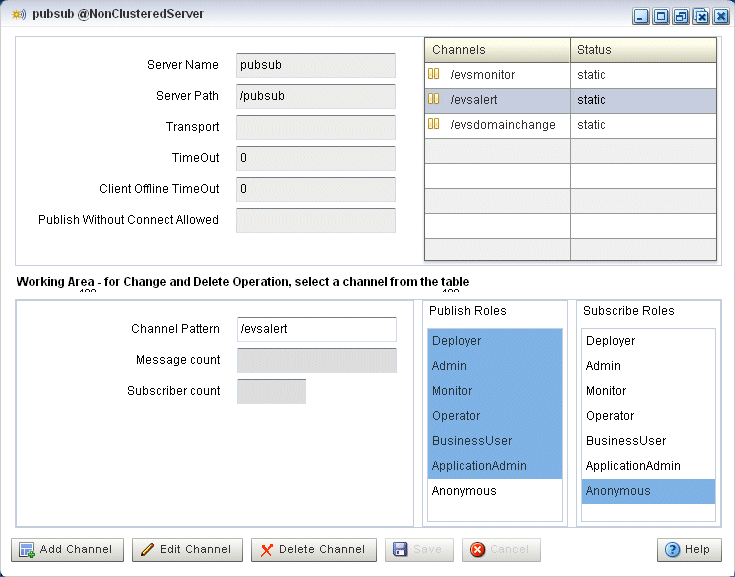
In the right pane, click the name of the HTTP pub-sub server in the table. The default server is called
pubsub.The HTTP publish-subscribe server properties dialog appears as Figure 3-12 shows.
Figure 3-12 HTTP Publish-Subscribe Server Channel List
Description of "Figure 3-12 HTTP Publish-Subscribe Server Channel List"
All active channels are shown in the Channels table. The Status column indicates the type of channel: static, dynamic, or user-defined.
3.5.2 How to Add an HTTP Publish-Subscribe Server Channel
Using the Oracle CEP Visualizer, you can add an HTTP publish-subscribe server channel.
To add an HTTP publish-subscribe server channel:
-
Be sure you log on to Oracle CEP Visualizer using an administration user.
For more information, see:
-
"Configuring Security for Oracle CEP" in the Oracle CEP Administrator's Guide.
-
-
In the left pane, click the Domain > Server > Services > Http Pub/Sub Server node, where Domain refers to the name of your Oracle CEP domain and Server refers to the name of the server instance.
A table appears in the right pane with the list of HTTP pub-sub servers configured for Oracle CEP.
-
In the right pane, click the name of the HTTP pub-sub server in the table. The default server is called
pubsub. -
In the working area towards the bottom of the right pane, enter the name of the new channel in the Channel Pattern text box.
The channel must start with a
/, such as/mychannel. -
If you have security enabled, select the security roles that are allowed to publish and subscribe to the channel.
Select more than one by holding down the Ctrl key.
-
Click the Add Channel.
The new channel appears in the Channels table at the top right of the pane.
3.5.3 How to Delete an HTTP Publish-Subscribe Server Channel
Using the Oracle CEP Visualizer, you can add an HTTP publish-subscribe server channel.
To delete an HTTP publish-subscribe server channel:
-
Be sure you log on to Oracle CEP Visualizer using an administration user.
For more information, see:
-
"Configuring Security for Oracle CEP" in the Oracle CEP Administrator's Guide.
-
-
In the left pane, click the Domain > Server > Services > Http Pub/Sub server node, where Domain refers to the name of your Oracle CEP domain and Server refers to the name of the server instance.
A table appears in the right pane with the list of HTTP pub-sub servers configured for Oracle CEP.
-
In the right pane, click the name of the HTTP pub-sub server in the table. The default server is called
pubsub. -
In the Channels table, click the name of the channel you want to delete.
-
Click Delete Channel at the bottom of the pane.
3.5.4 How to View Messages Published to HTTP Publish-Subscribe Server Channels
Oracle CEP includes an HTTP publish-subscribe server to which applications can publish messages. Applications publish messages to a particular channel; other applications can then subscribe to this channel to receive these published messages.
You can use Oracle CEP Visualizer to view the messages that are currently being published to a channel, including:
-
Static channels: those channels configured in the Oracle CEP server
config.xmland used by Oracle CEP Visualizer itself. -
Dynamic channels: those channels that are not configured in the Oracle CEP server
config.xmlbut created dynamically when the Oracle CEP sever is running. You can view statistics for dynamic channels, including the number of messages sent to this channel and the number of subscribers. Dynamic channel configuration is read-only. -
User-defined channels.
Note:
When one application (application-1) advertises a channel that a second application (application-2) subscribes to and uses as a foreign stage, you cannot view the details of the advertised channel from application-2. To view the details of this channel, you must do so from application-1.For more information, see:
-
Section 3.5.1, "How to View HTTP Publish-Subscribe Server Channels"
-
"Event Record and Playback Example" in the Oracle CEP Getting Started
To view messages published to HTTP publish-subscribe server channels:
-
In the top pane, click Viewstream.
-
In the right pane, click Initialize Client.
-
In the Subscribe Channel text box, enter the name of the channel to which the Oracle CEP server is publishing messages.
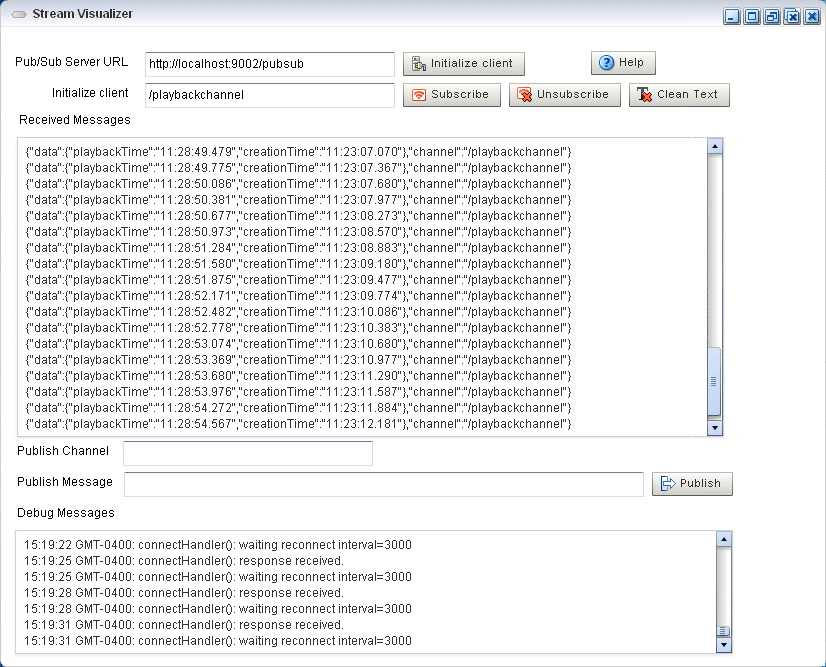
For example, in the Record and Playback example, included in the Oracle CEP installation, the HTTP pub-sub adapter publishes to a channel called
/playbackchannel. -
Click Subscribe.
The Received Messages text box displays events being published to the channel as Figure 3-13 shows.
Note:
If the Oracle CEP Visualizer fails to subscribe to the channel and displays an error in the Debug Messages area such as:14:25:54 GMT-0400: httpFaultHandler(): [RPC Fault faultString="Error #2096" faultCode="InvokeFailed" faultDetail="null"]
Then, confirm the following:
-
Have you met the Oracle CEP Visualizer Adobe Flash and browser prequisites? See Section 1.2.1, "Prerequisites".
-
Did you enter the correct channel name? See Section 3.5.1, "How to View HTTP Publish-Subscribe Server Channels".
-
-
To unsubscribe to the channel, click Unsubscribe.
3.6 Managing the Event Type Repository
This section describes:
For more information, see Section 3.1.5, "Event Type Repository".
3.6.1 How to View the Event Type Repository
Using the Oracle CEP Visualizer, you can view the event type repository.
To view the event type repository:
-
In the left pane, click Domain > Server > Services > Event Type Repository, where Domain refers to the name of your Oracle CEP domain and Server refers to the name of the server instance.
The right pane displays the Event Name table that lists all the event types used by the applications of the server.
-
In the right pane, click the name of an event in the Event Name table. The text box at the bottom displays the properties of the event type. For example, a simple
Nameevent type that has three properties,firstandlastwhich areStringsandagewhich is an integer, might look like:{first=java.lang.String, last=java.lang.String, age=int}
3.6.2 How to Configure the Event Type Repository
You can only view the event type repository, along with the its event types, configured for an Oracle CEP server using Oracle CEP Visualizer.
For details, see "Creating Oracle CEP Event Types" in the Oracle CEP IDE Developer's Guide for Eclipse.
3.7 Managing the Persistent Event Store
This section describes:
For more information, see Section 3.1.6, "Persistent Event Store".
3.7.1 How to View the Persistent Event Store
Using the Oracle CEP Visualizer, you can view the persistent event store.
To view the persistent event store:
-
In the left pane, click Domain > Server > Services > Event Repository, where Domain refers to the name of your Oracle CEP domain and Server refers to the name of the server instance.
-
The right pane shows the event stores that have been configured. In particular:
-
RDBMS Provider Name displays the name of the store provider
-
Data Source displays the JDBC data source associated with the provider.
-
3.7.2 How to Configure the Persistent Event Store
You can only view the event store configured for an Oracle CEP server using Oracle CEP Visualizer. To change the configuration, you must manually update the server's config.xml file.
For details, see "Storing Events in the Persistent Event Store" in the Oracle CEP IDE Developer's Guide for Eclipse.
3.8 Managing Multi-Server Domains
This section describes:
-
Section 3.8.3, "How to View Oracle Coherence Cluster Topologies"
-
Section 3.8.4, "How to Monitor Nodes in an Oracle Coherence Cluster"
For more information, see:
3.8.1 How to View Cluster Group Membership
You can view the default and user-defined cluster groups, what servers belong to those groups, and what applications are deployed to those groups.
By default, there is a group for each server with the same name as the server and a group named AllDomainMembers which represents all the servers in the domain. In addition, you can define custom groups when you configure your cluster.
You may deploy an application to a cluster group or to an individual server. When you deploy to a cluster group, the application belongs to the group, not the individual servers in the group. When you deploy to an individual server, the application belongs to the server's own group.
For more information, see
-
Section 2.3.2, "Deploying an Application in a Multi-Server Domain"
-
"Groups" in the Oracle CEP Administrator's Guide
To view cluster group membership:
-
In the left pane, click the Domain node, where Domain refers to the name of your Oracle CEP domain.
-
In the right pane, click the Cluster Groups/Server tab.
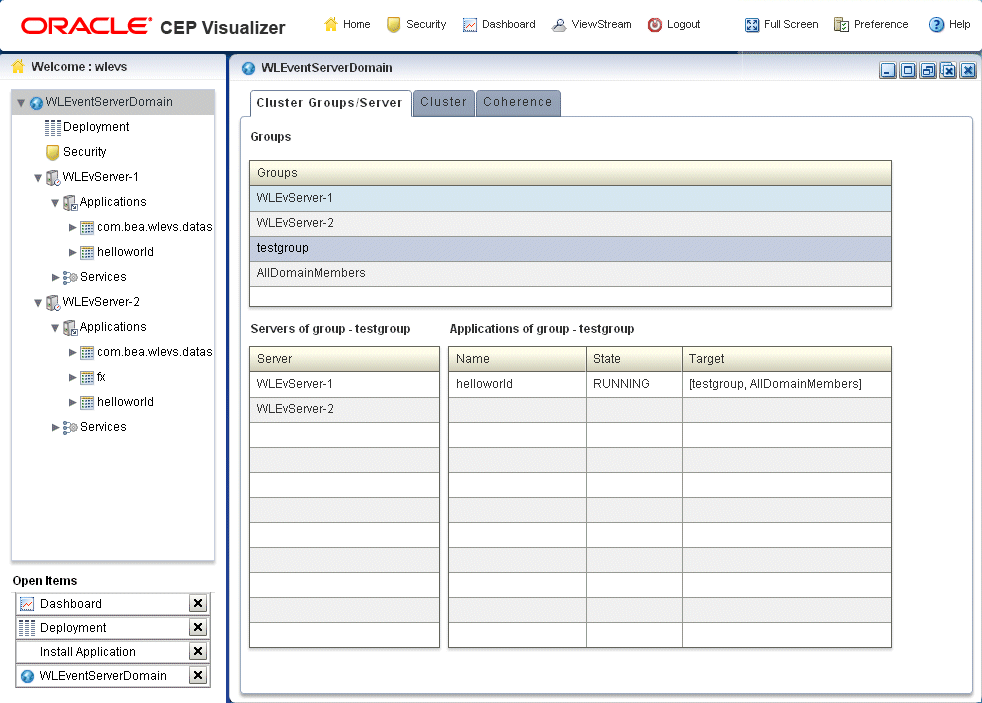
The Cluster Groups/Server tab appears as Figure 3-14 shows.
-
Use the Cluster Groups/Server tab to examine the server and application contents of various cluster groups.
For example:
-
Group
testgroupcontains two servers (WLEvServer-1andWLEvServer-2) and one application (helloworld) as Figure 3-14 shows. -
Group
WLEvServer-1contains one server (WLEvServer-1) and no applications. Thehelloworldapplication listed under itsApplicationsnode belongs to grouptestgroup, not to serverWLEvServer-1. -
Group
WLEvServer-2contains one server (WLEvServer-2) and one application (fx). Thefxapplication was deployed to serverWLEvServer-2. Thehelloworldapplication listed under itsApplicationsnode belongs to grouptestgroup, not to serverWLEvServer-2.
-
3.8.2 How to View all Cluster Topologies
Using Oracle CEP Visualizer, you can view all cluster topologies regardless of cluster implementation. You can also view cluster group properties and server instance properties.
If you are using Oracle Coherence for clustering, you can view Oracle Coherence topologies exclusively. For more information, see Section 3.8.3, "How to View Oracle Coherence Cluster Topologies".
To view all cluster topologies:
-
In the left pane, click the Domain node, where Domain refers to the name of your Oracle CEP domain.
-
In the right pane, click the Cluster tab.
-
In the right pane, click the Topology tab.
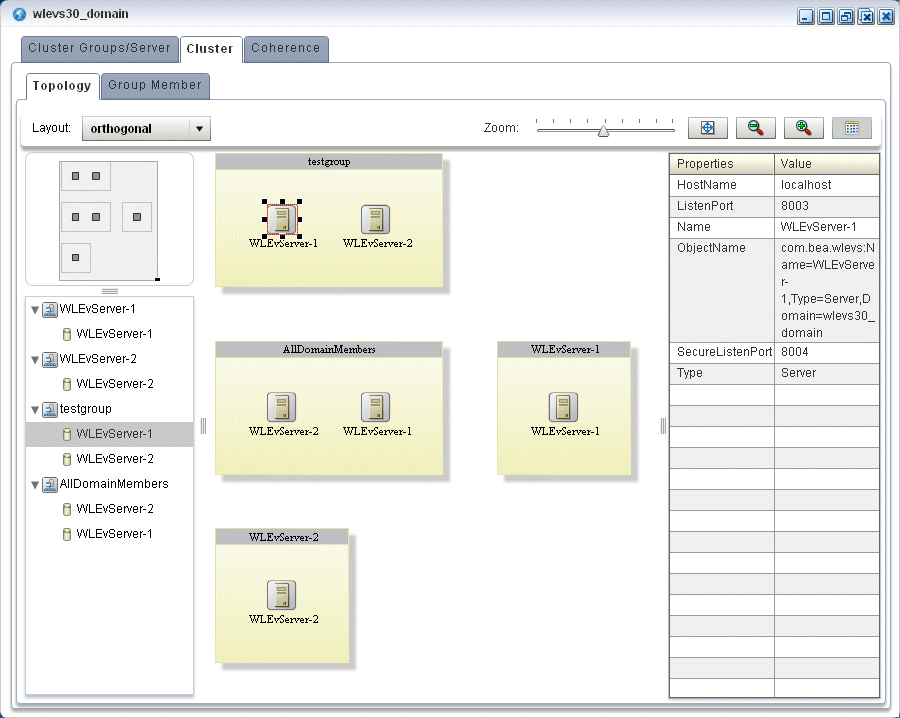
The Topology tab appears as Figure 3-15 shows.
This tab shows all cluster groups regardless of the cluster implementation.
For information on the various tools along the top of the topology canvas, see Section 3.8.7, "Managing the Cluster Topology Diagram".
-
To view the properties for a given group, click on the group in the Group List.
-
To view the properties for a given server instance, click on the server instance in the Group List.
-
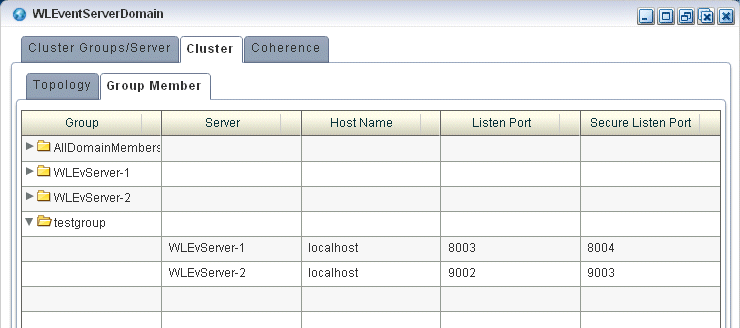
To view details on a given server instance, click the Group Member tab and select the server instance as Figure 3-16 shows.
-
Use the Group Member tab to customize the group table:
-
To change the order of columns, click on the column name in the cache chart and drag left or right.
-
To change the sort order of a column, click the triangle to the right of the column name in the cache chart.
-
3.8.3 How to View Oracle Coherence Cluster Topologies
Using Oracle CEP Visualizer, if you are using Oracle Coherence clustering, you can view Oracle Coherence cluster topologies, cluster group properties, and server instance properties.
To view all clustering topologies regardless of clustering implementation, see Section 3.8.2, "How to View all Cluster Topologies".
To view Oracle Coherence cluster topologies:
-
In the left pane, click the Domain node, where Domain refers to the name of your Oracle CEP domain.
-
In the right pane, click the Coherence tab.
-
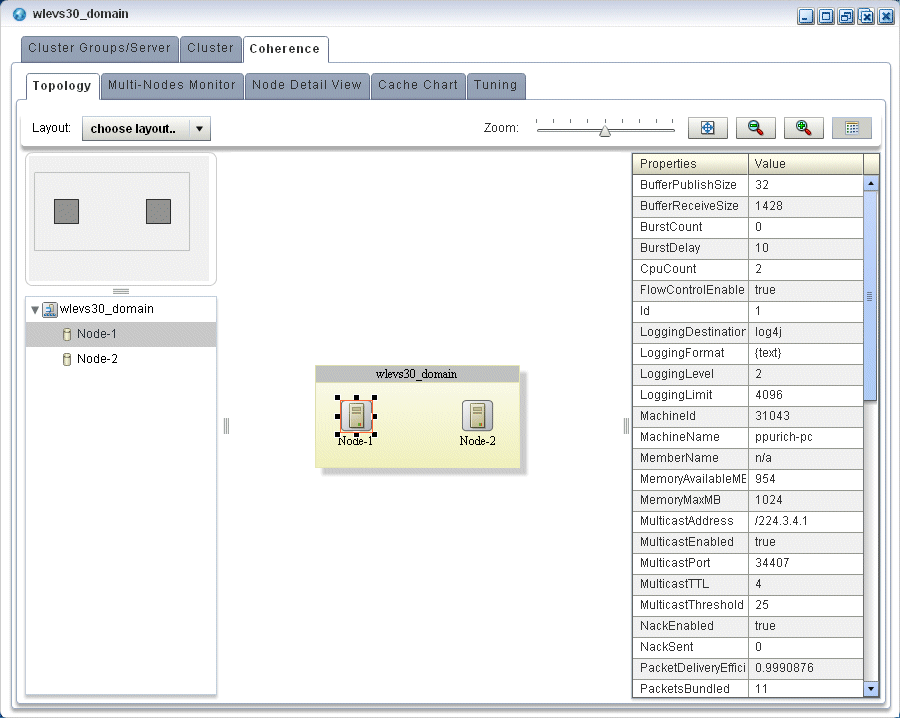
In the right pane, click the Topology tab.
The Topology tab appears as Figure 3-17 shows.
Figure 3-17 Oracle Coherence Cluster Topology Tab
Description of "Figure 3-17 Oracle Coherence Cluster Topology Tab"
This tab shows all cluster groups that the Oracle Coherence clustering implementation manages.
For information on the various tools along the top of the topology canvas, see Section 3.8.7, "Managing the Cluster Topology Diagram".
-
To view the properties for a given group, click on the group in the Group List.
-
To view the properties for a given server instance, click on the server instance in the Group List.
3.8.4 How to Monitor Nodes in an Oracle Coherence Cluster
Using Oracle CEP Visualizer, you can compare a combination of properties for any and all nodes in an Oracle Coherence cluster. For a selected node in an Oracle Coherence cluster, you can view a select list of properties.
Once you have determined the root cause of a problem, you can tune Oracle Coherence parameters to correct the problem. For more information, see Section 3.8.6, "How to Tune Oracle Coherence".
To monitor nodes in an Oracle Coherence cluster:
-
In the left pane, click the Domain node, where Domain refers to the name of your Oracle CEP domain.
-
In the right pane, click the Coherence tab.
-
In the right pane, click the Multi-Nodes Monitor tab.
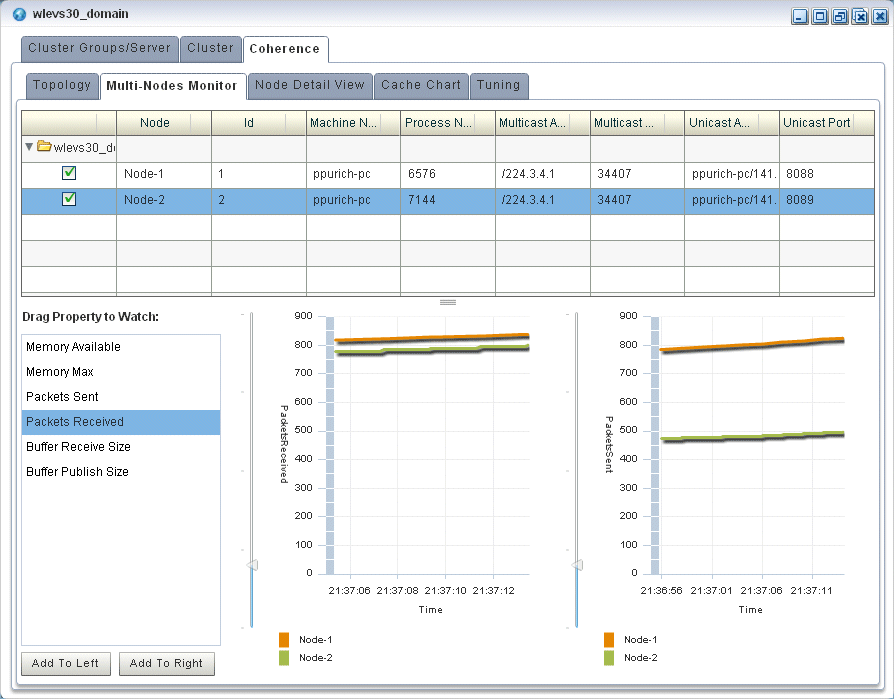
The Multi-Nodes Monitor tab appears as Figure 3-14 shows.
-
Use the Multi-Nodes Monitor tab to customize the group table:
-
To change the order of columns, click on the column name in the cache chart and drag left or right.
-
To change the sort order of a column, click the triangle to the right of the column name in the cache chart.
-
-
Use the Multi-Nodes Monitor tab to compare any combination of the properties that Table 3-7 lists for any nodes in an Oracle Coherence cluster:
-
Expand a group and check one or more nodes.
-
Drag a property from the Drag Property to Watch area to either graph to watch that property or, select a property and click Add to Left or Add to Right.
You may specify at most one property per graph.
-
A line is drawn for each selected node. The legend below the graph distinguishes graph data for each selected node by color.
-
To watch a different property, drag a new property and drop it onto the graph or, select a new property and click Add to Left or Add to Right.
-
To change the scale of a graph, drag the slider next to the vertical axis.
Table 3-7 Properties You Can Watch on the Multi-Nodes Monitor Tab
Property Description Memory AvailableThe total amount of free memory (in MB) for the selected node.
Memory MaxThe total amount of memory available (in MB) for the selected node.
Packets SentThe total number of Oracle Coherence packets sent by the selected node.
Packets ReceivedThe total number of Oracle Coherence packets received by the selected node.
Buffer Receive SizeThe total number of Oracle Coherence received packets that the selected node can buffer.
Buffer Publish SizeThe total number of Oracle Coherence published packets that the selected node can buffer.
-
-
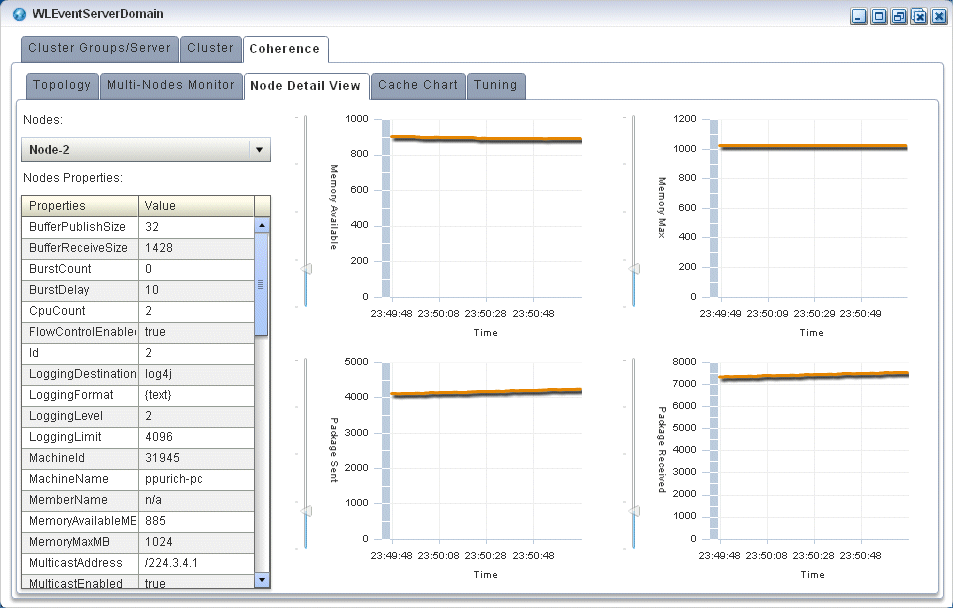
To view more details for a particular node, click the Node Detail View tab.
The Node Detail View tab appears as Figure 3-19 shows.
-
Use the Node Detail View tab to compare the properties that Table 3-8 lists for a selected node:
-
Select a node from the Nodes pull-down menu.
The properties for the selected node are shown in the Nodes Properties list.
-
A line is drawn for the selected node.
-
To change the scale of a graph, drag the slider next to the vertical axis.
Table 3-8 Properties You Can Watch on the Node Detail View Tab
Property Description Memory AvailableThe total amount of free memory (in MB) for the selected node.
Memory MaxThe total amount of memory available (in MB) for the selected node.
Packets SentThe total number of Oracle Coherence packets sent by the selected node.
Packets ReceivedThe total number of Oracle Coherence packets received by the selected node.
-
3.8.5 How to Monitor an Oracle Coherence Cache
Using Oracle CEP Visualizer, you can monitor a wide variety of Oracle Coherence cache parameters and graphically compare parameter values to locate and diagnose performance and operational problems.
Once you have determined the root cause of a problem, you can tune Oracle Coherence parameters to correct the problem. For more information, see Section 3.8.6, "How to Tune Oracle Coherence".
To monitor an Oracle Coherence Cache:
-
In the left pane, click the Domain node, where Domain refers to the name of your Oracle CEP domain.
-
In the right pane, click the Coherence tab.
-
In the right pane, click the Cache Chart tab.
The Multi-Nodes Monitor tab appears as Figure 3-14 shows.
-
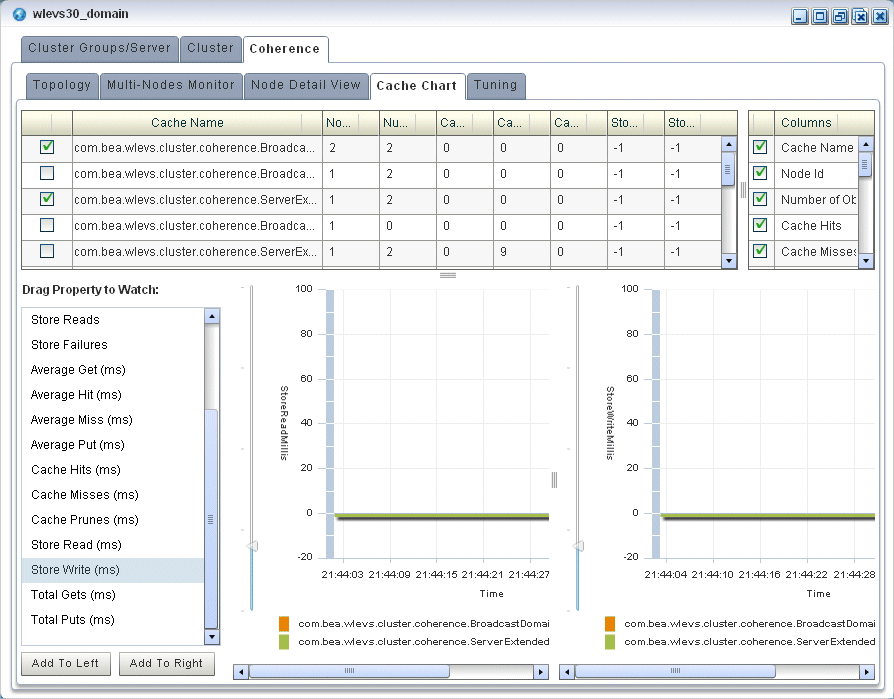
Use the Cache Chart tab to view any combination of the columns that Table 3-9 lists for one or more selected caches:
-
Check one or more caches in the cache chart.
-
To add a column to the cache chart, check the column in the Columns list.
-
To remove a column from the cache chart, uncheck the column in the Columns list.
-
To change the order of columns, click on the column name in the cache chart and drag left or right.
-
To change the sort order of a column, click the triangle to the right of the column name in the cache chart.
Table 3-9 Columns and Properties for the Cache Chart Tab
Property Description Cache NameThe name of the cache.
# of ObjectsThe total number of objects in the selected cache.
Cache HitsThe total number times an Oracle Coherence cache client has accessed the selected cache.
Cache MissesThe total number times an Oracle Coherence cache client has accessed the selected cache and failed to find the desired object.
Cache PrunesThe total number times Oracle Coherence has reached its maximum size and had to delete some objects to return to a configured smaller size for the selected cache.
Store WritesThe total number of times Oracle Coherence has written to the selected cache's backing store.
Store ReadsThe total number of times Oracle Coherence has read from the selected cache's backing store.
Node IdThe node identifier for the selected cache.
Store FailuresThe total number of times the selected cache's backing store has failed to service an Oracle Coherence Store Write or Store Read.
Average Hit MillisThe average time (in milliseconds) taken by Oracle Coherence to find an object in the selected cache.
Average Get MillisThe average time (in milliseconds) taken by Oracle Coherence to retrieve an object from the selected cache.
Average Miss MillisThe average time (in milliseconds) taken by Oracle Coherence to determine that an object does not exist in the selected cache.
Average Put MillisThe average time (in milliseconds) taken by Oracle Coherence to add a new object to the selected cache.
Cache Hits MillisThe total time (in milliseconds) taken by Oracle Coherence to find an object in the selected cache.
Cache Misses MillisThe total time (in milliseconds) taken by Oracle Coherence to determine that an object does not exist in the selected cache.
Cache Prunes MillisThe total time (in milliseconds) taken by Oracle Coherence to delete some objects from the selected cache to return to a configured smaller size after having reached its maximum size.
Store Read MillisThe total time (in milliseconds) taken by Oracle Coherence to read from the selected cache's backing store.
Store Write MillisThe total time (in milliseconds) taken by Oracle Coherence to write to the selected cache's backing store.
Total Gets MillisThe total time (in milliseconds) taken by Oracle Coherence to retrieve objects from the selected cache.
Total Puts MillisThe total time (in milliseconds) taken by Oracle Coherence to add new objects to the selected cache.
-
-
Use the Cache Chart tab to compare any combination of the properties that Table 3-9 lists for one or more selected caches:
-
Check one or more caches in the cache chart.
-
Drag a property from the Drag Property to Watch area to either graph to watch that property or, select the property and click Add to Left or Add to Right.
You may specify at most one property per graph.
-
A line is drawn for each selected cache. The legend below the graph distinguishes graph data for each selected cache by color.
-
To watch a different property, drag the new property and drop it onto the graph or, select a different property and click Add to Left or Add to Right.
-
To change the scale of a graph, drag the slider next to the vertical axis.
-
3.8.6 How to Tune Oracle Coherence
Using Oracle CEP Visualizer, you can view and modify a variety of Oracle Coherence parameters to fine tune Oracle Coherence performance.
Note:
Not all Oracle Coherence parameters can be modified. For more information, refer to your Oracle Coherence documentation.To determine the root cause of a problem, you can monitor Oracle Coherence parameters. For more information, see:
-
In the left pane, click the Domain node, where Domain refers to the name of your Oracle CEP domain.
-
In the right pane, click the Coherence tab.
-
In the right pane, click the Tuning tab.
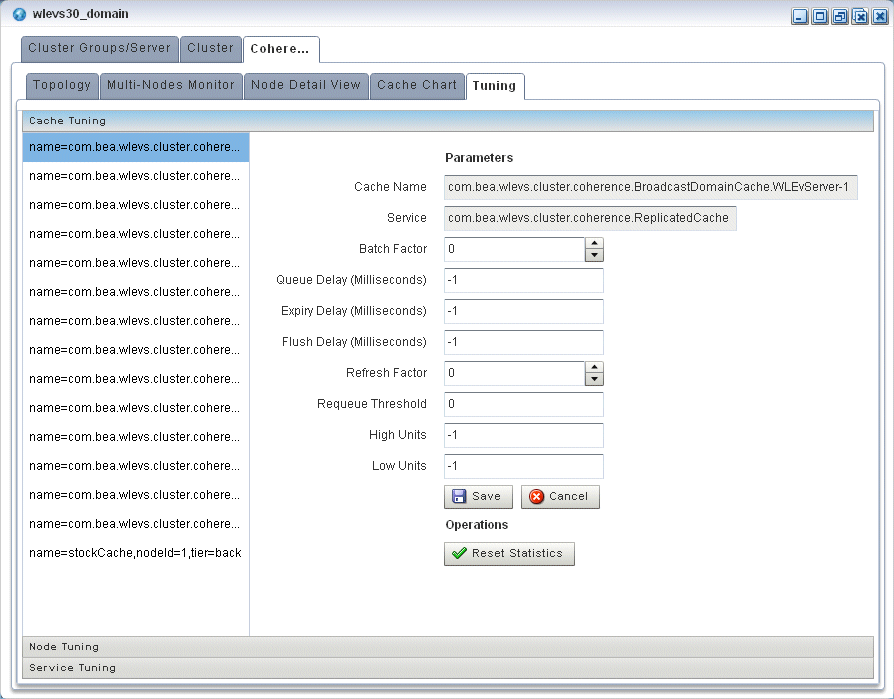
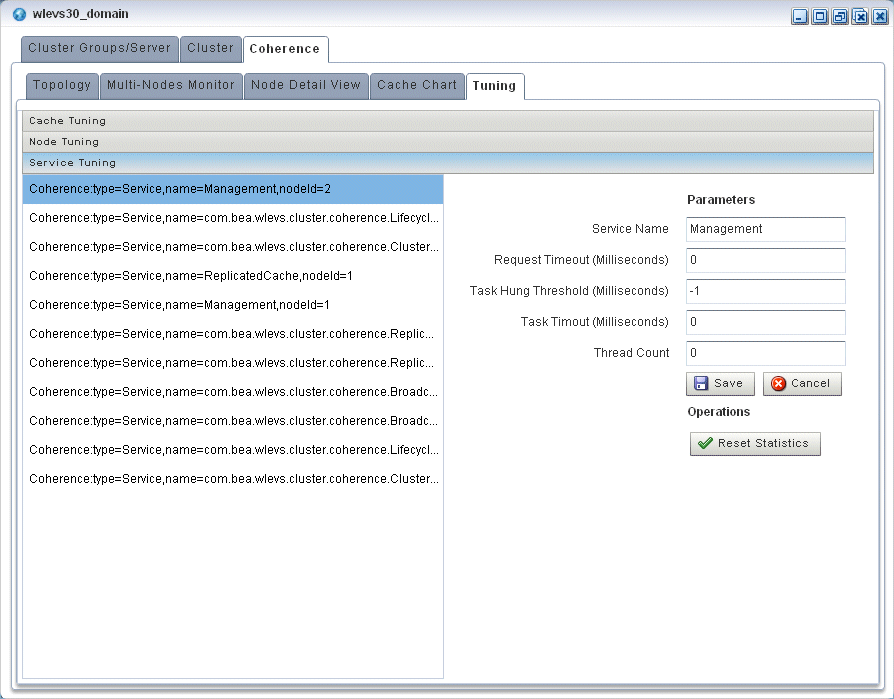
The Tuning tab appears as Figure 3-21 shows.
-
To tune parameters and invoke operations for caches, select the Cache Tuning accordion tab and select a cache as Figure 3-21 shows.
Table 3-10 lists the properties you can view and tune for the selected cache. All properties are based on Oracle Coherence
http://download.oracle.com/otn_hosted_doc/coherence/340/com/tangosol/net/management/Registry.html.Table 3-10 Cache Tuning: Properties
Property Description Cache NameThe name of the selected cache (read-only).
ServiceThe service associated with this cache (read-only).
Batch FactorThe
BatchFactorattribute is used to calculate the `soft-ripe` time for write-behind queue entries. A queue entry is considered to be `ripe` for a write operation if it has been in the write-behind queue for no less than theQueueDelayinterval. The `soft-ripe` time is the point in time prior to the actual `ripe` time after which an entry will be included in a batched asynchronous write operation to theCacheStore(along with all other `ripe` and `soft-ripe` entries). This attribute is only applicable if asynchronous writes are enabled (that is, the value of theQueueDelayattribute is greater than zero) and theCacheStoreimplements thestoreAll()method. The value of the element is expressed as a percentage of theQueueDelayinterval.Valid values are doubles in the interval [0.0, 1.0]..
Queue Delay (Milliseconds)The number of seconds that an entry added to a write-behind queue will sit in the queue before being stored via a
CacheStore. Applicable only forWRITE-BEHINDpersistence type.Expiry Delay (Milliseconds)The number of milliseconds that the MBeanServer will keep a remote model snapshot before refreshing.
Flush Delay (Milliseconds)The number of milliseconds between cache flushes. Value of zero indicates that the cache will never flush.
Refresh FactorThe
RefreshFactorattribute is used to calculate the `soft-expiration` time for cache entries. Soft-expiration is the point in time prior to the actual expiration after which any access request for an entry will schedule an asynchronous load request for the entry. This attribute is only applicable for aReadWriteBackingMapwhich has an internalLocalCachewith scheduled automatic expiration. The value of this element is expressed as a percentage of the internalLocalCacheexpiration interval.Valid values are doubles in the interval[0.0, 1.0]. If zero, refresh-ahead scheduling will be disabled.
Requeue ThresholdThe maximum size of the write-behind queue for which failed
CacheStorewrite operations are requeued. If zero, the write-behind requeueing will be disabled. Applicable only forWRITE-BEHINDpersistence type.High UnitsThe limit of the cache size measured in units. The cache will prune itself automatically once it reaches its maximum unit level. This is often referred to as the `high water mark` of the cache.
Low UnitsThe number of units to which the cache will shrink when it prunes. This is often referred to as a `low water mark` of the cache.
To apply changes, click the Save button.
To discard changes, click the Cancel button.
Table 3-11 lists the operations you can invoke for the selected cache.
-
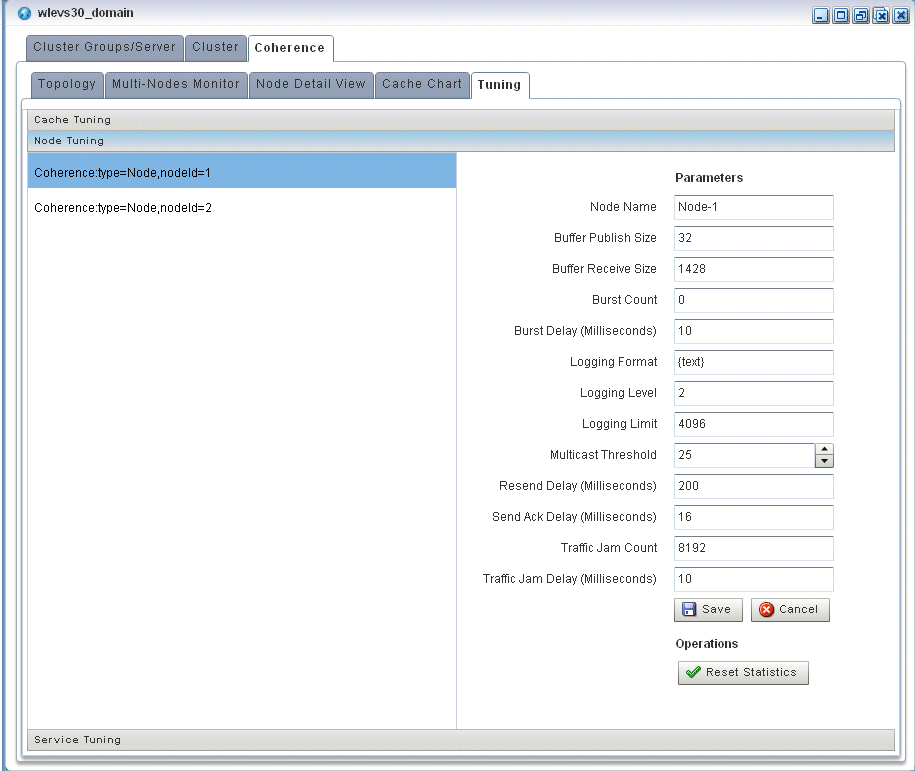
To tune parameters and invoke operations for cluster nodes, select the Node Tuning accordion tab and select a node as Figure 3-22 shows.
Table 3-10 lists the properties you can view and tune for the selected cache. All properties are based on Oracle Coherence
http://download.oracle.com/otn_hosted_doc/coherence/340/com/tangosol/net/management/Registry.html.Table 3-12 Node Tuning: Properties
Property Description Node NameThe name of the selected node (read-only).
Buffer Publish SizeThe buffer size of the unicast datagram socket used by the Publisher, measured in the number of packets.
Changing this value at runtime is an inherently unsafe operation that will pause all network communications and may result in the termination of all cluster services.
Buffer Receive SizeThe buffer size of the unicast datagram socket used by the Receiver, measured in the number of packets.
Changing this value at runtime is an inherently unsafe operation that will pause all network communications and may result in the termination of all cluster services.
Burst CountThe maximum number of packets to send without pausing. Anything less than one (for example, zero) means no limit.
Burst Delay (Milliseconds)The number of milliseconds to pause between bursts. Anything less than one (for example, zero) is treated as one millisecond.
Logging LevelSpecifies which logged messages will be output to the log destination.
Valid values are:
-
0 only output without a logging severity level specified will be logged
-
1 all the above plus errors
-
2 all the above plus warnings
-
3 all the above plus informational messages
-
4..9 all the above plus internal debugging messages (the higher the number, the more the messages)
-
-1 no messages
Logging FormatSpecifies how messages will be formatted before being passed to the log destination.
The value of the message-format element is static text with the following replaceable parameters:
-
{date}the date/time format (to a millisecond) at which the message was logged -
{version}the Oracle Coherence exact version and build details -
{level}the logging severity level of the message -
{thread}the thread name that logged the message -
{member}the cluster member id (if the cluster is currently running) -
{text}the text of the message
Logging LimitThe maximum number of characters that the logger daemon will process from the message queue before discarding all remaining messages in the queue. Valid values are integers in the range [0...]. Zero implies no limit.
Multicast ThresholdThe percentage (0 to 100) of the servers in the cluster that a packet will be sent to, above which the packet will be multicasted and below which it will be unicasted.
Resend Delay (Milliseconds)The minimum number of milliseconds that a packet will remain queued in the Publisher`s re-send queue before it is resent to the recipient(s) if the packet has not been acknowledged. Setting this value too low can overflow the network with unnecessary repetitions. Setting the value too high can increase the overall latency by delaying the re-sends of dropped packets. Additionally, change of this value may need to be accompanied by a change in
SendAckDelayvalue.Send Ack Delay (Milliseconds)The minimum number of milliseconds between the queueing of an Ack packet and the sending of the same. This value should be not more then a half of the
ResendDelayvalue.Traffic Jam CountThe maximum total number of packets in the send and resend queues that forces the publisher to pause client threads. Zero means no limit.
Traffic Jam Delay (Milliseconds)The number of milliseconds to pause client threads when a traffic jam condition has been reached. Anything less than one (for example, zero) is treated as one millisecond.
To apply changes, click the Save button.
To discard changes, click the Cancel button.
Table 3-11 lists the operations you can invoke for the selected node.
-
-
To tune parameters and invoke operations for nodes, select the Node Tuning accordion tab and select a node as Figure 3-22 shows.
Table 3-10 the properties you can view and tune for the selected cache. All properties are based on Oracle Coherence
http://download.oracle.com/otn_hosted_doc/coherence/340/com/tangosol/net/management/Registry.html.Table 3-14 Service Tuning: Properties
Property Description Service NameThe name of the selected service (read-only).
Request Timeout (Millis)The default timeout value in milliseconds for requests that can be timed-out (for example, implement the
com.tangosol.net.PriorityTaskinterface), but do not explicitly specify the request timeout value.Task Hung Threshold (Millis)The amount of time in milliseconds that a task can execute before it is considered hung. Note that a posted task that has not yet started is never considered as hung.
Task Timeout (Millis)The default timeout value in milliseconds for tasks that can be timed-out (for example, implement the
com.tangosol.net.PriorityTaskinterface), but do not explicitly specify the task execution timeout value.Thread CountThe number of threads in the service thread pool.
To apply changes, click the Save button.
To discard changes, click the Cancel button.
Table 3-11 lists the operations you can invoke for the selected service.
3.8.7 Managing the Cluster Topology Diagram
This section describes the various tools along the top of the Topology canvas as Figure 3-24 shows.
You use these tools to manage the topology diagram of your cluster topology.
3.8.7.1 Choose Layout
Use the Choose Layout pull-down menu to select alternate ways of distributing cluster groups. You can choose any of:
-
organic
-
hierarchic
-
orthogonal
3.8.7.2 Zoom
Use the Zoom slider to increase or decrease the zoom level. This is an alternative to using the Zoom In and Zoom Out buttons (see Section 3.8.7.4, "Zoom In and Zoom Out").
3.8.7.3 Fit Content
Click the Fit Content button to adjust the zoom level automatically to make all of the diagram visible in the current browser window.
3.8.7.4 Zoom In and Zoom Out
Click the Zoom In and Zoom Out buttons to change the zoom level. This is an alternative to using the Zoom slider (see Section 3.8.7.2, "Zoom").
3.8.7.5 Toggle Overview
Click the Toggle Overview button to alternately hide and show the overview diagram on the left.
3.9 Managing Logs
This section describes:
For more information, see Section 3.1.9, "Logs".
3.9.1 How to Configure the Oracle CEP Server Logging Service
Using the Oracle CEP Visualizer, you can configure the logging system of a selected Oracle CEP server. By default, this logging configuration applies to all components.
To configure component-specific logging options, see Section 3.9.2, "How to Configure a Component Logger".
To configure the Oracle CEP server logging service:
-
In the left pane, click the Domain > Server node, where Domain refers to the name of your Oracle CEP domain and Server refers to the name of the server instance.
-
In the right pane, click the Logging tab.
-
Click the Logging Services tab.
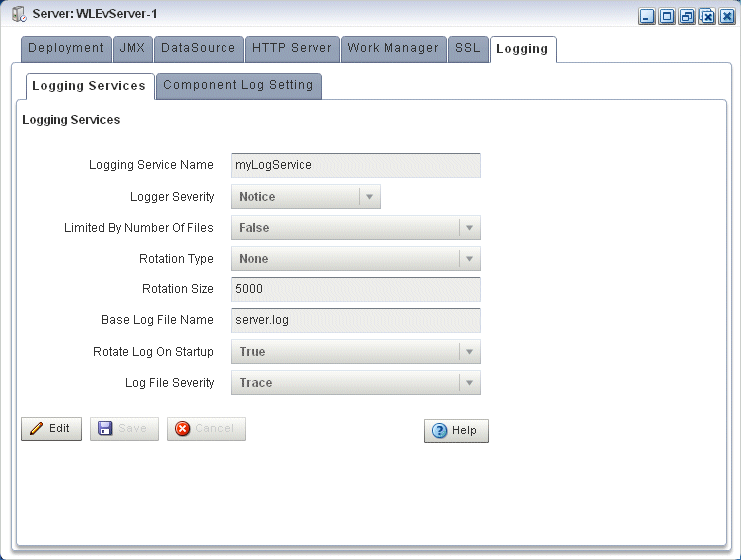
The Logging Services tab appears as Figure 3-25 shows.
-
Click Edit.
-
Edit the dialog as Table 3-16 describes.
Table 3-16 Logging Services Options
Attribute Description Logging Service NameSpecify the name of the logging service as the Oracle CEP server
config.xmlfile specifies.Logger SeveritySpecify the default log severity at which Oracle CEP server logs messages.
Limited By Number Of FilesSpecify whether or not to keep old log files indefinitely:
-
true: keep only the last 7 log files. -
false: keep all log files.
Rotation TypeSpecify when Oracle CEP server should close the existing log file and open a new one:
-
Size: Oracle CEP server closes the existing log file when it reaches the size (in KB) you enter in theRotation Sizefield. -
Time: Oracle CEP server closes the existing log file at the time you enter in the numeric entry field below the Rotation Type pull-down menu ink:mmformat, where k is the hour specified in 24 hour notation andmmis the minutes. Default-Value: 00:00. -
None: Oracle CEP server never closes the existing log file and allows it to grow to an unlimited size.
Rotation SizeWhen you specify
Rotation TypeasSize, enter the maximum log file size in KB.Base Log File NameThe name of the base log file.
Default:
server.log.Rotate Log On StartupSpecify whether or not Oracle CEP server closes the existing log file and creates a new one each time the Oracle CEP server starts up:
-
true: Oracle CEP server closes the existing log file and creates a new one each time the Oracle CEP server starts up. -
false: Oracle CEP server does not close the existing log file each time the Oracle CEP server starts up.
Log File Severity
Specify the default log file severity. Oracle CEP server (and, by default, all components), log messages at this severity:
-
Emergency -
Alert -
Critical -
Error -
Notice -
Info -
Debug -
Trace
-
-
Click the Save button to commit your changes.
3.9.2 How to Configure a Component Logger
Using the Oracle CEP Visualizer, you can configure the logging properties of a selected component. Table 3-17 lists the components that are configured to log at the Notice log level, by default.
This section describes how:
To configure logging properties that apply to all components, see Section 3.9.1, "How to Configure the Oracle CEP Server Logging Service".
-
In the left pane, click the Domain > Server node, where Domain refers to the name of your Oracle CEP domain and Server refers to the name of the server instance.
-
In the right pane, click the Logging tab.
-
Click the Component Log Setting tab.
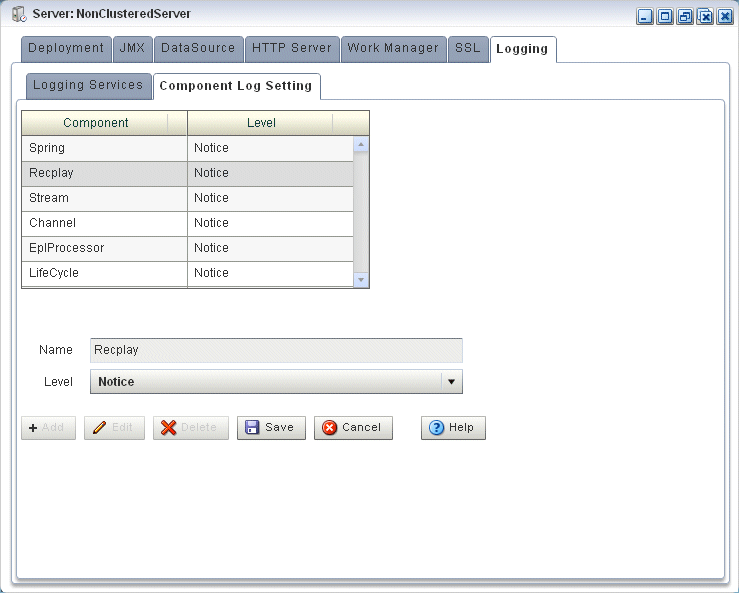
The Component Log Setting tab appears as Figure 3-26 show.
-
Click Add.
-
Enter the name of the component in the Name field.
You can choose any of the following:
-
Component name: a component name constant exactly as Table 3-17 lists.
Table 3-17 Logging Component Name Constants
Component Name Description AdaptersApplies to log messages from adapter instances running on the Oracle CEP server.
CacheApplies to log messages from caching systems and cache instances running on the Oracle CEP server.
ChannelApplies to log messages from channels running on the Oracle CEP server.
CQLProcessorApplies to log messages from Oracle CQL processors running on the Oracle CEP server.
EplProcessorApplies to log messages from EPL processors running on the Oracle CEP server.
EdeApplies to log messages from the Event-Driven Environment, the Oracle CEP server event-dispatching infrastructure.
EventTraceWhen set to
InfoorDebug, allows you to trace events as they flow through the EPN for all applications. You can dynamically change the severity of this log key using Oracle CEP Visualizer.At the
Infoseverity, you see log messages like:<May 26, 2009 5:53:49 PM PDT> <Info> <EventTrace> <BEA-000000> <Application [helloworld], Stage [helloworldOutputChannel] received insert event>
At the
Debugseverity, the log messages include details of the event:<May 26, 2009 6:02:34 PM PDT> <Debug> <EventTrace> <BEA-000000> <Application [helloworld], Stage [helloworldOutputChannel] received insert event [HelloWorldEvent: HelloWorld - the current time is: 6:02:34 PM]>
LifecycleApplies to log messages from Oracle CEP server and application lifecycle operations.
ManagementApplies to log messages from Oracle CEP server general JMX-related management API operations.
MonitorApplies to log messages from the Oracle CEP server monitoring service.
RecplayApplies to log messages from Oracle CEP server event recording and playback operations.
SpringApplies to log messages from Spring container operations.
StreamApplies to log messages from stream instances running on the Oracle CEP server.
-
Application name: the module name of any Oracle CEP server or user-defined application. For example:
sample.HelloWorld. -
Package name: the name of any Oracle CEP server or user-supplied Java package. For example:
com.bea.wlevs.ede.For more information on Oracle CEP server packages, see the Oracle CEP Java API Reference.
-
Class name: the fully qualified name of any Oracle CEP server or user-defined class. For example:
com.bea.wlevs.cep.core.EPRuntimeImpl.For more information on Oracle CEP server classes, see the Oracle CEP Java API Reference.
-
-
Select the severity level from the Level drop-down menu:
-
Emergency -
Alert -
Critical -
Error -
Notice -
Info -
Debug -
Trace
-
-
Click Save.
The component and the severity level is displayed in the table.
To change the logging level of a component:
-
In the left pane, click the Domain > Server node, where Domain refers to the name of your Oracle CEP domain and Server refers to the name of the server instance.
-
In the right pane, click the Logging tab.
-
Click the Component Log Setting tab.
The Component Log Setting tab appears as Figure 3-27 show.
-
Select the component entry in the table.
-
Click Edit.
-
Select the severity level from the Level drop-down menu:
-
Emergency -
Alert -
Critical -
Error -
Notice -
Info -
Debug -
Trace
-
-
Click Save.
The new severity level is displayed in the table.
-
In the left pane, click the Domain > Server node, where Domain refers to the name of your Oracle CEP domain and Server refers to the name of the server instance.
-
In the right pane, click the Logging tab.
-
Click the Component Log Setting tab.
The Component Log Setting tab appears as Figure 3-28 show.
-
Select the component entry in the table.
-
Click Delete.
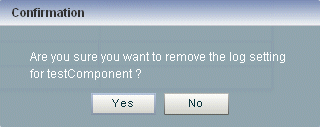
A confirmation dialog appears as Figure 3-29 shows.
Figure 3-29 Component Log Configuration Delete Confirmation
Description of "Figure 3-29 Component Log Configuration Delete Confirmation"
-
Click Yes.
The component logger is removed from the table.
3.9.3 How to Query Logs
Using the Oracle CEP Visualizer, you can run queries on the logs of a selected Oracle CEP server. The Query Logs feature allows you to view the information in the selected log files.
-
In the left pane, click the Domain > Server node, where Domain refers to the name of your Oracle CEP domain and Server refers to the name of the server instance.
-
Click Services and then click Log Query.
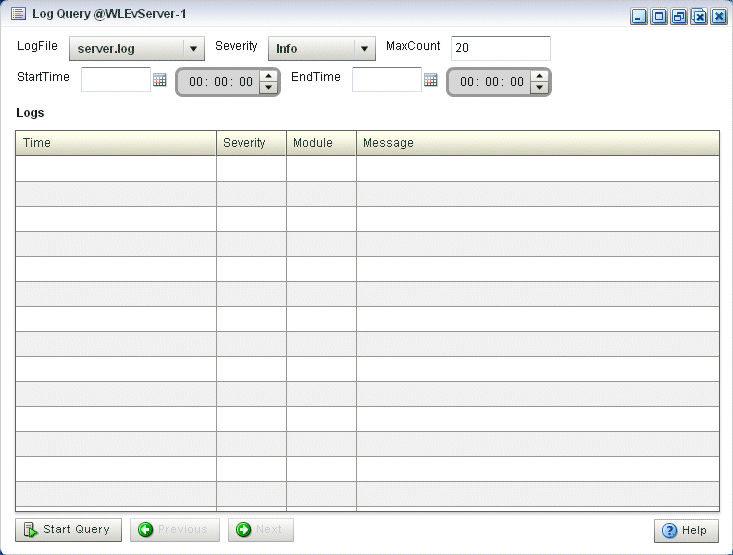
The Log Query screen is displayed, as shown in Figure 3-30.
-
Select the following options in the Log Query screen:
-
LogFile: Select the log file you want to query from the drop-down. -
Severity: Select the severity of the log file that you selected in the LogFile drop-down. -
MaxCount: Enter the maximum count of rows of log you wish to view for the selected log file. -
StartTime: Select the time when the query should start running. -
EndTime: Select the time when the query should stop.
-
-
Click Start Query.
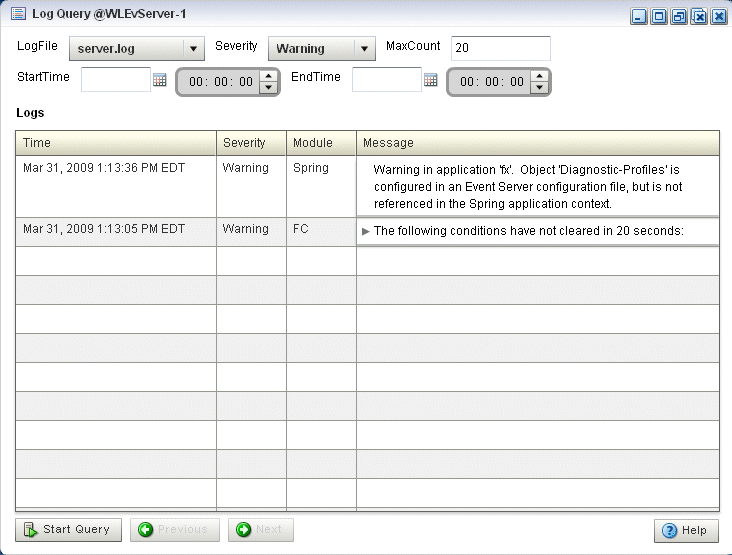
All the log messages that match your query criteria for the selected log file of the selected Oracle CEP Server are displayed in the Logs pane, as shown in Figure 3-31.
Figure 3-31 Log Query Screen - Logs Displayed
Description of "Figure 3-31 Log Query Screen - Logs Displayed"
-
If more messages are returned than can be displayed in the Logs pane, the Previous and Next buttons activate. Click the Previous and Next buttons to page through the messages.
3.9.4 How to View Console Output
Using the Oracle CEP Visualizer, you can view the console output of a selected Oracle CEP server.
-
In the left pane, click the Domain > Server node, where Domain refers to the name of your Oracle CEP domain and Server refers to the name of the server instance.
-
Click Services and then click Console Output.
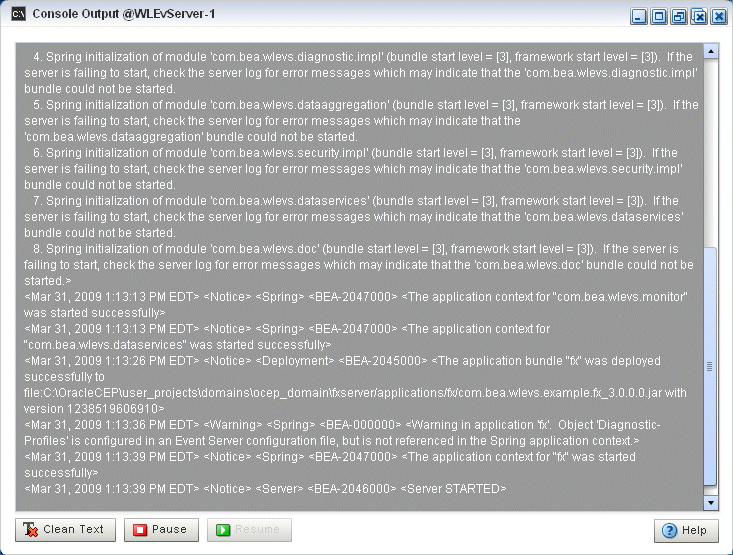
The Console Output screen is displayed, as shown in Figure 3-32.
Figure 3-32 Sample Console Output for HelloWorld Application
Description of "Figure 3-32 Sample Console Output for HelloWorld Application"
-
Click the Clean Text button to clear the text in the Console Output window.
-
Click the Pause button to pause the output of console messages.
-
Click the Resume button to resume the output of console messages.
