13 One View Reporting for Capital Asset Management
This chapter provides overview information, processing options, special processing, and reports for the following applications:
-
Section 13.2, "One View Equipment License/Permit Inquiry (P13500)"
-
Section 13.5, "One View Equipment Location Inquiry (P13230)"
13.1 One View Equipment Status Inquiry (P13400)
Access the One View Equipment Status Inquiry application (P13400) from the Equipment Information (G1311) menu. Use One View Equipment Status Inquiry to analyze the status history for your equipment for a specific status. One View Equipment Status Inquiry uses the F1201/F1217 Join for Equipment Information business view (V13400), which includes columns from the Asset Master table (F1201) and the Equipment Master Extension table (F1217). This application provides a wealth of data and is extremely flexible in the types of reports that can be generated. Choose from 63 columns in the business view, and numerous calculated columns in the grid related to status information to analyze the status history of your equipment. Along with some delivered reports, One View Equipment Status Inquiry can provide reports for many purposes. Some examples include analysis by Manufacturer, Parent Equipment, Product Model, and Product Family.
One View Equipment Status Inquiry is delivered with several pre-defined reports. These reports are Equipment Status Analysis by Manufacturer, Equipment Status Analysis by Parent Equipment, Equipment Status Analysis by Product Family, Equipment Status Analysis by Product Model, and Equipment Status Analysis. With these delivered reports, you can see an analysis of the history of your equipment for a specific status over a specified date range. Information analyzed for the date range includes the number of days equipment is at and not at the specified status, the percent of time spent at and not at that status, the number of times it was at and not at that status, the average number of days at and not at that status, the average number of days between that status (average days spent at a different status between the specified status, also referred to as mean time between status), and the average number of days to that status (the average number of days from the beginning of that status to the beginning of that status the next time).
13.1.2 Special Processing
When working with One View Equipment Status Inquiry, you must select a status to analyze.
The system uses the Date Range to locate status records within the time period specified. If you enter a date in the future as the Date Range end date, it will be assumed that the current status will continue to be the status through that date. If you leave the end date blank, the analysis will be through today's date.
The records that are populated in the grid are a summation of the status history records for each piece of equipment, for the status indicated in the Equipment Status to Analyze. There is one grid row per piece of equipment.
Status information is summarized from the records in the Status History table (F1307) with additional related information from the F1201 and F1217.
When calculating the number of days at a particular status, the equipment is considered at that status on the status history record's Begin Date but not on the status history record's End Date. (A piece of equipment cannot be at 2 different statuses on the same day.)
13.1.3 Reports
The reports delivered with the One View Equipment Status Inquiry application are:
-
Equipment Status Analysis by Product Family
-
Equipment Status Analysis by Manufacturer
-
Equipment Status Analysis by Parent Equipment
-
Equipment Status Analysis by Product Model
-
Equipment Status Analysis
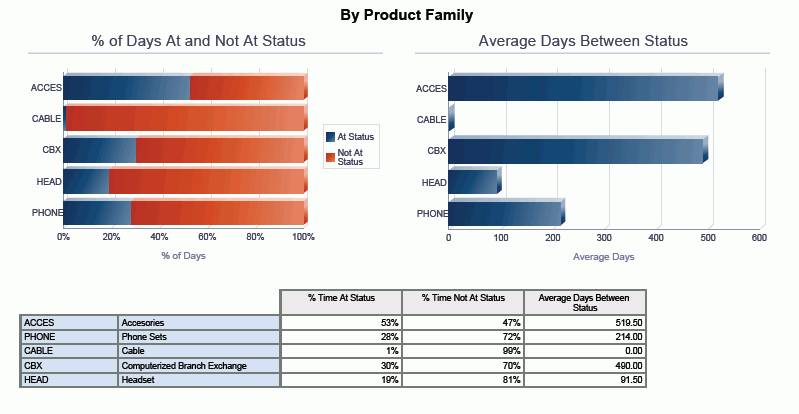
13.1.3.1 Equipment Status Analysis by Product Family
Use this report to analyze the status of equipment by product family so that different equipment product families can be compared to see if some are more reliable (Available status) than others. This is helpful when making purchase decisions.
This report contains the following components:
-
Average Days At and Not At Status (horizontal bar graph)
-
Percentage of Days At and Not At Status (horizontal bar graph)
-
Average Days Between Status (horizontal bar graph)
-
Average Days To Status (horizontal bar graph)
-
Summary by Product Family (table)
-
Details by Product Family (table)
The Details by Product Family table component contains drill back functionality as described in the following table:
| Functionality | Value |
|---|---|
| Table column containing drill back link | Equipment Number |
| Table columns passed to application | Equipment No |
| Application called | Equipment Master Revisions (P1702) |
| Form called | W1702A |
| Version called | ZJDE0001 |
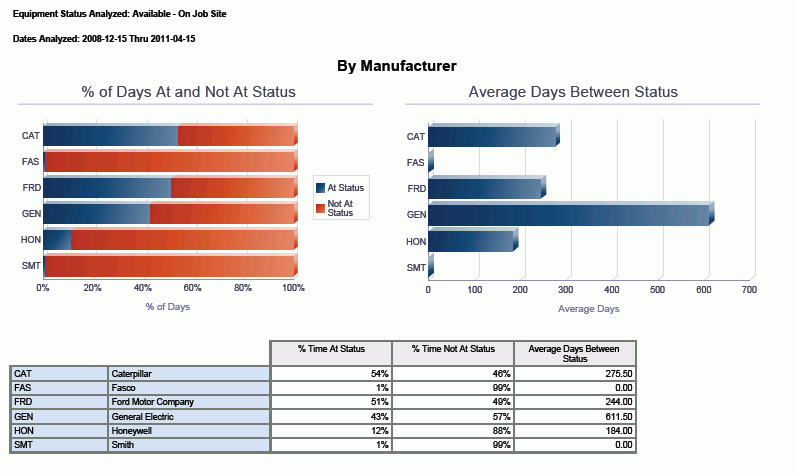
13.1.3.2 Equipment Status Analysis by Manufacturer
Use this report to analyze the status of equipment by manufacturer so that different equipment manufacturers can be compared to see if some are more reliable (Available status) than others. This is helpful when making purchase decisions.
This report contains the following components:
-
Average Days At and Not At Status (horizontal bar graph)
-
Percentage of Days At and Not At Status (horizontal bar graph)
-
Average Days Between Status (horizontal bar graph)
-
Average Days To Status (horizontal bar graph)
-
Summary by Manufacturer (table)
-
Details by Manufacturer (table)
The Details by Manufacturer table component contains drill back functionality as described in the following table:
| Functionality | Value |
|---|---|
| Table column containing drill back link | Equipment Number |
| Table columns passed to application | Equipment No |
| Application called | Equipment Master Revisions (P1702) |
| Form called | W1702A |
| Version called | ZJDE0001 |
13.1.3.3 Equipment Status Analysis by Parent Equipment
Use this report to analyze the status of equipment summarized by equipment parent so that equipment can be compared at the parent level.
This report contains the following components:
-
Average Days At and Not At Status (horizontal bar graph)
-
Percentage of Days At and Not At Status (horizontal bar graph)
-
Average Days Between Status (horizontal bar graph)
-
Average Days To Status (horizontal bar graph)
-
Summary by Parent Equipment (table)
-
Details by Parent Equipment (table)
The Details by Parent Equipment table component contains drill back functionality as described in the following table:
| Functionality | Value |
|---|---|
| Table column containing drill back link | Equipment Number |
| Table columns passed to application | Equipment No |
| Application called | Equipment Master Revisions (P1702) |
| Form called | W1702A |
| Version called | ZJDE0001 |
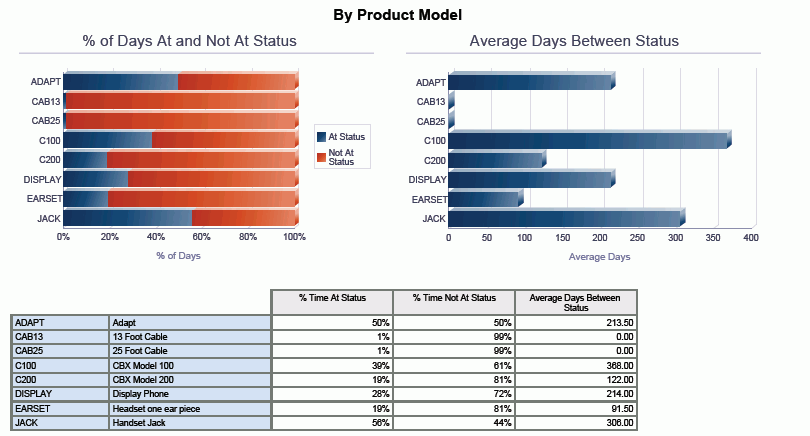
13.1.3.4 Equipment Status Analysis by Product Model
Use this report to analyze the status of equipment by product model so that different equipment product models can be compared to see if some are more reliable (Available status) than others. This is helpful when making purchase decisions.
This report contains the following components:
-
Average Days At and Not At Status (horizontal bar graph)
-
Percentage of Days At and Not At Status (horizontal bar graph)
-
Average Days Between Status (horizontal bar graph)
-
Average Days To Status (horizontal bar graph)
-
Summary by Product Model (table)
-
Details by Product Model (table)
The Details by Product Model table component contains drill back functionality as described in the following table:
| Functionality | Value |
|---|---|
| Table column containing drill back link | Equipment Number |
| Table columns passed to application | Equipment No |
| Application called | Equipment Master Revisions (P1702) |
| Form called | W1702A |
| Version called | ZJDE0001 |
13.1.3.5 Equipment Status Analysis
The Equipment Status Analysis report is a summary report that shows the status analysis for equipment by manufacturer, product family, product model and parent. For each, the report shows the Percentage of Days At and Not At Status, and the Average Days Between Status.
This report contains the following components:
-
Percentage of Days At and Not At Status by Parent Equipment Number (horizontal bar graph)
-
Average Days Between Status by Parent Equipment Number (horizontal bar graph)
-
Percentage of Days At and Not At Status by Manufacturer (horizontal bar graph)
-
Average Days Between Status by Manufacturer (horizontal bar graph)
-
Percentage of Days At and Not At Status by Product Family (horizontal bar graph)
-
Average Days Between Status by Product Family (horizontal bar graph)
-
Percentage of Days At and Not At Status by Product Model (horizontal bar graph)
-
Average Days Between Status by Product Model (horizontal bar graph)
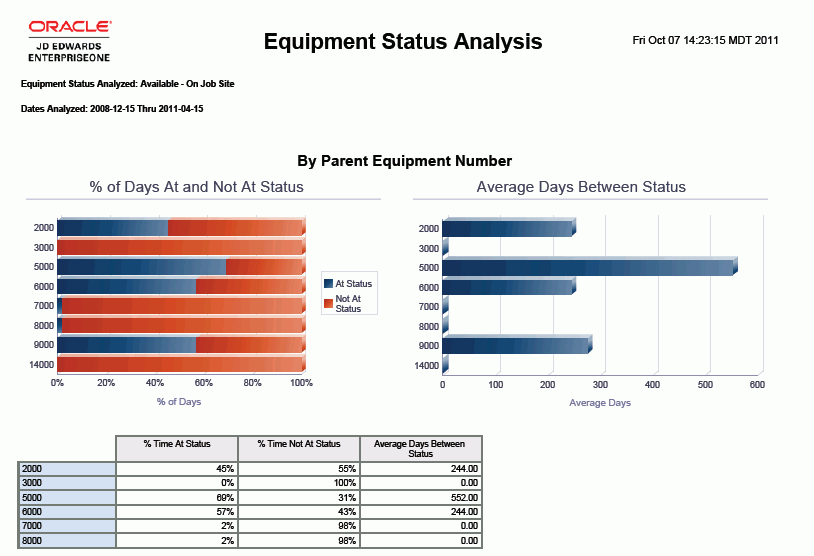
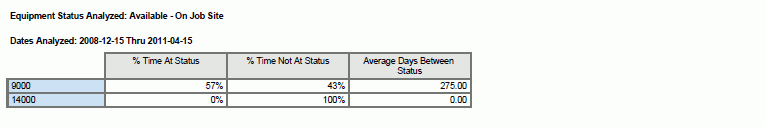
The following report was generated by selecting the date range as 12/15/2008 through 04/15/2011 and the equipment status to analyze as AV, Available - On Job Site.
To better understand the 16 calculations that are displayed in the grid columns, consider for a specific piece of equipment, the following status history. In the One View Equipment Status Inquiry application the status history records are aggregated into a single grid row and summarized with these 16 calculated columns, taking into account the status being analyzed and the time frame being analyzed as indicated in the header.
In the following example, 9/01/2011 through 10/07/2011 is being analyzed. The equipment has been at many different statuses during this time period. First, you need to understand how many days are being analyzed. This is simply 10/07/2011 less 9/01/2011, or 37 days.
(1) Total Number of Days = 37
Date Range Analyzed: 9/1/2011 through 10/7/2011
| Status | Status Begin Date | Status End Date | # Days at Status |
|---|---|---|---|
| AV | 10/2/2011 | OPEN | 6 |
| DN | 9/30/2011 | 10/2/2011 | 2 |
| AV | 9/26/2011 | 9/30/2011 | 4 |
| DN | 9/24/2011 | 9/26/2011 | 2 |
| AV | 9/18/2011 | 9/24/2011 | 6 |
| SB | 9/16/2011 | 9/18/2011 | 2 |
| DN | 9/13/2011 | 9/16/2011 | 3 |
| AV | 9/5/2011 | 9/13/2011 | 8 |
| SB | 9/3/2011 | 9/5/2011 | 2 |
| 1S | 9/1/2011 | 9/3/2011 | 2 |
If these status changes are shown on a timeline, it looks like this, where each point in time is indicated as A, B, C … K, and the numbers shown represent the number of days the equipment was at that status:
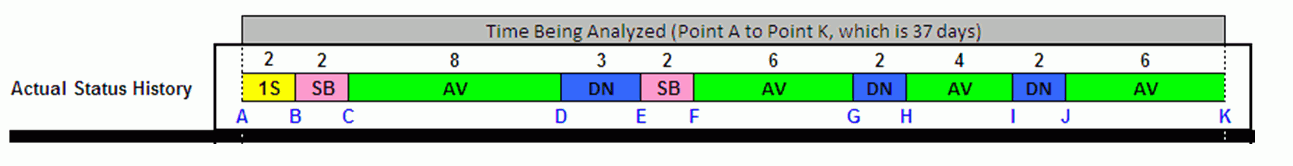
To analyze the AV - Available status, you first must divide the status/time segments into two pieces: At Status (AV) segments and Not At Status continuous segments. This is illustrated below, where the At Status segment is shown in green and the Not At Status continuous segments are shown in gray:
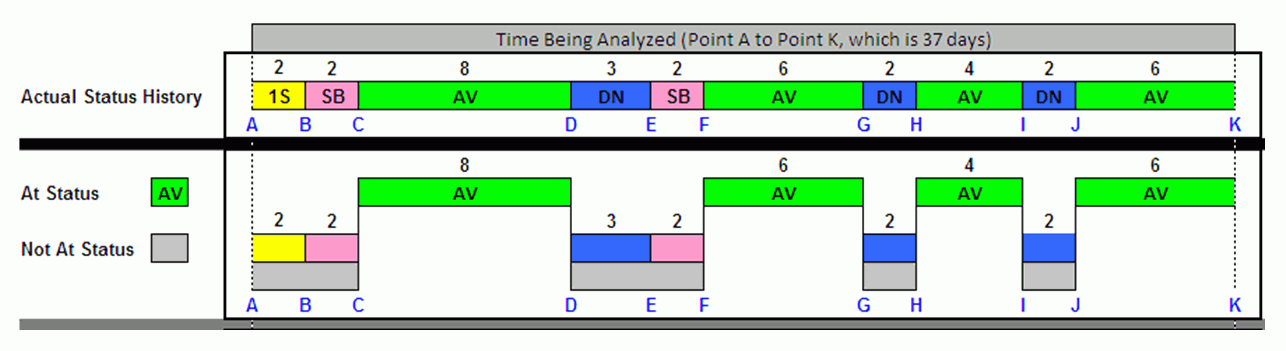
You can see that the equipment was at a status of AV four times during the analysis period for a total of 24 days (8 + 6 + 4 + 6).
(2) Number of Status Occurrences = 4
(3) Segments At Status = 4
(4) Segments Not At Status = 4
(5) Total Days At Status = (8+6+4+6) = 24
|
Note: In most cases the Number of Status Occurrences and the Segments At Status will be identical. Technically the Number of Status Occurrences is the number of Equipment Status History records where the status is equal to the status being analyzed, whereas Segments At Status is the number of continuous segments where the history record status is equal to the status being analyzed. |
It was not at a status of AV also 4 times for a total of 13 days (2 + 2 + 3 + 2 + 2 + 2).
(6) Total Days Not At Status = (2+2+3+2+2+2) = 13
You can also easily calculate the average number of days the equipment was at and not at the AV status. This is the total number of days at (or not at) status divided by the number of segments. In this example:
(7) Average Days At Status = 24/4 = 6
(8) Average Days Not At Status = 13/4 = 3.3
Once you know the number of days at and not at status, it is easy to calculate the percentage at status and percentage not at status. Simply divide the days by the total number of days being analyzed, which is 37 in this example.
(9) % Days At Status = 24/37 or 65%
(10) % Days Not At Status = 13/37 or 35%
The previous diagram shows that there are three segments that are bracketed between an AV - available status. Those are segments DF, GH, and IJ. To calculate the Average Days Between Status, add up the days for those three segments and divide by three, the number of segments bracketed between an AV status.
(11) Bracketed Segments = 3
(12) Days Between Status = (3 + 2 + 2 + 2) = 9
(13) Average Days Between Status = 9/3 = 3
And finally, you need to calculate the Average Days To Status. This measures how many days it takes the equipment, on average, to reach a status (AV - Available in our example). In our example, it reached an AV status four times.
-
The first time during the analysis period, it took four days to reach AV (point A to point C, or 2 + 2 = 4 days).
-
The next time it reached a status of AV was point F, and it took 13 days to do so (point C to point F, 8 + 3 + 2 = 13 days).
-
The third time it took eight days (point F to point H, 6 + 2 = 8 days).
-
The last time it reached AV status in the analysis period it took six days (point H to point J, 4 + 2 = 6 days).
Adding these days up and dividing by the number of times AV status was reached gives you:
(14) Segments to Status = 4
(15) Total Days To Status = (4 + 13 + 8 + 6) = 31
(16) Average Days To Status = 31/4 = 7.8
13.2 One View Equipment License/Permit Inquiry (P13500)
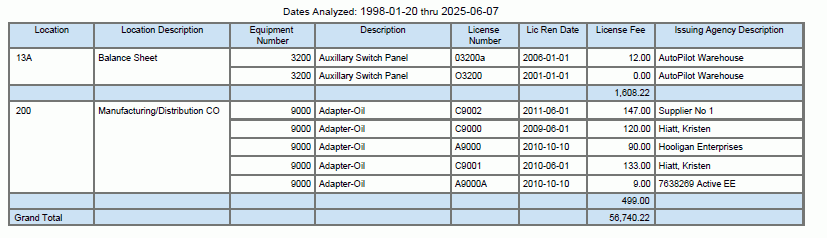
Access the One View Equipment License/Permit Inquiry application (P13500) from the Equipment Information (G1311) menu. Use One View Equipment License/Permit Inquiry to analyze the expired or expiring licenses and permits and tally the total license/permit renewal fee amount for a given time frame. One View Equipment License/Permit Inquiry uses the F1201/F1217/F1206 Join for One View Equip Permit Information business view (V1206B), which includes columns from F1201, F1217, and the Equipment License Master table (F1206). This application provides a wealth of data and is extremely flexible in the types of reports that can be generated. Choose from over 64 columns in the business view to analyze the expired and expiring license/permit information for your equipment. Along with a delivered report, One View Equipment License/Permit Inquiry can provide reports for many purposes. Some examples include analysis by state, issuing agency, product family, and location. The reports can also be for a specified time period either earlier, as in expired licenses/permits, or the future, as in expiring licenses/permits. This information is helpful for an organization when planning budgets for license/permit fees and tasks related to renewals.
One View Equipment License/Permit Inquiry is delivered with a pre-defined report. This report is Expiring/Expired Equipment Licenses and Permits Analysis. With this delivered report, you can see an analysis of the renewal fees associated with equipment licenses and permits over a specified period (either past or future) summarized by state, issuing agency, product family, and location.
13.2.2 Special Processing
When working with One View Equipment License/Permit Inquiry, you must enter the number of days to analyze.
You also indicate whether to analyze Days Past for expired licenses/permits, Days Ahead for expiring licenses/permits, or both.
The records that appear in the grid are the F1206 records that have a License Renewal Date that falls within your header analysis criteria.
13.2.3 Reports
The Expiring/Expired Equipment Licenses and Permits Analysis report is delivered with the One View Equipment License/Permit Inquiry application.
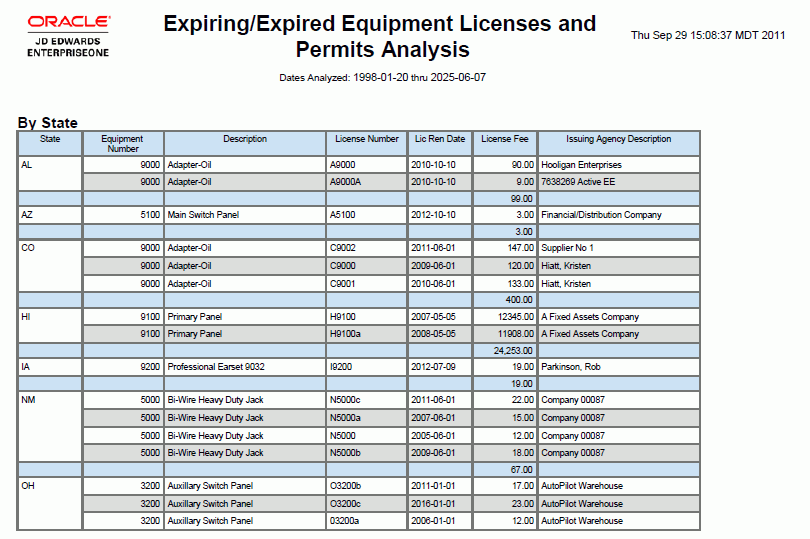
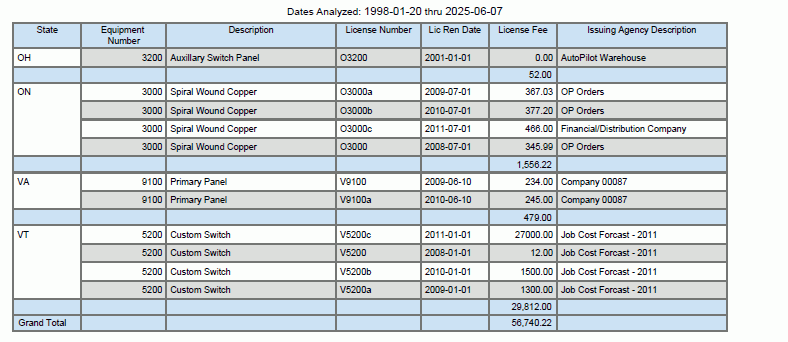
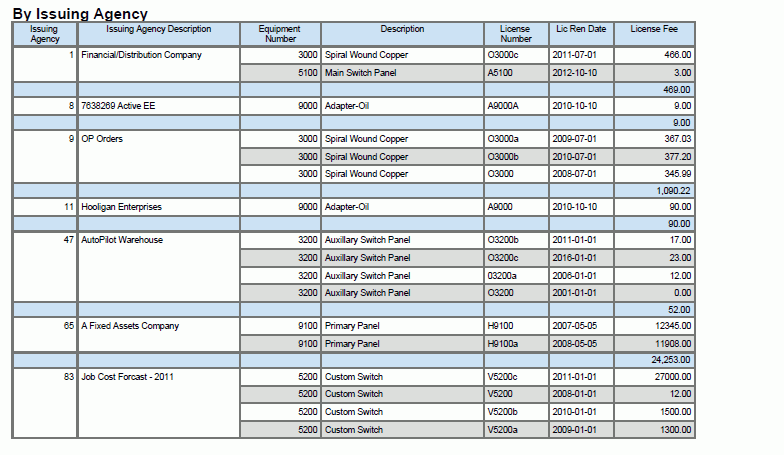
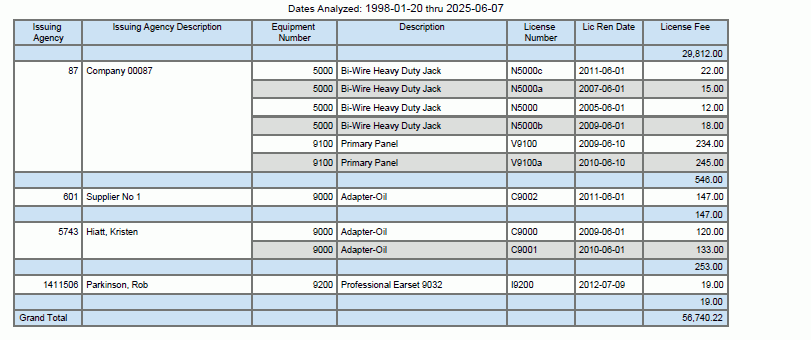
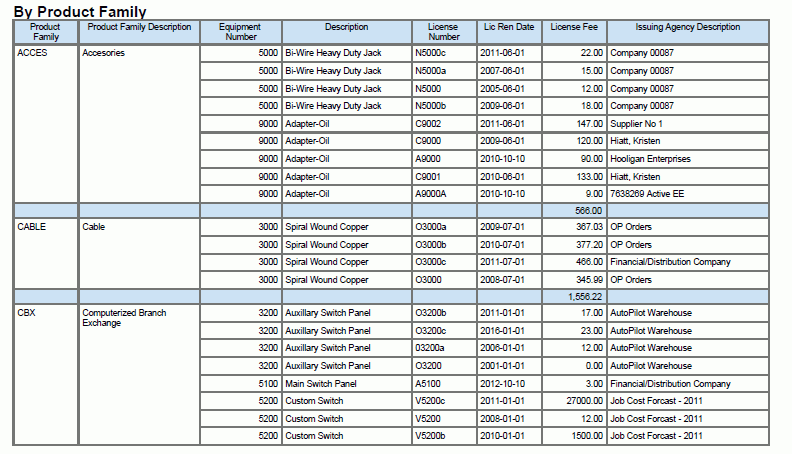
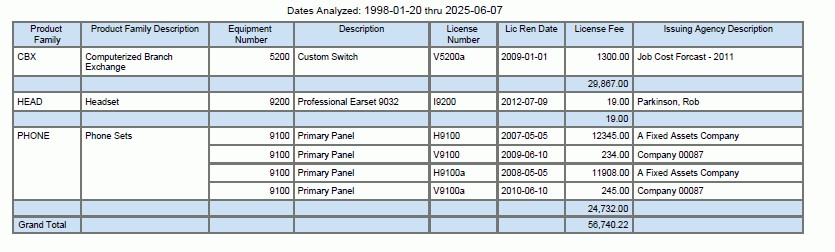
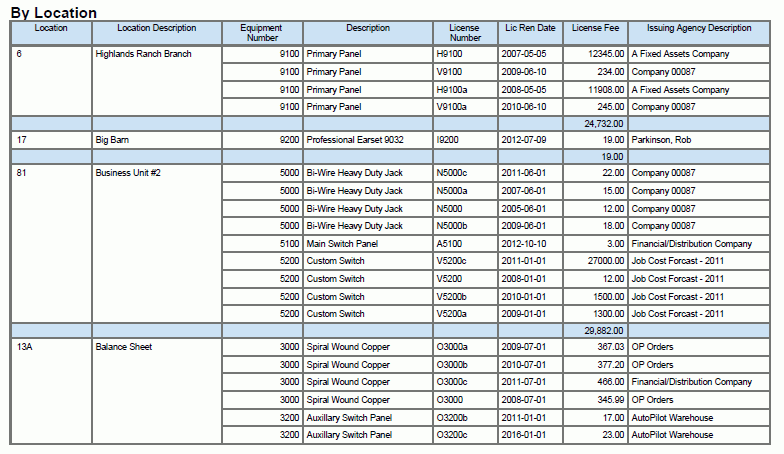
13.2.3.1 Expiring/Expired Equipment Licenses and Permits Analysis
Use this report to analyze the renewal fees associated with equipment licenses and permits, tallied by state, issuing agency, product family, and location.
This report contains the following components:
-
By State (table)
-
By Issuing Agency (table)
-
By Product Family (table)
-
By Location (table)
This report contains drill back functionality as described in the following table:
| Functionality | Value |
|---|---|
| Table column containing drill back link | Equipment Number |
| Table columns passed to application | Equipment No |
| Application called | Equipment Master Revisions (P1702) |
| Form called | W1702A |
| Version called | ZJDE0001 |
The following report was generated using this criteria:
-
Days to Analyze = 5000
-
Today's Date = September 29, 2011
-
Days Past check box is selected.
-
Days Ahead check box is selected.
13.3 One View Work Order Analysis (P13560)
Access the One View Work Order Analysis application (P13560) from the Work Order (G1316) menu for equipment work orders and the Daily Work Order Processing (G1712) menu for service work orders. Use One View Work Order Analysis to analyze your work orders for such measures as aging, incoming and completion rates, counts, and timeliness. One View Work Order Analysis uses the One View Work Order Analysis business view (V13550), which includes columns from the Work Order Master table (F4801), Work Order Master Tag table (F4801T), and the Document Type Master table (F40039). This application provides a wealth of data and is extremely flexible in the types of reports that can be generated. Choose from over 106 columns in the business view, and numerous calculated columns in the grid related to additional work order analysis information to analyze your work orders. Along with some delivered reports, One View Work Order Analysis Inquiry can provide reports for many purposes. Some examples include analysis related to key work order metrics such as count or status, the timeliness of completing work orders, estimated vs. actual costs and hours, and work order aging.
One View Work Order Analysis Inquiry is delivered with several pre-defined reports. These reports include Work Order Aging (detailed and summary versions), Work Order Completion Timeliness (detailed and summary versions), Work Order Estimated vs. Actual Cost (detailed and summary versions), Work Order Estimated vs. Actual Hours (detailed and summary versions), Work Order Load - By Assigned To, Work Order Load - By Failure, Work Order Statistics (detailed and summary versions), and Work Order Metrics Analysis. With these delivered reports, you can see an analysis of your work orders across a variety of measures such as aging, completion timeliness, the rate (load) at which work orders are created, scheduled and completed, and a comparison of estimated vs. actual costs and hours, and other key work order metrics.
13.3.1 Processing Options
Processing options enable you to specify the default processing for programs and reports.
13.3.1.1 Process
- 1. Work Order Age Basis
-
Specify which work order date to use when calculating the Work Order Age.
Values are:
01:Order Date
02:Planned Start Date
- 2. Work Order Type
-
Specify which work order type the system returns when you search for valid work orders.
Values are:
1:Service
2:Equipment
- 3. Period Definition Default
-
Specify which period type to default when doing the period analysis.
Values are:
1:Weeks
2:Months
3:Years
- 4. Only Include Work Orders with Open Commitments
-
Specify the default value to determine whether to only show work orders with open commitments.
Values are:
Blank: No
1: Yes
13.3.2 Special Processing
You must specify on the processing options what type of work order you will be working with, either equipment work orders or service work orders. Only one type can be analyzed at a time.
Also, on the processing options you need to specify the date to use when calculating the work order age (Work Order Age Basis), either Order Date or Planned Start Date.
For the Load reports, work orders are analyzed over the past 13 periods, with today's date falling into the 13th period. You can select whether periods are weeks, months or years. There is a processing option to set a default period type. For example, you can analyze work orders over the past 12 weeks plus the current week for the load reports.
There is a check box in the header (and a processing option to set the default setting) to show only work orders with open inventory commitments. This is useful for analyzing the type of work orders, their age, or related costs, for work orders waiting on parts.
Although the various delivered reports have specified criteria, the Data Model for all of the reports have a large variety of available fields to easily modify existing reports to analyze by other criteria. Since this module is available for both equipment and service work orders, the desired criteria might be quite different for each work order type for the same report.
13.3.3 Reports
The reports delivered with the One View Work Order Analysis application are:
-
Aging - Detailed
-
Aging - Summary
-
Completion Timeliness - Detailed
-
Completion Timeliness - Summary
-
Estimated vs. Actual Cost - Detailed
-
Estimated vs. Actual Cost- Summary
-
Estimated vs. Actual Hours - Detailed
-
Estimated vs. Actual Hours- Summary
-
Load - By Assigned To
-
Load - By Failure
-
Statistics - Detailed
-
Statistics - Summary
-
Work Order Metrics Analysis
13.3.3.1 Aging - Detailed
Use this report to analyze the age of work orders. Work order age can be determined by using either the Order Date (the date the work order was created) or the Planned Start Date (useful to see when work orders are created well in advance of their Planned Start Date) by setting a processing option. The work order age is calculated by comparing the Work Order Age Basis date to today's date for open work orders and to the Actual Finish Date for completed work orders. The detailed aging report highlights individual work orders.
Work order age is calculated in days and categorized into four buckets: 0-30 days old, 31-90 days old, greater than 90 days old, and not yet aged if it is scheduled to start in a future period and you are analyzing using Planned Start Date.
This report contains the following components:
-
Top 10 Oldest Work Orders (horizontal bar graph)
-
Work Order Age by Work Order Type (table)
-
Average Work Order Age by Work Order Type -(multiple bar graphs by supervisor)
-
Average Work Order Age by Supervisor -(multiple bar graphs by business unit)
-
Reference tables with Business Unit, Supervisor, and Work Order Type descriptions
This report contains drill back functionality as described in the following table:
| Functionality | Value |
|---|---|
| Table column containing drill back link | Work Order Number |
| Table columns passed to application | WO Number |
| Application called | Work Order Revisions (P17714) |
| Form called | W17714A |
| Version called | ZJDE0003 |
13.3.3.2 Aging - Summary
Use this report to analyze the age of work orders. Work order age can be determined by using either the Order Date (the date the work order was created) or the Planned Start Date (useful to see when work orders are created well in advance of their Planned Start Date) by setting a processing option. The work order age is calculated by comparing the Work Order Age Basis date to today's date for open work orders and to the Actual Finish Date for completed work orders. The summary aging report shows an analysis by work order type, supervisor and business unit.
Work order age is calculated in days and categorized into four buckets: 0-30 days old, 31-90 days old, greater than 90 days old, and not yet aged if it is scheduled to start in a future period and you are analyzing using Planned Start Date.
This report contains the following components:
-
Age Distribution by Work Order Type (horizontal bar graph)
-
Age Distribution by Work Order Type (table)
-
Age Distribution by Supervisor (horizontal bar graph)
-
Age Distribution by Supervisor (table)
-
Age Distribution by Business Unit (horizontal bar graph)
-
Age Distribution by Business Unit (table)
-
Average Age by Work Order Type (horizontal bar graph)
-
Average Age by Work Order Type (table)
-
Average Age by Supervisor (horizontal bar graph)
-
Average Age by Supervisor (table)
-
Average Age by Business Unit (horizontal bar graph)
-
Average Age by Business Unit (table)
-
Average Work Order Age (gauge)
-
Work Order Age (by Business Unit, Supervisor, Work Order Type) (table)
13.3.3.3 Completion Timeliness - Detailed
Use this report to analyze how timely work orders were completed. Work orders are analyzed for how many days they completed early or late. The Planned Finish Date is compared to the Actual Finish Date for completed work orders. The detailed version highlights individual work orders.
Work order timeliness is calculated and categorized into four buckets: completed on-time or early, completed up to 1 month late, completed greater than 1 month late, or N/A (in the case where either the Planned Finish Date or Actual Finish Date is blank, as in open work orders).
This report contains the following components:
-
Top 10 Work Orders that Completed Late (horizontal bar graph)
-
Work Order Completion Timeliness (table)
-
Reference tables for Customer, Lead Craft, and Assigned To
This report contains drill back functionality as described in the following table:
| Functionality | Value |
|---|---|
| Table column containing drill back link | Work Order Number |
| Table columns passed to application | WO Number |
| Application called | Work Order Revisions (P17714) |
| Form called | W17714A |
| Version called | ZJDE0003 |
13.3.3.4 Completion Timeliness - Summary
Use this report to analyze how timely work orders were completed. Work orders are analyzed for how many days they completed early or late. The Planned Finish Date is compared to the Actual Finish Date for completed work orders. The summary version shows an analysis by work order type, supervisor and business unit.
Work order timeliness is calculated and categorized into four buckets: completed on-time or early, completed up to 1 month late, completed greater than 1 month late, or N/A (in the case where either the Planned Finish Date or Actual Finish Date is blank, as in open work orders).
This report contains the following components:
-
Average Days Completed by Assigned To (horizontal bar graph)
-
Average Days Completed by Assigned To (table)
-
Average Days Completed by Lead Craft (horizontal bar graph)
-
Average Days Completed by Lead Craft (table)
-
Average Days Completed by Customer (horizontal bar graph)
-
Average Days Completed by Customer (table)
-
Completion Timeliness Distribution by Assigned To (horizontal bar graph)
-
Completion Timeliness Distribution by Assigned To (table)
-
Completion Timeliness Distribution by Lead Craft (horizontal bar graph)
-
Completion Timeliness Distribution by Lead Craft (table)
-
Completion Timeliness Distribution by Customer (horizontal bar graph)
-
Completion Timeliness Distribution by Customer (table)
-
Work Order Completion Timeliness (by Customer, Lead Craft, Assigned To) (table)
13.3.3.5 Estimated vs. Actual Cost - Detailed
Use this report to analyze the costs associated with work orders: material, labor, other, and total costs. This report enables you to analyze costs and their variances (estimated less actual). The detailed version highlights individual work order costs.
This report contains the following components:
-
Total Cost Variance by Contract (horizontal bar graph)
-
Total Cost Variance by Contract (table)
-
Total Cost Variance by Site (horizontal bar graph)
-
Total Cost Variance by Site (table)
-
Total Cost Variance by Customer (horizontal bar graph)
-
Total Cost Variance by Customer (table)
-
10 Most Expensive Work Orders (Cost) (horizontal bar graph)
-
Estimate vs. Actual Cost - Totals (table)
-
Estimate vs. Actual Cost - Details (table)
The Estimate vs. Actual Cost - Details table component contains drill back functionality as described in the following table:
| Functionality | Value |
|---|---|
| Table column containing drill back link | Work Order Number |
| Table columns passed to application | WO Number |
| Application called | Work Order Revisions (P17714) |
| Form called | W17714A |
| Version called | ZJDE0003 |
13.3.3.6 Estimated vs. Actual Cost - Summary
Use this report to analyze the costs associated with work orders: material, labor, other, and total costs. This report enables you to analyze costs and their variances (estimated less actual). The summary version shows costs summarized by groupings of contract, site, and customer.
This report contains the following components:
-
Average Total Cost Variance by Contract (horizontal bar graph)
-
Average Total Cost Variance by Site (horizontal bar graph)
-
Average Total Cost Variance by Customer (horizontal bar graph)
-
Average Work Order Cost (gauge)
-
Average Estimate vs. Actual Cost - Totals (table)
-
Average Estimate vs. Actual Cost - Details (table)
13.3.3.7 Estimated vs. Actual Hours - Detailed
Use this report to analyze the hours associated with work orders: hours and downtime hours. This report enables you to analyze hours and their variances (estimated less actual). The detailed version highlights individual work order hours.
This report contains the following components:
-
Total Hours Variance by Failure (horizontal bar graph)
-
Total Hours Variance by Failure (table)
-
Total Hours Variance by Product Model (horizontal bar graph)
-
Total Hours Variance by Product Model (table)
-
Total Hours Variance by Product Family (horizontal bar graph)
-
Total Hours Variance by Product Family (table)
-
Total Downtime Hours Variance by Failure (horizontal bar graph)
-
Total Downtime Hours Variance by Failure (table)
-
Total Downtime Hours Variance by Product Model (horizontal bar graph)
-
Total Downtime Hours Variance by Product Model (table)
-
Total Downtime Hours Variance by Product Family (horizontal bar graph)
-
Total Downtime Hours Variance by Product Family (table)
-
Estimated vs. Actual Hours (table)
The Estimated vs. Actual Hours table component contains drill back functionality as described in the following table:
| Functionality | Value |
|---|---|
| Table column containing drill back link | Work Order Number |
| Table columns passed to application | WO Number |
| Application called | Work Order Revisions (P17714) |
| Form called | W17714A |
| Version called | ZJDE0003 |
13.3.3.8 Estimated vs. Actual Hours- Summary
Use this report to analyze the hours associated with work orders: hours and downtime hours. This report enables you to analyze hours and their variances (estimated less actual). The summary version shows hours summarized by groupings of failure, product model, and product family.
This report contains the following components:
-
Average Hours Variance by Failure (horizontal bar graph)
-
Average Hours Variance by Product Model (horizontal bar graph)
-
Average Hours Variance by Product Family (horizontal bar graph)
-
Average Downtime Hours Variance by Failure (horizontal bar graph)
-
Average Downtime Hours Variance by Product Model (horizontal bar graph)
-
Average Downtime Hours Variance by Product Family (horizontal bar graph)
-
Estimated vs. Actual Hours (by Product Family, Product Model, Issue) (table)
13.3.3.9 Load - By Assigned To
Use this report to analyze the rate at which work orders are created (incoming rate based on Order Date), are scheduled (planned rate based on Planned Start Date), and are completed (completed rate based on Actual Finish Date). This information is analyzed by product family, product model and assigned to (the technician).
You can determine over what period work order rates are analyzed. The analysis is always over the past 13 periods where the 13th period is the current period. You select whether to analyze by weeks, months, or years.
This report contains the following components:
-
Incoming Work Order Load (by Product Family, Product Model, Assigned To) (table)
-
Incoming Load per Period by Assigned To (line graph)
-
Planned Work Order Load (by Product Family, Product Model, Assigned To) (table)
-
Planned Load per Period by Assigned To (line graph)
-
Completed Work Order Load (by Product Family, Product Model, Assigned To) (table)
-
Completed Load per Period by Assigned To (line graph)
-
Average Load per Period by Assigned To (horizontal bar graph)
-
Average Load by Period by Product Model (horizontal bar graph)
-
Average Load per Period by Product Family (horizontal bar graph)
-
Average Load per Period for All Work Orders (horizontal bar graph)
-
Reference tables for Product Family, Work Order Type, and Assigned To descriptions
13.3.3.10 Load - By Failure
Use this report to analyze the rate at which work orders are created (incoming rate based on Order Date), are scheduled (planned rate based on Planned Start Date), and are completed (completed rate based on Actual Finish Date). This information is analyzed by work order type, equipment number, and failure.
You can determine over what period work order rates are analyzed. The analysis is always over the past 13 periods where the 13th period is the current period. You select whether to analyze by weeks, months, or years.
This report contains the following components:
-
Incoming Work Order Load (by Work Order Type, Equipment Number, Failure) (table)
-
Incoming Load per Period by Failure (line graph)
-
Planned Work Order Load (by Work Order Type, Equipment Number, Failure) (table)
-
Planned Load per Period by Failure (line graph)
-
Completed Work Order Load (by Work Order Type, Equipment Number, Failure) (table)
-
Completed Load per Period by Failure (line graph)
-
Average Load per Period by Failure (horizontal bar graph)
-
Average Load by Period by Equipment (horizontal bar graph)
-
Average Load per Period by Work Order Type (horizontal bar graph)
-
Average Load per Period for All Work Orders (horizontal bar graph)
-
Reference tables for Equipment and Work Order Type descriptions
13.3.3.11 Statistics - Detailed
Use this report to analyze work orders on a variety of key metrics. Work orders are analyzed by work order type, product model and product family. Metrics include Total WO Costs, Count, Actual Hours and Actual Downtime Hours, Order Date, Planned Start Date, and Actual Finish Date, Percentage Complete, and Work Order Age. The detailed version highlights individual work orders.
This report contains the following components:
-
Total Cost by Work Order Type (horizontal bar graph)
-
Total Cost by Work Order Type (table)
-
Total Cost by Product Model (horizontal bar graph)
-
Total Cost by Product Model (table)
-
Total Cost by Product Family (horizontal bar graph)
-
Total Cost by Product Family (table)
-
Number of Work Orders by WO Type (pie chart)
-
Number of Work Orders by WO Type (table)
-
Number of Work Orders by Product Model (pie chart)
-
Number of Work Orders by Product Model (table)
-
Number of Work Orders by Product Family (pie chart)
-
Number of Work Orders by Product Family (table)
-
Work Order Statistics (table)
The Work Order Statistics table component contains drill back functionality as described in the following table:
| Functionality | Value |
|---|---|
| Table column containing drill back link | Work Order Number |
| Table columns passed to application | WO Number |
| Application called | Work Order Revisions (P17714) |
| Form called | W17714A |
| Version called | ZJDE0003 |
13.3.3.12 Statistics - Summary
Use this report to analyze work orders on a variety of key metrics. Work orders are analyzed by work order type, product model and product family. Metrics include Total WO Costs, count, Actual Hours and Actual Downtime Hours, Order Date, Planned Start Date, and Actual Finish Date, Percentage Complete, and Work Order Age. The summary version summarizes by work order type, product family, and product model.
This report contains the following components:
-
Average Total Cost by WO Type (horizontal bar graph)
-
Average Total Cost by WO Type (table)
-
Average Total Cost by Product Model (horizontal bar graph)
-
Average Total Cost by Product Model (table)
-
Average Total Cost by Product Family (horizontal bar graph)
-
Average Total Cost by Product Family (table)
-
Average Actual Hours per Work Order by WO Type (horizontal bar graph)
-
Average Actual Hours per Work Order by WO Type (table)
-
Average Actual Downtime Hours per Work Order by WO Type (horizontal bar graph)
-
Average Actual Downtime Hours per Work Order by WO Type (table)
-
Average Percentage Complete by WO Type (horizontal bar graph)
-
Average Percentage Complete by WO Type (table)
-
Average Age by WO Type (horizontal bar graph)
-
Average Age by WO Type (table)
-
Work Order Statistics (by Product Family, Product Model, Work Order Type) (table)
-
Work Order Status by WO Type (WO Count) (pie charts)
-
Work Order Status by Work Order Type (WO Count) (by Work Order Type, Work Order Status) (table)
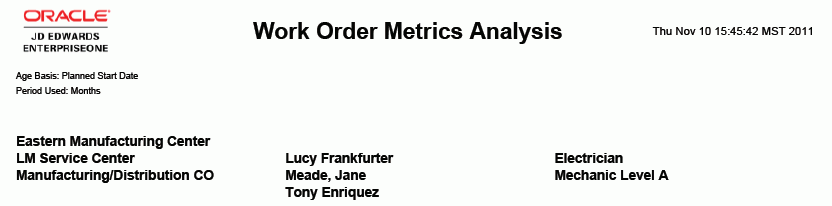
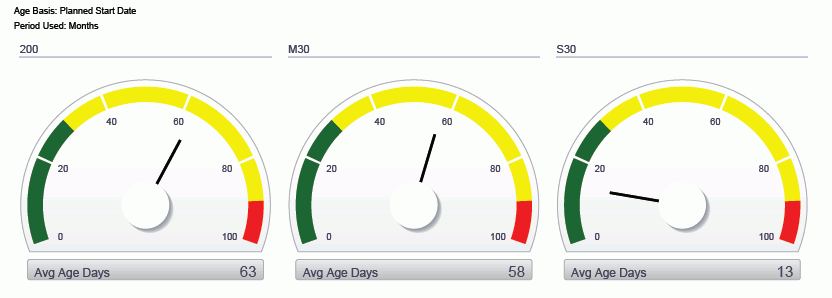
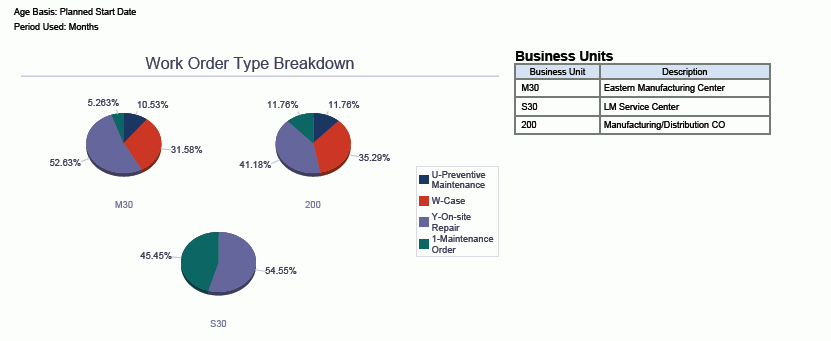
13.3.3.13 Work Order Metrics Analysis
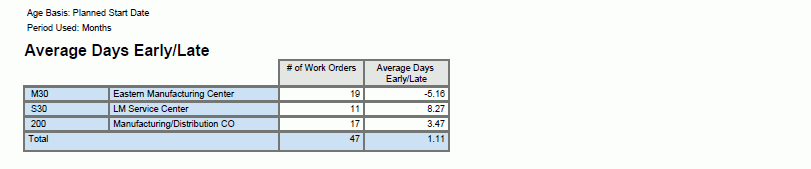
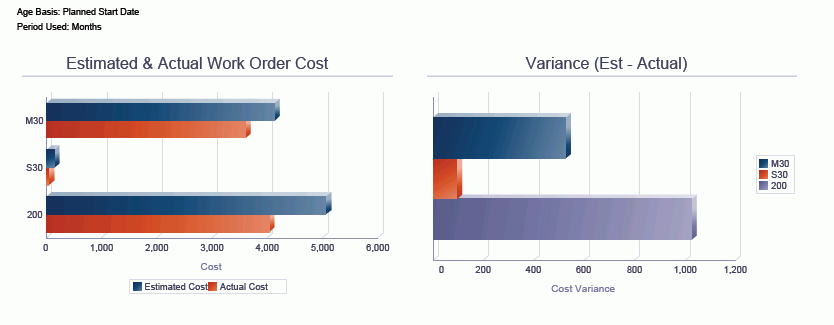
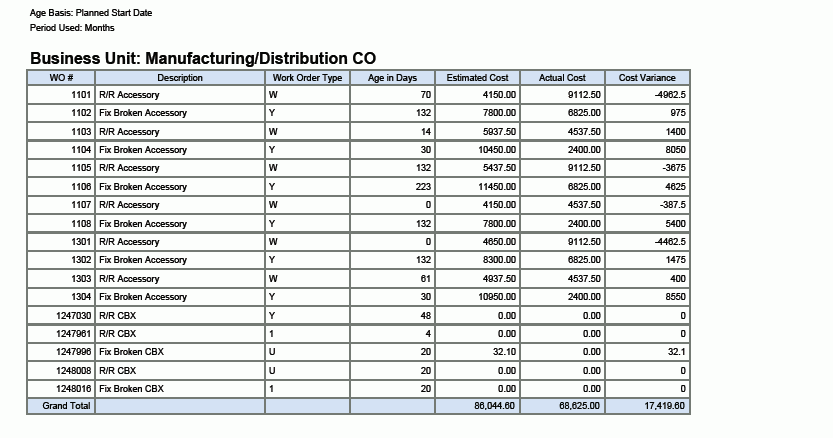
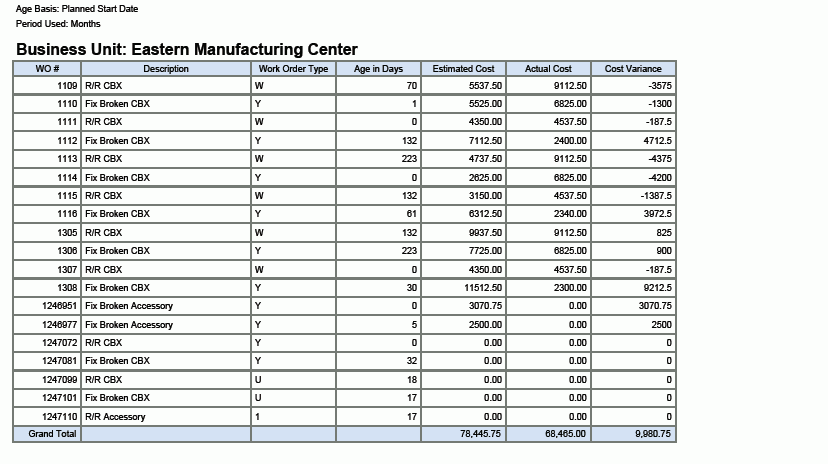
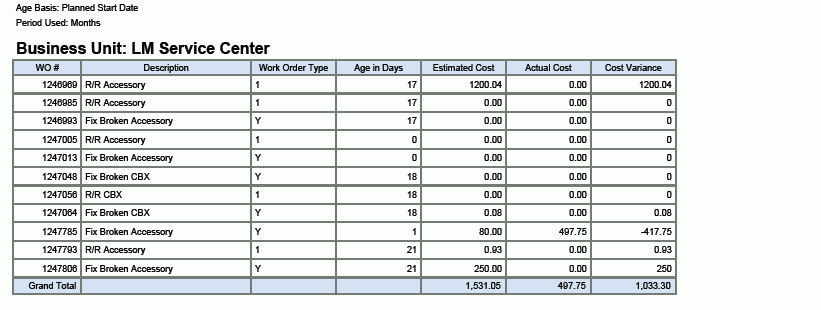
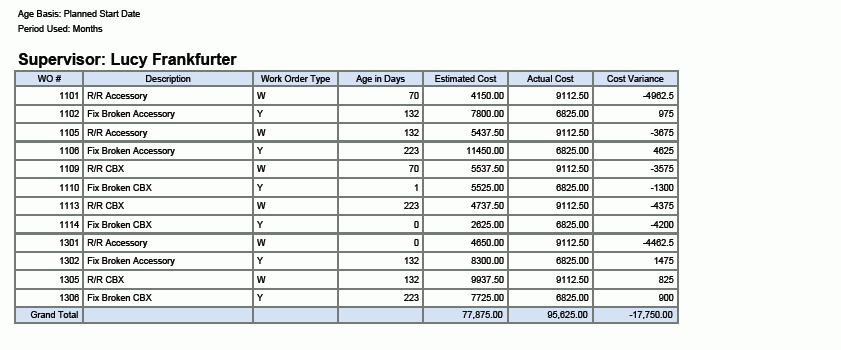
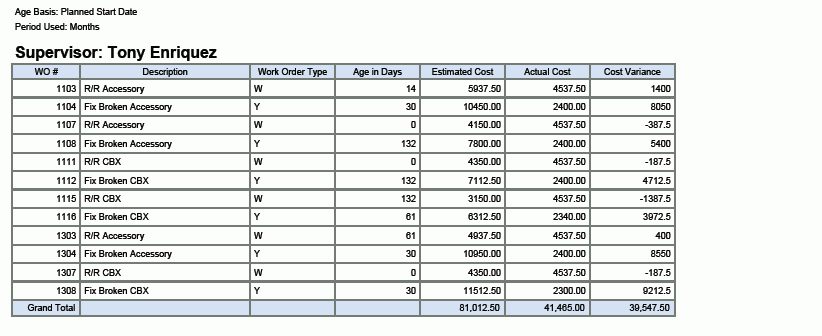
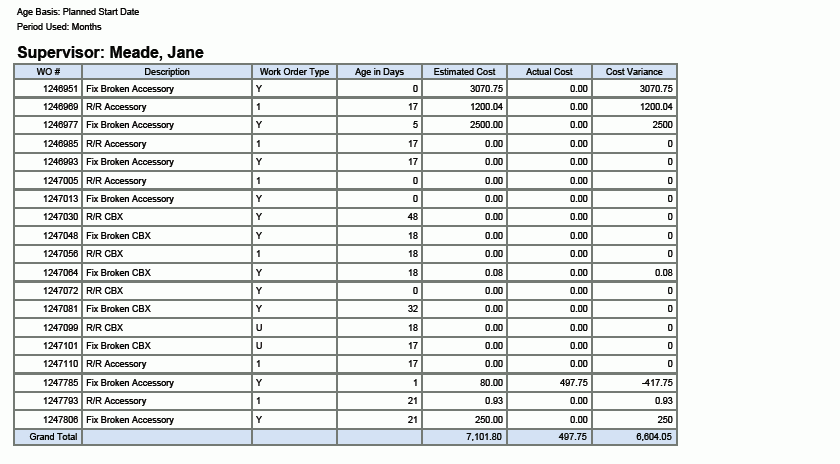
This report provides some key metrics from the other reports. The following metrics are graphically presented by Business Unit: Average Work Order Age in Days, Work Order Type, Incoming, Planned and Completed Work Order Rates, Average Days to Complete, and Estimated vs. Actual Total Costs and Cost Variance. At the end of the report individual work order metrics are presented in tabular form by Business Unit, Supervisor, and Lead Craft.
This report contains the following components:
-
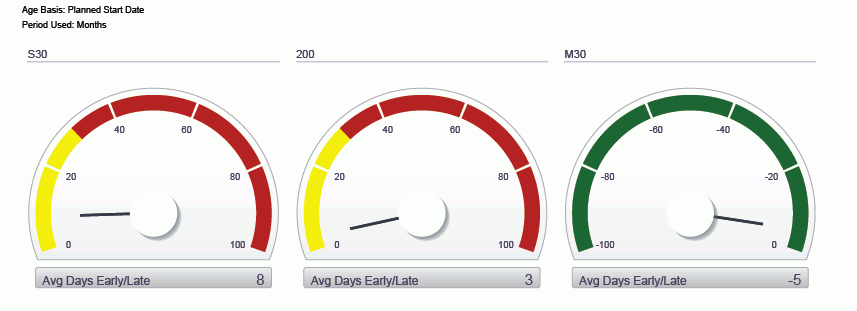
Average Age by Business Unit (gauges)
-
Work Order Type Breakdown by Business Unit (pie charts)
-
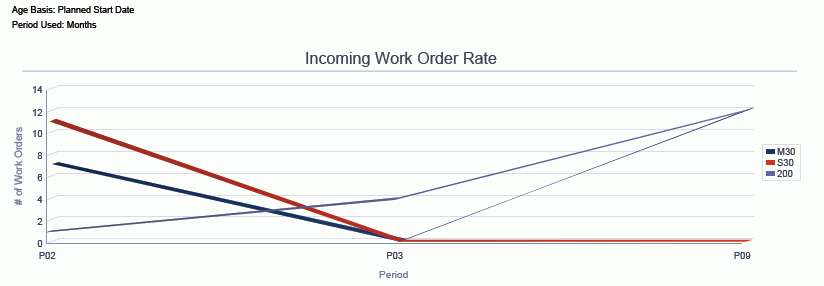
Incoming Work Order Rate (line graph)
-
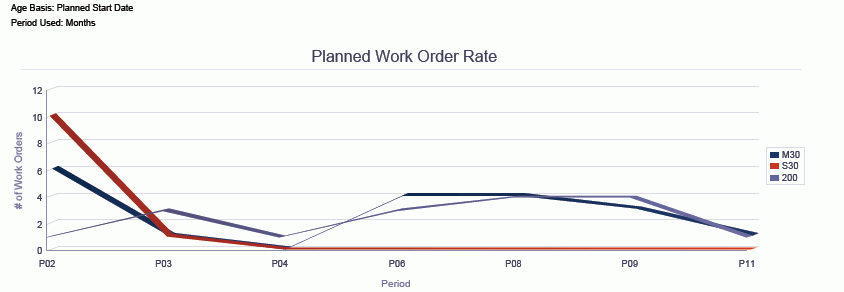
Planned Work Order Rate (line graph)
-
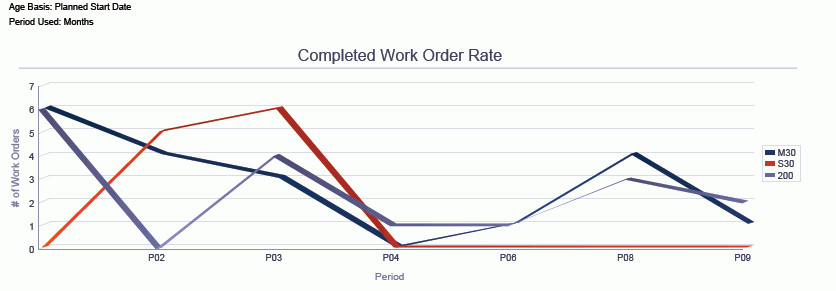
Completed Work Order Rate (line graph)
-
Work Order Days Complete by Business Unit (gauges)
-
Average Days to Complete Work Orders (table)
-
Estimated and Actual Work Order Cost (horizontal bar graph)
-
Variance (Estimated - Actual) (horizontal bar graph)
-
Work Orders by Business Unit (multiple tables)
-
Work Orders by Supervisor (multiple tables)
-
Work Orders by Lead Craft (multiple tables)
This report contains drill back functionality as described in the following table:
| Functionality | Value |
|---|---|
| Table column containing drill back link | Work Order Number |
| Table columns passed to application | WO Number |
| Application called | Work Order Revisions (P17714) |
| Form called | W17714A |
| Version called | ZJDE0003 |
The following report was generated by using this criteria:
-
Work Order Type = Service Work Order (processing option)
-
Work Order Age Basis = Planned Start Date (processing option)
-
Show Only Work Orders with Open Commitments check box was not selected.
-
Period Type to Analyze = months
-
Business Units = M30 (Eastern Manufacturing Center), S30 (LM Service Center), and 200 (Manufacturing/Distribution Co)
13.4 One View PM Analysis (P13570)
Access the One View PM Analysis application (P13570) from the Plant & Equipment Maintenance (G1315) menu. Use One View PM Analysis to analyze completed, upcoming, and overdue PMs. One View PM Analysis uses the One View PM Analysis (F1201-F1217-F1207) business view (V13570A), which includes columns from the Asset Master table (F1201), Equipment Master Extension table (F1217), and the Maintenance Schedule table (F1207). This application provides a wealth of data and is extremely flexible in the types of reports that can be generated. Choose from 95 columns in the business view, and numerous calculated columns in the grid related to PMs, to analyze the preventive maintenance information for your equipment. Along with some delivered reports, One View PM Analysis can provide reports for many purposes. Some examples include analysis of completed PMs, upcoming PMs, overdue PMs, and planned vs. actual PMs. Completed PMs are analyzed for a user-specified date range. You can choose whether to include completed PMs, open PMs, or cancelled PMs.
One View PM is delivered with five pre-defined reports. These reports include: Completed PMs, Upcoming PMs, Overdue PMs, PMs - Planned vs. Actual, and PM Key Metrics Analysis. With these delivered reports, you can see Percentage Due, Days Between Service, Percentage Fulfillment (a measure of how well your actual PMs adhered to your planned maintenance schedule), Days Till Planned Date (a measure of overdue), and counts of PMs.
13.4.2 Special Processing
When working with One View PM Analysis, keep the following in mind:
-
To analyze completed PMs, you must specify a date range in the header.
-
You can select to include completed PMs, open PMs, or cancelled PMs using the check boxes in the header.
-
The records that appear in the grid are the F1207 records that match your filter criteria.
13.4.3 Reports
The reports delivered with the One View PM Analysis application are:
-
Completed PMs
-
Upcoming PMs
-
Overdue PMs
-
Planned vs. Actual
-
PM Key Metrics Analysis
13.4.3.1 Completed PMs
Use this report to analyze information related to completed PMs. Completed PMs are those with a date in the Completed Date field and a Status of "99." Information includes Days Between Service (this is the number of days from Completed Date minus Last Completed Date), Average Percentage Due by Service Type, Average Percentage Due by Assigned To (the technician), Average Percentage Due by Site, and Average Percentage Due by Equipment Number.
This report contains the following components:
-
Average Percentage Due of Completed PMs by Service Type (horizontal bar graph)
-
Average Percentage Due of Completed PMs by Service Type (table)
-
Completed PMs by Equipment for Each Service Type (table)
-
Average Percentage Due of Completed PMs by Assigned To (horizontal bar graph)
-
Average Percentage Dues by Assigned To (table)
-
Completed PMs by Assigned To for Each Service Type (by Assigned To, Service Type) (table)
-
Average Percentage Due of Completed PMs by Site (horizontal bar graph)
-
Average Percentage Due by Site (table)
-
Completed PMs by Assigned To for Each Site (by Site, Service Type) (table)
-
Completed PMs by Service Type for Each Equipment (table)
This report contains drill back functionality as described in the following table:
| Functionality | Value |
|---|---|
| Table column containing drill back link | Service Type |
| Table columns passed to application | Equipment No, Service Type |
| Application called | Preventive Maintenance Backlog (P12071) |
| Form called | W12071A |
| Version called | ZJDE0001 |
13.4.3.2 Upcoming PMs
Use this report to analyze information related to upcoming or open PMs. Upcoming PMs are those that are not cancelled or completed (status not equal to "99" or "98"). Information includes count by Site, Service Type, and Assigned To (the technician), Average Percentage Due by Site and Service Type. There is also tabular presentation of upcoming PMs by Service Type and Equipment that includes Days Till Planned Date (measure of days overdue if negative) and Percentage Due along with additional information.
This report contains the following components:
-
Number of Upcoming PMs by Site (horizontal bar graph)
-
Number of Upcoming PMs by Site (table)
-
Upcoming PMs by Site (by Site, Service Type/Description) (table)
-
Number of Upcoming PMs by Assigned To (horizontal bar graph)
-
Number of Upcoming PMs by Assigned To (table)
-
Number of Upcoming PMs by Service Type (horizontal bar graph)
-
Number of Upcoming PMs by Service Type (table)
-
Average Percentage Due of Upcoming PMs by Service Type (horizontal bar graph)
-
Average Percentage Due of Upcoming PMs by Service Type (table)
-
Upcoming PMs by Service Type (table)
-
Upcoming PMs by Equipment (table)
This report contains drill back functionality as described in the following table:
| Functionality | Value |
|---|---|
| Table column containing drill back link | Equipment Number |
| Table columns passed to application | Equipment No, Service Type |
| Application called | Preventive Maintenance Backlog (P12071) |
| Form called | W12071A |
| Version called | ZJDE0001 |
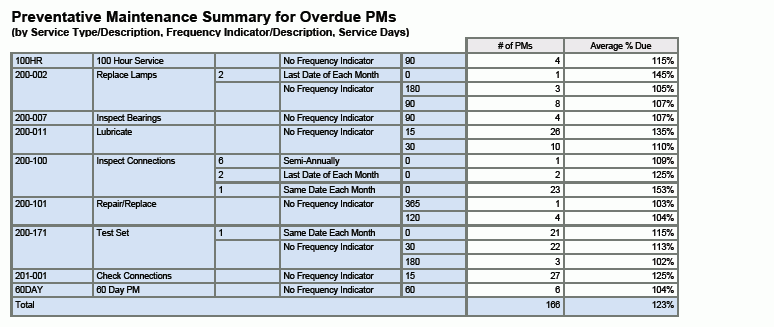
13.4.3.3 Overdue PMs
This is the exact same report as Upcoming PMs except that it only includes those open PMs with a Percentage Due greater than 100%.
This report contains the following components:
-
Number of Overdue PMs by Site (horizontal bar graph)
-
Number of Overdue PMs by Site (table)
-
Overdue PMs by Site (by Site, Service Type/Description) (table)
-
Number of Overdue PMs by Assigned To (horizontal bar graph)
-
Number of Overdue PMs by Assigned To (table)
-
Number of Overdue PMs by Service Type (horizontal bar graph)
-
Number of Overdue PMs by Service Type (table)
-
Average Percentage Due of Overdue PMs by Service Type (horizontal bar graph)
-
Overdue PMs by Service Type (table)
-
Overdue PMs by Equipment (table)
This report contains drill back functionality as described in the following table:
| Functionality | Value |
|---|---|
| Table column containing drill back link | Service Type |
| Table columns passed to application | Equipment No, Service Type |
| Application called | Preventive Maintenance Backlog (P12071) |
| Form called | W12071A |
| Version called | ZJDE0001 |
13.4.3.4 Planned vs. Actual
This report provides information related to the concept of percentage fulfillment. Percentage fulfillment is a measure of how often you actually performed the service indicated in the PMs with what you had planned. For example, if you had planned for four tire rotations in a year and actually performed three then your percentage fulfillment would be 75%. The average percentage fulfillment by Service Type is reported.
This report contains the following components:
-
Average PM Fulfillment by Service Type (horizontal bar graph)
-
Preventative Maintenance Fulfillment Summary (by Service Type/Description, Frequency Indicator, Service Days) (table)
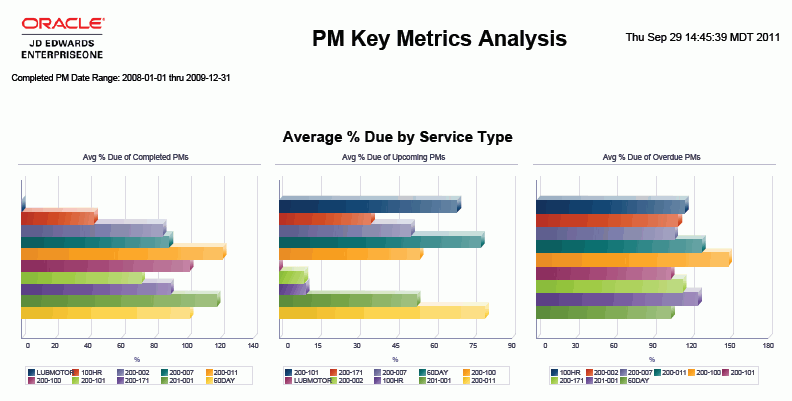
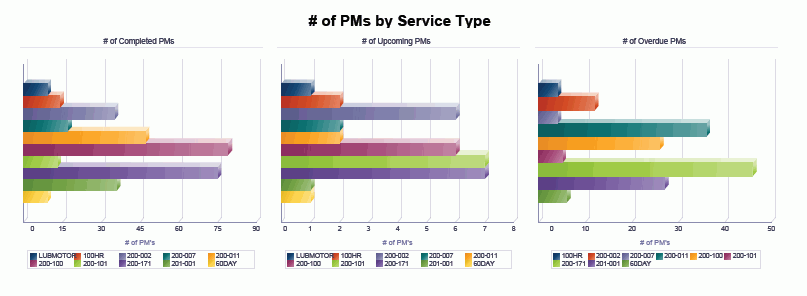
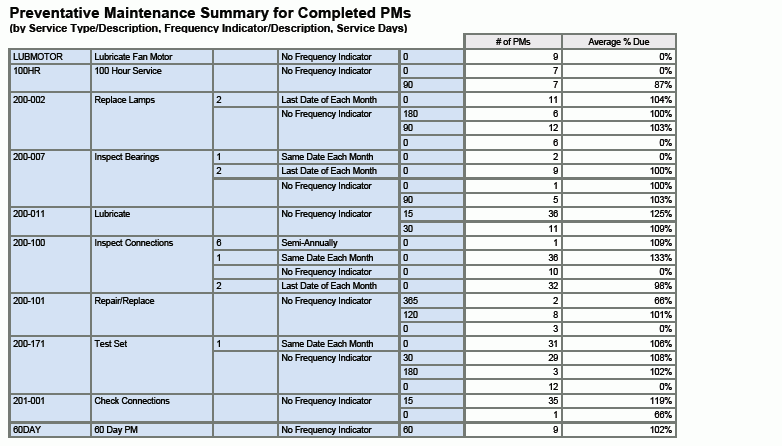
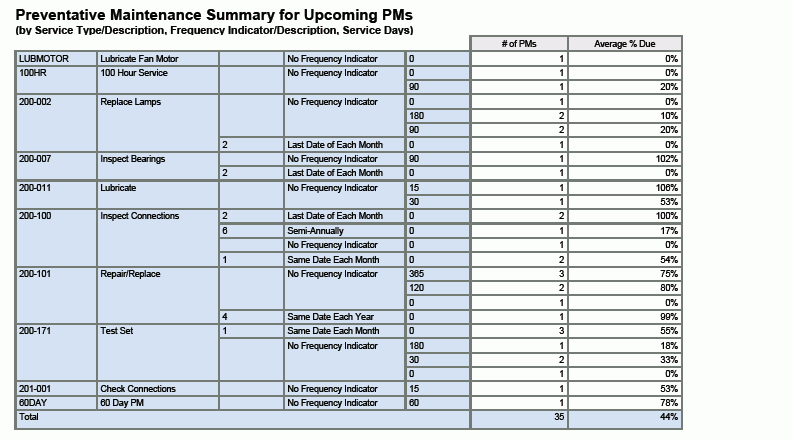
13.4.3.5 PM Key Metrics Analysis
This report is a summation of the key information from the other PM reports. It presents a comparison of the Average Percentage Due and the count of PMs by Service Type across completed, upcoming, and overdue PMs.
This report contains the following components:
-
Average Percentage Due of Completed PMs by Service Type (horizontal bar graph)
-
Average Percentage Due of Upcoming PMs by Service Type (horizontal bar graph)
-
Average Percentage Due of Overdue PMs by Service Type (horizontal bar graph)
-
Number of Completed PMs by Service Type (horizontal bar graph)
-
Number of Upcoming PMs by Service Type (horizontal bar graph)
-
Number of Overdue PMs by Service Type (horizontal bar graph)
-
Preventative Maintenance Summary for Completed PMs (by Service Type/Description, Frequency Indicator/Description, Service Days) (table)
-
Preventative Maintenance Summary for Upcoming PMs (by Service Type/Description, Frequency Indicator/Description, Service Days) (table)
-
Preventative Maintenance Summary for Overdue PMs (by Service Type/Description, Frequency Indicator/Description, Service Days) (table)
The following report was generated by using this criteria:
-
Completed PM Analyze Dates = 01/01/2008 through 12/31/2009
-
Include Completed PMs check box is selected.
-
Include Open PMs check box is selected.
-
Include Cancelled PMs check box is not selected.

13.5 One View Equipment Location Inquiry (P13230)
Access One View Equipment Location Inquiry (P13230) from the Equipment Location Tracking (G1314) menu. Use One View Equipment Location Inquiry to analyze the equipment at a specific location and to analyze the locations for a specific piece of equipment. One View Equipment Location Inquiry uses the One View Equipment Location Inquiry (F1201-F1217-F1204) business view (V13230), which includes columns from the F1201, the Equipment Master Extension table (F1217), and the Location Tracking table (F1204). This application provides a wealth of data and is extremely flexible in the types of reports that can be generated. Choose from over 200 columns in the business view, and additional calculated columns in the grid related to location information, such as Days At Location, to analyze your equipment by location, your location by equipment, your equipment status distribution by location, and the equipment location status distribution by equipment. Along with some delivered reports, One View Equipment Location Inquiry can provide reports for many purposes. Some examples include analysis by Product Model, Product Family, Category Codes, and by status, and analyzing current or historical equipment location information.
One View Equipment Location Inquiry is delivered with several pre-defined reports. These reports are Location By Equipment, Equipment By Location, Equipment Status History by Location, and Equipment Location Analysis. With these delivered reports, you can see the history of your equipment at various locations over a specified time range and the status of that equipment at each location. You perform analysis by location, equipment, status, product family, and product model. Information analyzed includes the number of days equipment is at each location, the number of times it was at specific locations, and the average number of days it spent at each location. You can choose to include only current equipment location information, only historical equipment location information, or both.
13.5.2 Special Processing
When working with One View Equipment Location Inquiry:
-
Future planned (P) locations are not included in the One View Equipment Location Inquiry. Only current (C) and historical (H) F1204 records are included.
-
If not specified, the Location Analyze Date Range uses an open beginning date and today's date as the end date. Today's Date is the maximum value through which you can analyze.
-
The records that appear in the grid are the individual F1204 records, with additional related information from the F1201 and F1217.
-
The Days at Location calculation is based on the individual F1204 record's Analyze Begin and End Date as this can be different than the Header Analyze Date Range.
-
The Record Analyze Begin Date equals the latter of the record's Begin Date or the Analyze Begin Date from the header.
The Record Analyze End Date equals the earlier of the record's Ending Date or the Analyze End Date in the header. However, if there is no record Ending Date, the Analyze End Date from the header is used.
The Days at Location = [Record's Analyze End Date + 1] minus [Record's Analyze Begin Date]. The exception is when the Record's Analyze End Date is equal to the record's Ending Date, in that case it is [Record's Analyze End Date] minus [Record's Analyze Begin Date].
13.5.3 Reports
The reports delivered with the One View Equipment Location Inquiry application are:
-
Location by Equipment
-
Equipment by Location
-
Equipment Status History by Location
-
Equipment Location Analysis
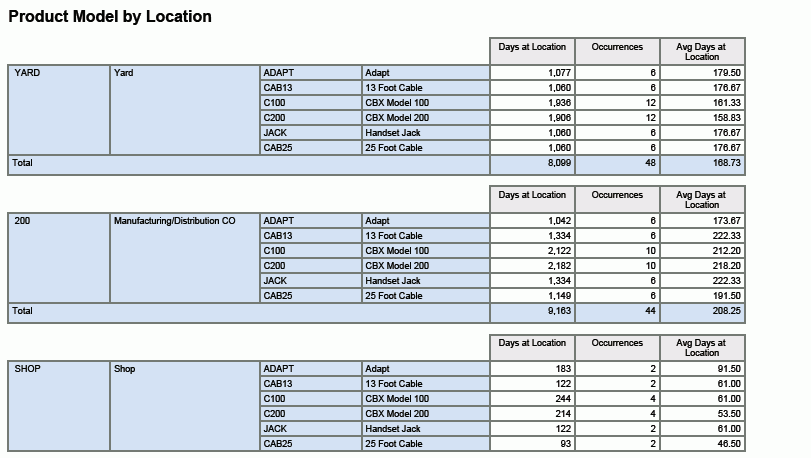
13.5.3.1 Location by Equipment
Use this report to analyze equipment at each location and to compare locations. It is analyzed by Product Family and by Product Model. It also shows, for each Product Family and each Product Model, the locations where that equipment has been.
This report contains the following components:
-
Total Equipment Days by Product Family by Location (horizontal bar graph)
-
Total Equipment Days by Product Model by Location (horizontal bar graph)
-
Equipment Product Family/Model By Location (table)
-
Total Days at Each Location by Product Family (horizontal bar graph)
-
Total Days at Each Location by Product Model (horizontal bar graph)
-
Equipment Product Family/Model By Location (table)
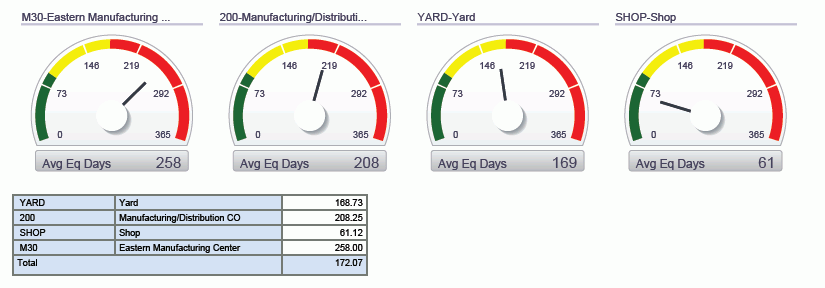
13.5.3.2 Equipment by Location
This report shows, for each location, the equipment that has been there the longest and the average equipment days at each location. Equipment Days are the number of days a piece of equipment is at a location.
This report contains the following components:
-
Top 10 Equipment Days at Location (horizontal bar graph)
-
Individual Equipment Numbers (table)
-
Average Number of Equipment Days by Location (gauges)
-
Equipment by Location Detail (table)
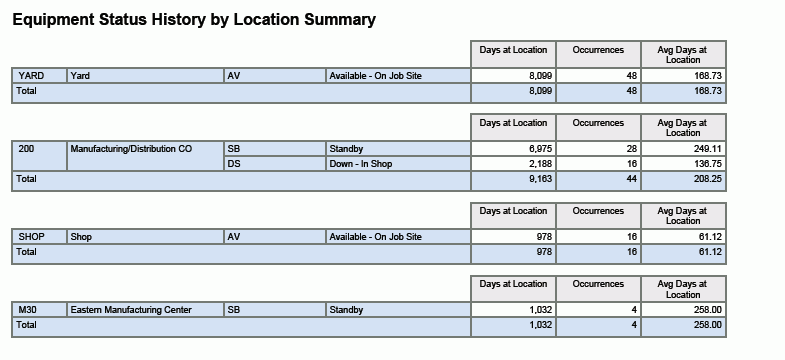
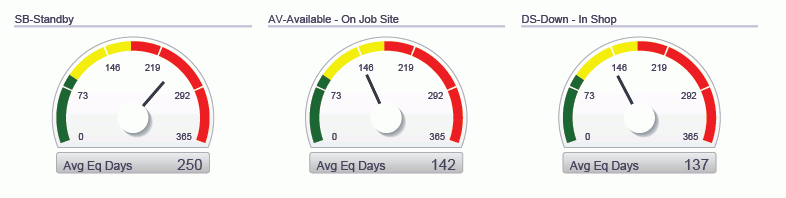
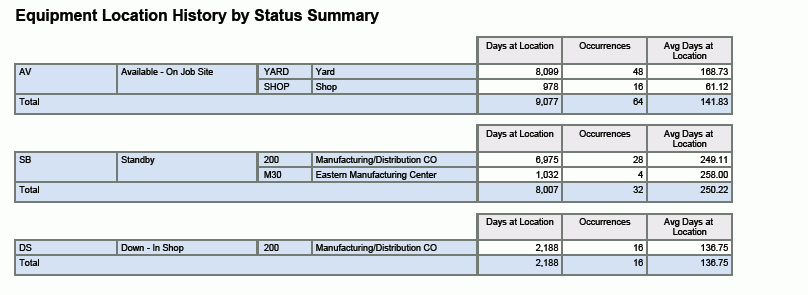
13.5.3.3 Equipment Status History by Location
This report shows the various statuses that a piece of equipment has been at while at a specific location and for how long it was at that status. It also shows the distribution of locations for each status so that you can see which locations have equipment at a specific status the most. The reported status is the historical status on the location record.
This report contains the following components:
-
Equipment Status Distribution by Location (pie charts)
-
Equipment Status Distribution by Location (table)
-
Equipment Location Distribution by Status (pie charts)
-
Average Number of Equipment Days by Status (gauges)
-
Equipment Location Distribution by Status (table)
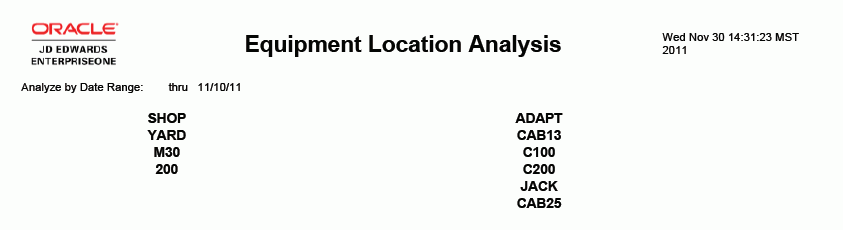
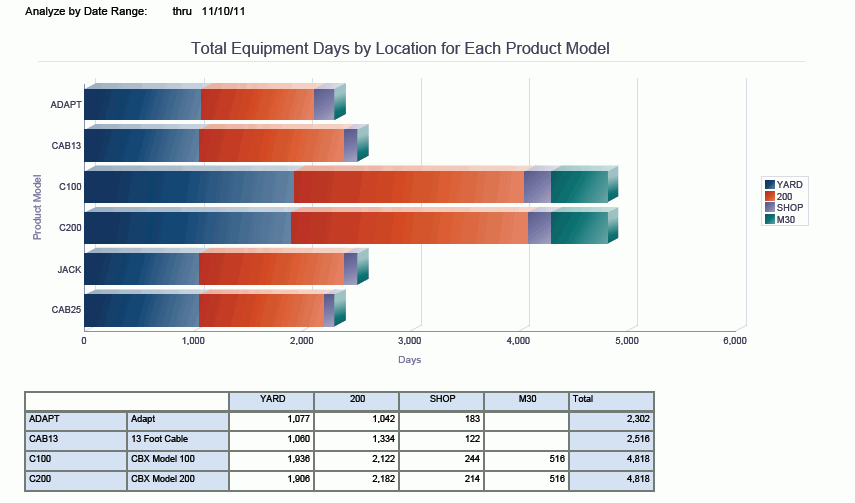
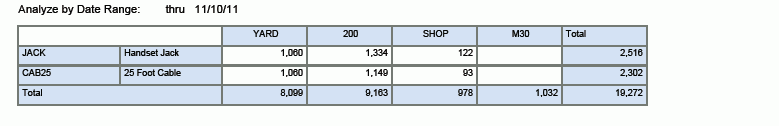
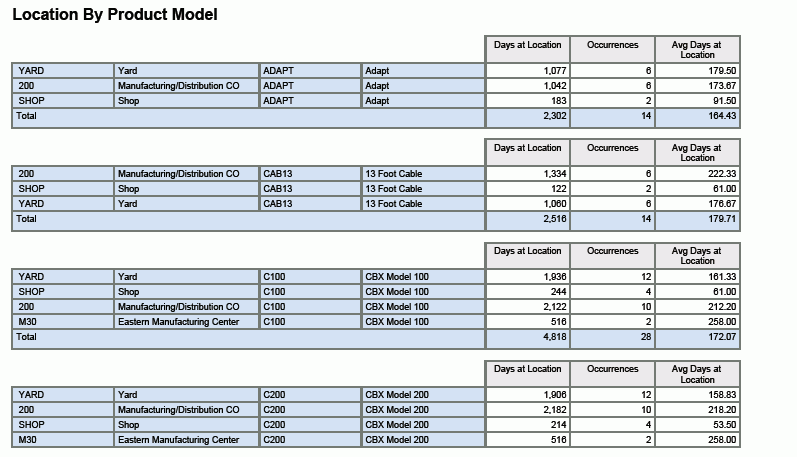
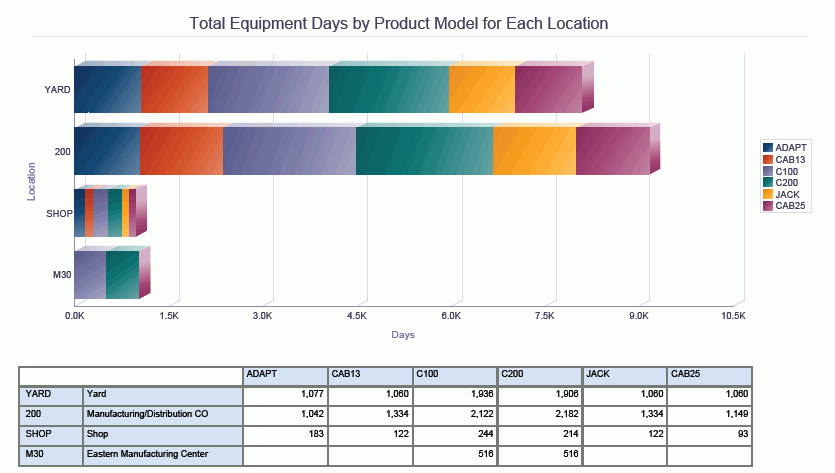
13.5.3.4 Equipment Location Analysis
Equipment Location Analysis is a summary report that shows the key metrics from the three prior reports. It shows the results of an analysis by Product Model and by Status for each location.
This report contains the following components:
-
Total Equipment Days by Location for Each Product Model (horizontal bar graph)
-
Location By Product Model (table)
-
Total Equipment Days by Product Model for Each Location (horizontal bar graph)
-
Product Model by Location (table)
-
Average Number of Equipment Days by Location (gauges)
-
Equipment Status History by Location Summary (table)
-
Average Number of Equipment Days by Equipment Status (gauges)
-
Equipment Location History by Status Summary (table)
The following report was generated by using this criteria:
-
Location Analyze Date Range = open through 10/12/2011
-
Include Current Location Records check box is selected.
-
Include Historical Location Records check box is selected.
-
Advanced Query set up as Location = SHOP, YARD, M30, and 200