14 One View Reporting for Manufacturing Management
This chapter provides overview information, processing options, special processing, and reports for the following applications:
-
Section 14.1, "One View Work Order Cost Analysis Inquiry (P48270)"
-
Section 14.2, "One View Manufacturing Dispatch Inquiry (P48280)"
14.1 One View Work Order Cost Analysis Inquiry (P48270)
Access the One View Work Order Cost Analysis Inquiry application (P48270) from the Periodic Functions Discrete (G3121) menu. Use One View Work Order Cost Analysis Inquiry to analyze cost variances of closed work orders. One View Work Order Cost Analysis Inquiry uses the One View Work Order Cost Analysis Inquiry (F4801, F3102, F3111) business view (V48270A), which includes columns from the Work Order Master File table (F4801), Production Cost table (F3102) and Work Order Parts List table (F3111). It also uses the Work Order Routing table (F3112) to fetch additional information. This application provides a wealth of data and is extremely flexible in the types of reports that can be generated. Choose from over 235 columns in the business view to analyze your work orders by item. You can also filter by branch, priority, dates, quantities, and cost types. Along with some delivered reports, One View Work Order Cost Analysis Inquiry can provide reports for many purposes. Some examples include Cost Analysis by Manager, Supervisor, Vendor, Category Codes, Amounts, and Variances.
One View Work Order Cost Analysis Inquiry is delivered with several predefined reports. These reports are Calculated Actual Variance, Calculated Engineering Variance, Calculated Planned Variance, and the Calculated Variances Analysis. With these delivered reports, you can see by work order where the defined variances are occurring. You can see Work In Process or Completed Work Order variances. The Calculated Variances Analysis interactive report gives you a comparison of the different type of variances by branch, item and cost type.
14.1.1 Processing Options
Processing options enable you to specify the default processing for programs and reports.
14.1.1.1 Process
- 1. Perform Primary Unit of Measure Quantity Conversions
-
Specify whether the Order Quantities are converted to Primary UOM. If this process is bypassed, all Primary UOM Order Quantities grid columns will be hidden.
Values are:
Blank: Do not convert Order Quantities to Primary UOM.
1: Convert Order Quantities to Primary UOM.
- 2. Variance Flag
-
Specify which Variance Flag is used for Data Selection.
Values are:
Blank: WO is open, no Manufacturing Accounting has run.
1: WO that has had Mfg Accounting run against it.
2: WO that has had Approved Variances Calculated.
3: WO that is closed, variances have been run.
4: Lean Transaction is Closed.
- 3. Display Routing Information (F3112)
-
Specify whether the Work Order Routing Information (F3112) is displayed on the grid or not.
Values are:
Blank: Do not display Work Order Routing Information (F3112)
1: Display Work Order Routing Information on the Grid.
14.1.2 Special Processing
Use the processing options to display primary unit of measure conversions and routing information by sequence number, if desired.
You can also select which variance flag to use for data selection in the processing options. However, it is recommended that Variance Flag = 3 for the best results.
14.1.3 Reports
The reports delivered with the One View Work Order Cost Analysis Inquiry application are:
-
Calculated Actual Variance
-
Calculated Engineering Variance
-
Calculated Planned Variance
-
Calculated Variances Analysis
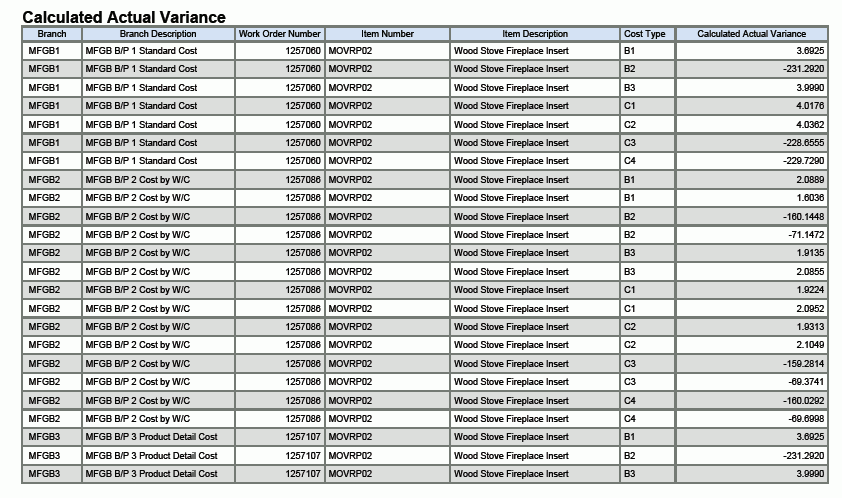
14.1.3.1 Calculated Actual Variance
This report provides the actual variances that exist between planned costs and actual costs for each branch or item/branch combination. The report also shows details of the work order and the breakdown of the variances based on cost type.
This report contains the following components:
-
Calculated Actual Variance Greater Than Zero - by Branch (pie chart)
-
Calculated Actual Variance Greater Than Zero - by Item/Branch (bar graph)
-
Calculated Actual Variance Less Than Zero - by Item/Branch (bar graph)
-
Calculated Actual Variance (table)
The Calculated Actual Variance table component contains drill back functionality as described in the following table:
| Functionality | Value |
|---|---|
| Table column containing drill back link | Work Order Number |
| Table columns passed to application | Work Order Number |
| Application called | Production Cost Inquiry (P31022) |
| Form called | W31022A |
| Version called | ZJDE0001 |
14.1.3.2 Calculated Engineering Variances
This report provides the engineering variances that exist between frozen costs and current costs for each branch or item/branch combination. The report also displays details of the work order and the breakdown of the variances based on cost type.
This report contains the following components:
-
Engineering Variances by Branch (pie chart)
-
Engineering Variance Greater Than Zero - by Item/Branch (bar graph)
-
Engineering Variance Less Than Zero - by Item/Branch (bar graph)
-
Engineering Variance by Item/Branch (bar graph)
-
Calculated Engineering Variance by Branch (table)
The Calculated Engineering Variance by Branch table component contains drill back functionality as described in the following table:
| Functionality | Value |
|---|---|
| Table column containing drill back link | Work Order Number |
| Table columns passed to application | Work Order Number |
| Application called | Production Cost Inquiry (P31022) |
| Form called | W31022A |
| Version called | ZJDE0001 |
14.1.3.3 Calculated Planned Variance
This report provides the planned variances that exist between current costs and planned costs for each branch or item/branch combination. The report also displays details of the work order and the breakdown of the variances based on cost type.
This report contains the following components:
-
Calculated Planned Variance by Branch (pie chart)
-
Calculated Planned Variance Greater Than Zero - by Item/Branch (bar graph)
-
Calculated Planned Variance (table)
The Calculated Planned Variance table component contains drill back functionality as described in the following table:
| Functionality | Value |
|---|---|
| Table column containing drill back link | Work Order Number |
| Table columns passed to application | Work Order Number |
| Application called | Production Cost Inquiry (P31022) |
| Form called | W31022A |
| Version called | ZJDE0001 |
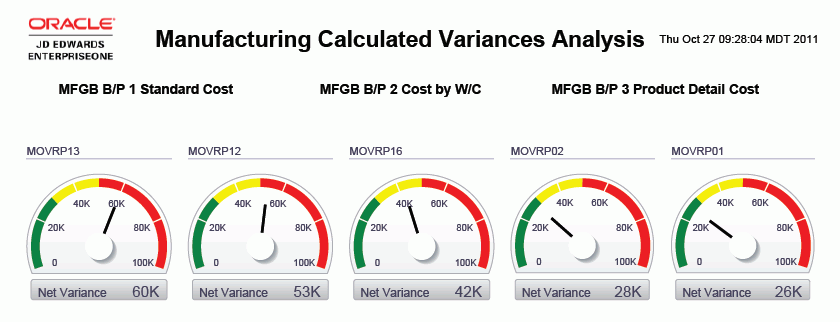
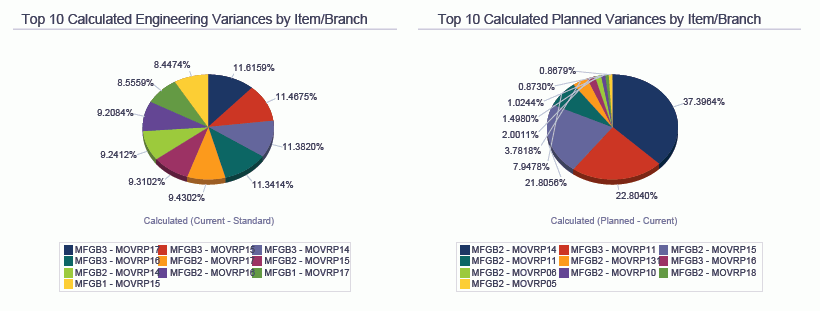
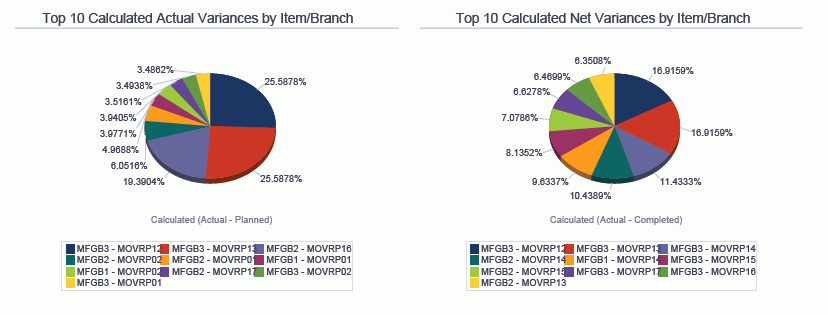
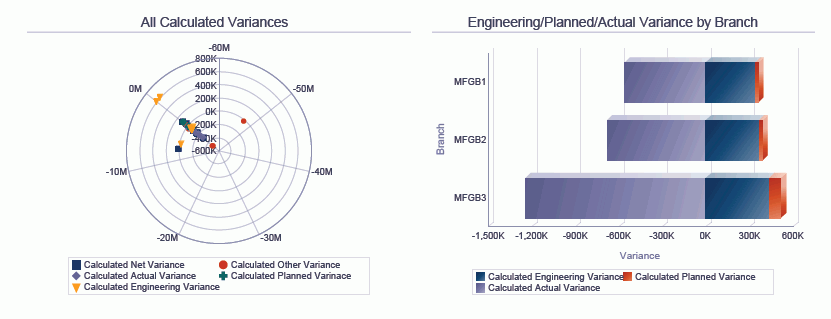
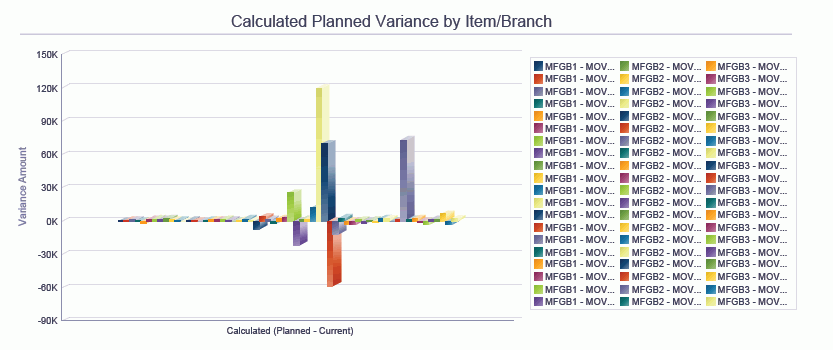
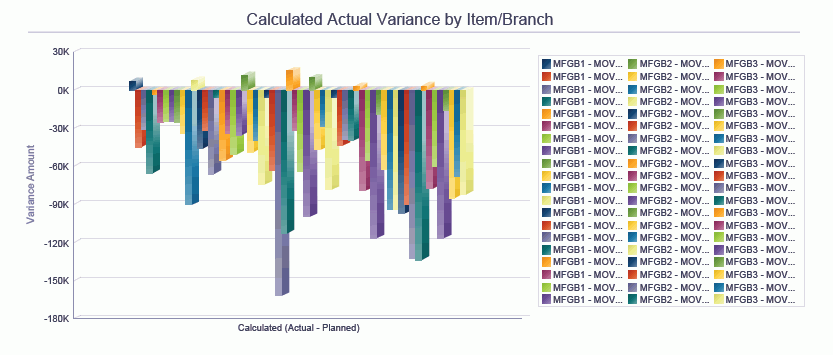
14.1.3.4 Calculated Variances Analysis
This report enables you to analyze variances in depth across your branches. This interactive report gives you complete control over the information shown on the graphs, charts, and table by providing filtering by branch and item/branch.
This report contains the following components:
-
Top Net Variance by Branch/Plant and Item Number (gauges)
-
Calculated Engineering Variance by Item/Branch (pie chart)
-
Calculated Planned Variance by Item/Branch (pie chart)
-
Calculated Actual Variance by Item/Branch (pie chart)
-
Calculated Net Variance by Item/Branch (pie chart)
-
All Calculated Variances (polar graph)
-
Engineering/Planned/Actual Variance by Branch (horizontal bar graph)
-
Calculated Planned Variance by Item/Branch (bar graph)
-
Calculated Actual Variance by Item/Branch (bar graph)
-
Calculated Actual Variance (table)
The Calculated Actual Variance table component contains drill back functionality as described in the following table:
| Functionality | Value |
|---|---|
| Table column containing drill back link | Work Order Number |
| Table columns passed to application | Work Order Number |
| Application called | Production Cost Inquiry (P31022) |
| Form called | W31022A |
| Version called | ZJDE0001 |
The following report was generated by using data selection for company, branch, and work order dates to limit the data to a manageable number of records.
14.2 One View Manufacturing Dispatch Inquiry (P48280)
Access the One View Manufacturing Dispatch Inquiry application (P48280) from the Daily Order Preparation - Discrete (G3111) menu. Use One View Manufacturing Dispatch Inquiry to analyze open work orders by machine status. One View Manufacturing Dispatch Inquiry uses the One View Manufacturing Dispatch Inquiry (F4801, F4801T, F3112) business view (V48280), which includes columns from the F4801, Work Order Master Tag File table (F4801T), F3112, and Document Type Master (F40039). The Work Order Parts List (F3111) is also used to fetch information. This application provides a wealth of data and is extremely flexible in the types of reports that can be generated. Choose from over 165 columns in the business view to analyze your open work orders (for example, by user-defined periods, branch, and work center). You can also filter by WO number, WO status, parent item, dates, quantities, work center/machine/labor/setup).
Along with some delivered reports, One View Manufacturing Dispatch Inquiry can provide reports for many purposes. Some examples include Open Work Order By Category, Open Work Order by Unaccounted Labor/Scrap, Open Work Order By Manager/Supervisor, and Open Work Order by Flash Message.
One View Manufacturing Dispatch Inquiry is delivered with several predefined reports. These reports are Open Work Order By Item Number, Open Work Order By Operation Sequence, Open Work Order By Work Center, and Open Work Order Labor by Operation Status Analysis. With these delivered reports, you can see how labor has been spread by branch, work center or item. You can also see what has already been completed and how much remains to be finished. The Open Work Order Labor by Operation Status Analysis interactive report gives you an even broader view of your labor by providing multiple views of the same data broken down by branch, item, status, work center and order number.
14.2.1 Processing Options
Processing options enable you to specify the default processing for programs and reports.
14.2.1.1 Processing
- 1. Quantity Calculation
-
Specify whether the system subtracts the quantity scrapped from the remaining quantity.
Values are:
Blank: Include the quantity scrapped in the remaining quantity.
1: Subtract the quantity scrapped from the remaining quantity.
- 2. Primary Unit of Measure Conversion
-
Specify whether the Order Quantities are converted to Primary UOM. If this process is bypassed, all Primary UOM Order Quantities grid columns will be hidden.
Values are:
Blank: Do not convert Order Quantities to Primary UOM.
1: Convert Order Quantities to Primary UOM.
- 3. Number of Days to Use Per Period
-
Specify the number of days to be used for each Display Period. The Default is 30 Days.
- 4. Number of Days Maximum to Display
-
Specify the maximum number of days to be used for display. The default is 120 Days.
- 5. Select Start Date or Request Date to use in the calculation of the Maximum Number of Days.
-
Specify which date to use as a beginning date to calculate the Maximum Number of Days. The default is to use the Start Date.
Values are:
Blank: Start Date
1: Request Date
- 6. Enter 1 to Display Parts List Information (F3111)
-
Specify whether the work order parts list information (F3111) is displayed on the grid or not.
Values are:
Blank: Do not display work order parts list Information (F3111)
1: Display work order parts list information in the grid.
14.2.3 Reports
The reports delivered with the One View Manufacturing Dispatch Inquiry application are:
-
Open Work Orders by Item Number
-
Open Work Orders by Operation Status
-
Open Work Orders by Work Center
-
Work Order Labor by Operation Status Analysis
14.2.3.1 Open Work Orders by Item Number
This report provides a view of all open work orders sorted by end item number and enables you to view all labor and machine time that is remaining per operation.
This report contains the following components:
-
Labor Remaining for Items by Operation Status (bar graph)
-
Machine Labor Remaining for Items by Operation Status (bar graph)
-
SetupLabor Remaining for Items by Operation Status (bar graph)
-
Labor Remaining by Item and Operation Status (three-dimensional bar graph)
-
Remaining Quantity by Branch and Work Order Number (table)
The Remaining Quantity by Branch and Work Order Number table component contains drill back functionality as described in the following table:
| Functionality | Value |
|---|---|
| Table column containing drill back link | Work Order Number |
| Table columns passed to application | Work Order Number |
| Application called | Production History (P31227) |
| Form called | W31227B |
| Version called | ZJDE0001 |
14.2.3.2 Open Work Orders by Operation Status
This report enables you to view all open work orders by the operation status on the work order routing. You can view the number of work orders and all of the actual time (labor and machine) that has been reported at that operation. Also, you can view if there is an inefficient or overburdened operation that is holding up work orders based on the percentage of routing steps at a particular operation status.
This report contains the following components:
-
Number of Work Orders by Operation Status (bar graph)
-
Actual Run Labor by Operation Status (bar graph)
-
Actual Run Machine by Operation Status (bar graph)
-
Actual Setup Labor by Operation Status (bar graph)
-
Open Orders by Operation Status (pie chart)
-
Actual Labor by Branch, Work Order Number, and Operation Status (table)
The Actual Labor by Branch, Work Order Number, and Operation Status table component contains drill back functionality as described in the following table:
| Functionality | Value |
|---|---|
| Table column containing drill back link | Work Order Number |
| Table columns passed to application | Work Order Number |
| Application called | Production History (P31227) |
| Form called | W31227B |
| Version called | ZJDE0001 |
14.2.3.3 Open Work Orders by Work Center
This report enables you to view all open work orders by the work center that is defined on the work order routing based on a period interval. You can view the actual time (labor and machine) reported against the work center for that order, and you can view the percentage of work orders for a particular work center.
This report contains the following components:
-
Number of Work Orders by Work Center and Interval Periods (bar graph)
-
Work Center Actual Run Labor by Period Intervals (bar graph)
-
Work Center Actual Machine Labor by Period Intervals (bar graph)
-
Work Center Actual Setup Labor by Period Intervals (bar graph)
-
Open Orders by Work Center (pie chart)
-
Actual Labor by Labor by Work Center, Work Order Number (table)
The Actual Labor by Labor by Work Center, Work Order Number table component contains drill back functionality as described in the following table:
| Functionality | Value |
|---|---|
| Table column containing drill back link | Work Order Number |
| Table columns passed to application | Work Order Number |
| Application called | Production Status (P31226) |
| Form called | W31226F |
| Version called | ZJDE0001 |
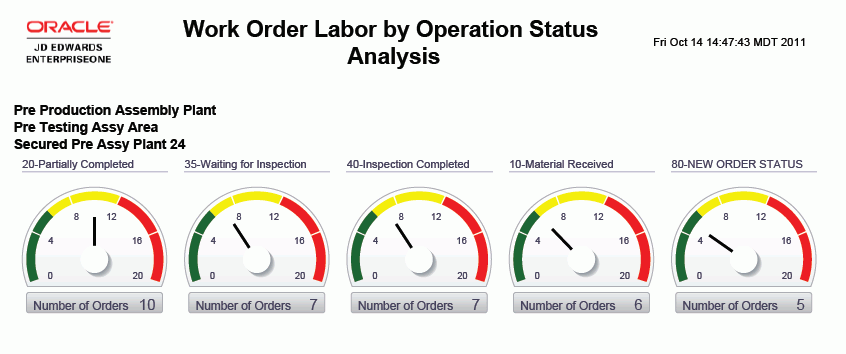
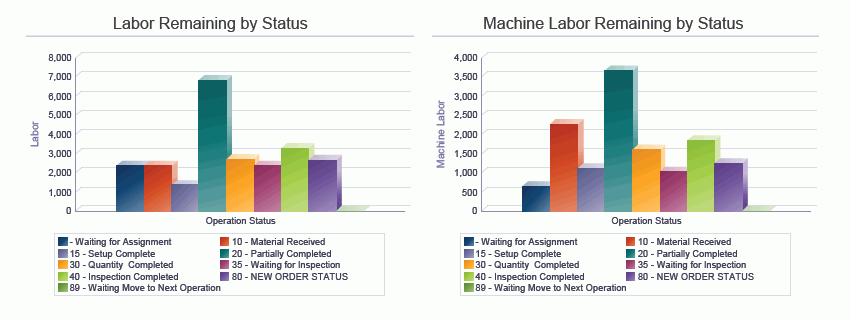
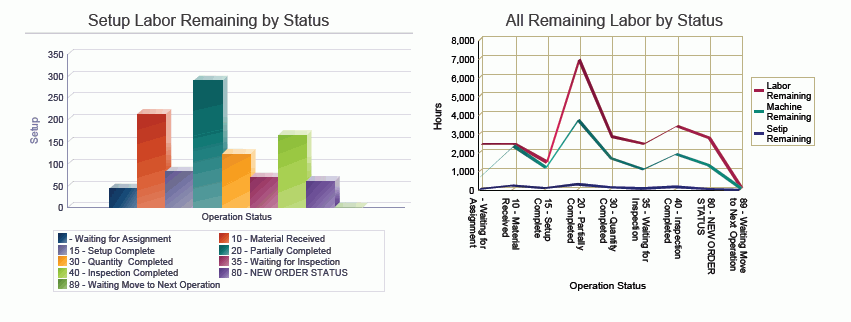
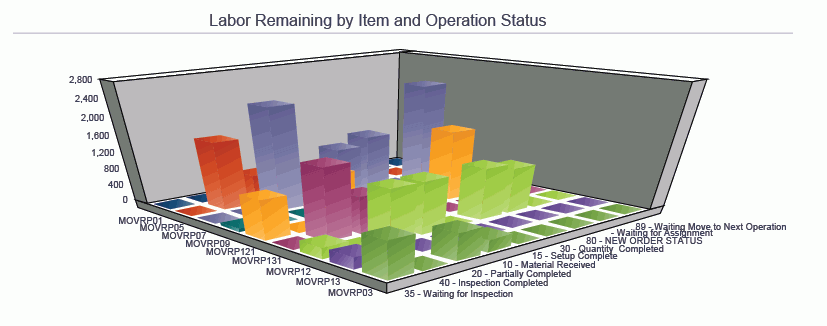
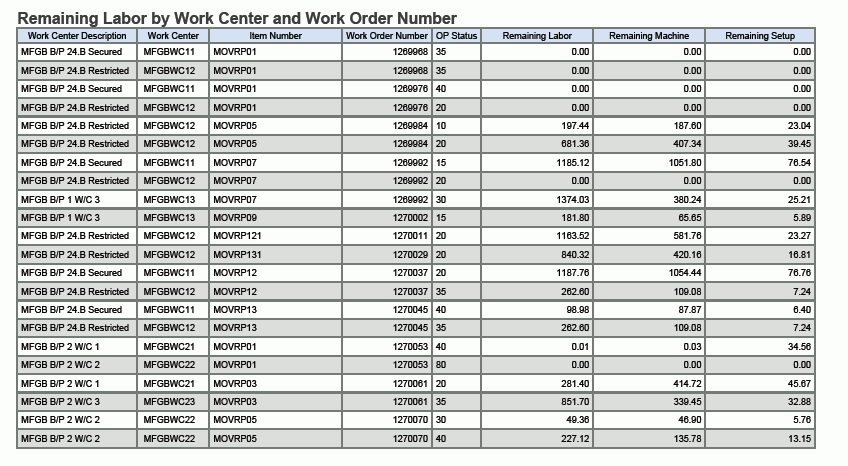
14.2.3.4 Work Order Labor by Operation Status Analysis
This report enables you to analyze variances in depth across your Branches. This interactive report gives you complete control over the information shown on the graphs, charts, and table by providing filtering by Operation Status, Types of Labor/Machine Hours, and Item Number.
This report contains the following components:
-
Number of Orders by Status (gauges)
-
Labor Remaining by Status (bar graph)
-
Machine Labor Remaining by Status (bar graph)
-
Setup Labor Remaining by Status (bar graph)
-
All Remaining Labor by Status (line graph)
-
Labor Remaining by Item and Operation Status (three-dimensional bar graph)
-
Remaining Labor by Work Center and Work Order Number (table)
The Remaining Labor by Work Center and Work Order Number table component contains drill back functionality as described in the following table:
| Functionality | Value |
|---|---|
| Table column containing drill back link | Work Order Number |
| Table columns passed to application | Work Order Number, Work Center |
| Application called | Production History (P31227) |
| Form called | W31227B |
| Version called | ZJDE0001 |
The following report was generated by using data selection for company, work order dates, and a variance flag less than three to limit the data to a manageable number of records.
14.3 One View Planning Analysis Inquiry (P48290)
Access the One View Planning Analysis Inquiry application (P48290) from the DRP Daily Operations (G3411), MPS Daily Operations (G3412), MRP Daily Operations (G3413), and Multi-Facility Planning Daily Operations (G3414) menus.Use One View Planning Analysis Inquiry to analyze material planning transactions. One View Planning Analysis Inquiry uses the One View Planning Analysis (F3411-F4102) business view (V3411N), which includes columns from the MPS/MRP/DRP Message File table (F3411) and the Item Branch File table (F4102). This application provides a wealth of data and is extremely flexible in the types of reports that can be generated. Choose from over 50 columns in the business view to analyze your supply and demand messages.
One View Planning Analysis Inquiry is delivered with several predefined reports. These reports are Messages By Buyer, Messages By Planner, and Messages By Planning Family. With these delivered reports, you can see your supply and demand messages organized by those three roles.
14.3.1 Processing Options
Processing options enable you to specify the default processing for programs and reports.
14.3.2 Special Processing
This application contains the following special processing:
-
Messages for items defined as lean manufacturing are not displayed.
-
Messages for items defined as Kanban are not displayed.
-
The Number of Days is retrieved from the processing option value. The minimum value is one and the maximum value is 365. This value defines the size of the immediate period.
-
The Maximum Number of Days is retrieved from the processing option value. The minimum value is one and the maximum value is 365. This value defines the range of messages to include in the grid results.
14.3.3 Reports
The reports delivered with the One View Planning Analysis Inquiry application are:
-
Messages by Buyer
-
Messages by Planner
-
Messages by Planning Family
14.3.3.1 Messages by Buyer
This report enables you to view your planning purchasing messages based on buyer number. You can see the number of messages, the number of types of messages and the percentage of message counts for each buyer. You can also view the number of messages based on periods.
This report contains the following components:
-
Purchase Order Message Count by Buyer (horizontal bar graph)
-
Pending Action by Message Type (horizontal bar graph)
-
Percentage of Message Count by Buyer (pie chart)
-
Message Load by Buyer by Period (bar graph)
-
Message Details by Buyer (table)
14.3.3.2 Messages by Planner
This report enables you to view your planning messages based on planner number. You can see the number of messages, the number of types of messages, and the percentage of message counts for each planner. You can also view the number of messages based on periods.
This report contains the following components:
-
Purchase Order Message Count by Planner (horizontal bar graph)
-
Pending Action by Message Type (horizontal bar graph)
-
Percentage of Message Count by Planner (pie chart)
-
Message Load by Planner by Period (bar graph)
-
Message Details by Planner (table)
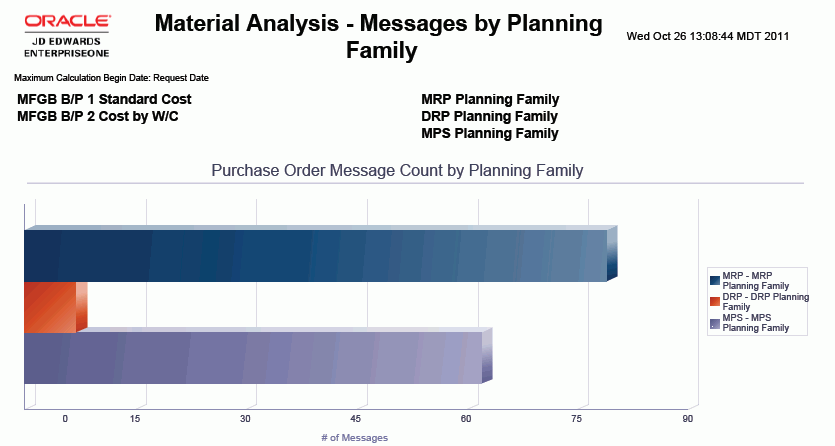
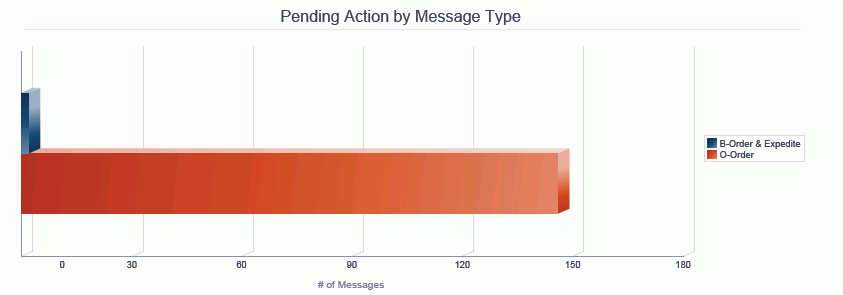
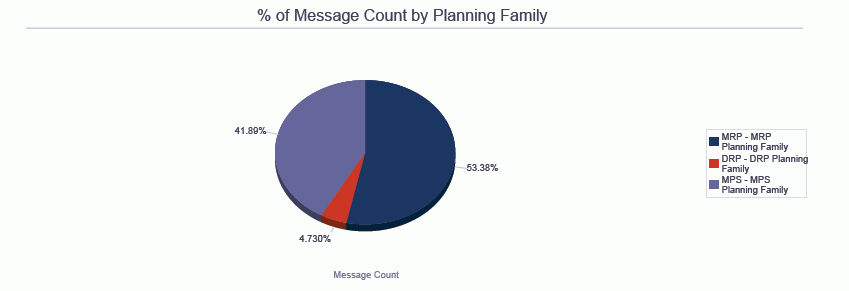
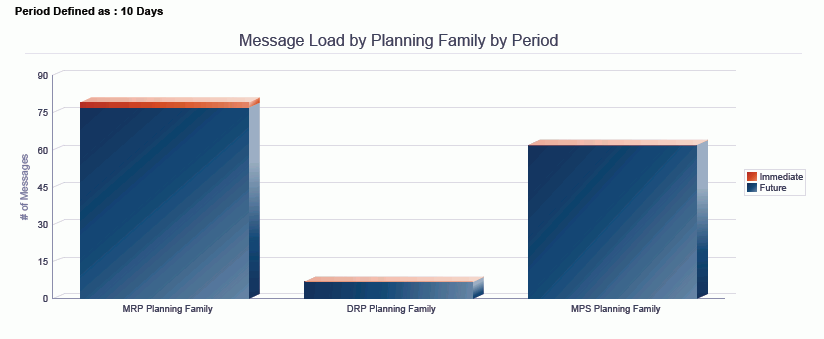
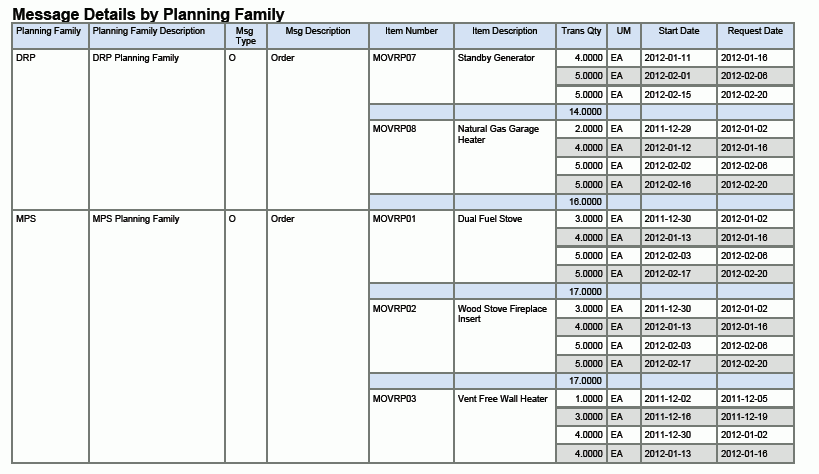
14.3.3.3 Messages by Planning Family
This report enables you to view your planning messages based on planning family. You can see the number of messages, the number of types of messages, and the percentage of message counts for each planning family. You can also view the number of messages based on periods.
This report contains the following components:
-
Purchase Order Message Count by Planning Family (horizontal bar graph)
-
Pending Action by Message Type (horizontal bar graph)
-
Percentage of Message Count by Planning Family (pie chart)
-
Message Load by Planning Family by Period (bar graph)
-
Message Details by Planning Family (table)