8 Reports
Use the Reports feature to consolidate changes to hardware, software, and job conditions. You can gather detailed information about job history, firmware, OS updates, and problems and then export that information to a file in CSV or PDF output.
Note:
Reports can consume significant disk space. To release disk space, move or delete report results. Reports in PDF and CSV files are stored in the/var/opt/sun/xvm/reports directory. You can relocate this directory to a dedicated disk.About Charts
Enterprise Manager Ops Center collects information every five minutes on every managed asset and displays the last hour of data on the asset's Summary tab and OS Details page. To see utilization data over longer periods of time, up to six months, create one of the following charts, if it is available for the asset type:
-
Power Utilization: Servers, chassis
-
CPU Utilization: Operating system, operating system for a virtual machine, virtual host, virtual pool
-
Memory Utilization: Operating system, virtual host, virtual pool
-
Network Utilization: Operating system, operating system for a virtual machine, virtual host, virtual pool
-
File System Utilization: Oracle Solaris OS and Linux OS
-
System Load: Oracle Solaris OS and Linux OS
For the first five days of operation, data is collected every five minutes. After the fifth day, the reported data is an average, according to the following:
-
Five days to three weeks: Average for each hour
-
Three weeks to six weeks: Average for each 12-hour period
-
Six weeks to six months: Average for each 24-hour period
-
After six months: Data is deleted.
Figure 8-1 is a sample chart is for a managed OS asset.
Figure 8-1 Sample Chart for an Managed OS
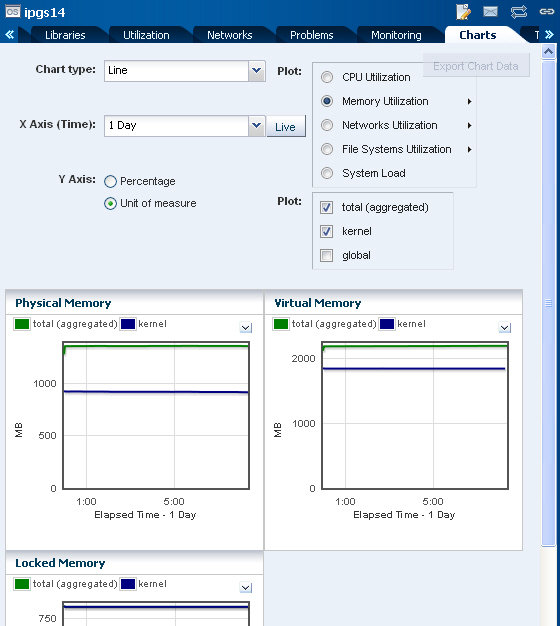
Description of "Figure 8-1 Sample Chart for an Managed OS"
Group Charts
In addition to displaying charts for individual assets, you can see charts for a group of assets: the five most-utilized assets and the five least-utilized assets in the group. In the Summary page of a group, hourly usage is displayed as a bar chart. You can create the following charts for the managed groups:
-
Server Group
-
Power
-
-
Chassis Group
-
OS Group
-
CPU Utilization
-
Network Utilization
-
System Load
-
Memory Utilization
-
-
Host Group
-
CPU Utilization
-
Network Utilization
-
Allocated Memory
-
Power
-
Creating Charts
You can create charts 24 hours after you first manage the asset. The asset must be operating and the Enterprise Controller must be able to get access to the asset. You can use the default format or change the charts to use a line, bar, or area format or to use different time intervals.
By default, the graphs show one day of data. Click on the Live button in the graph's toolbar to change to Live mode,which reports new information every 5 seconds. You can also change the graph to one of the following periods:
-
One hour (1H) – One point for every 5 minutes
-
One day (1D) – One point for every 5 minutes
-
Five days (5D – One point for every 5 minutes
-
Three weeks (3W) – One point every hour
-
Six weeks (6W) – One point every 12 hours
-
Six months (6M) – One point for every day To make a graph with the minimum of two points, a system must have been managed for at least 10 minutes to view a one-hour graph and for at least two days to view the six-months graph.
The data for these time periods is stored separately. For example, if a server has been managed for two hours and you select the 6W view, the graph cannot be displayed because only one point of data of that type has been stored; the second point has not yet occurred. If you then select the 1D view, the graph can display 24 points of data (120 minutes in 5-minute intervals). However, the graph displays these points over a 24-hour period and not over the actual two-hour period. For the most accurate representation of the data, choose a time period that is less than or equal to the time that the selected server has been managed.
You can export the data for either the current view or all available data toa file in either CSV or XML format. Use the Export Chart Data toolbar icon to choose options for exporting the data.
If the graph is blank for a server, one of the following conditions has occurred:
-
Server does not have the appropriate ILOM version.
-
Server has not been discovered through the ILOM driver.
-
Server is unreachable.
-
Expand Assets in the Navigation pane.
-
Select an asset. The Summary page is displayed in the center pane, which includes hourly charts of CPU, Network, and Memory utilization.
-
Click the Charts tab in the center pane.
-
Select the plot type. You can select resources such as CPU, network, memory file system, and system load.
-
Select the Chart option to display the charts as thumbnail images or single charts.
-
Select the thumbnail image option to see all resource utilization in one page.
-
Select the single chart option to compare multiple variables in one chart.
-
-
Select the type of chart. The available type depends on the type of asset.
-
Select the time interval represented in the X-axis.
-
Select how you want to measure utilization: as a percentage or in an appropriate unit of measure.
-
Display the charts.
-
Click Export Chart Data.
-
Select the format and time period, and then click Export. The data is exported.
Creating System Information Reports
Create a system information report to obtain the information on assets such as OS, server, chassis, logical domains, global zone, non-global zone, and M-Series server.
To Create a System Information Report
-
Select Reports from the Navigation pane.
-
Select System Information Reports from the Reports section.
-
Select Create System Information Report from the Actions pane. The Create System Information Report wizard is displayed.
-
Define the report parameters, including:
-
Report Name and Description
-
Resource Type – Select an asset type
-
Schedule – Select Create Schedule to schedule the report.
-
Output Format – Select CSV or PDF format.
-
Select Targets – Add one or more targets by selecting them in the list of Available Items and clicking Add to Target List.
When you have specified the report's contents, click Next. The attributes for the asset type are listed.
-
-
Select one or more attributes from the list and click Add or click Add All to choose all the attributes. Click Next.
-
To set a filter for an attribute, select the attribute and specify its condition. Click the Add icon to set filters for other attributes. When you are finished setting the filters, click Next.
-
If you selected Schedule in Step 4, the Report Schedule page is displayed. Select a schedule option, then click Next:
-
Now – Runs the report immediately.
-
Start Date – Select a date and time to generate the report.
-
On a Recurring Schedule – Select the month and day when you want to generate the report on a recurring basis. Select the Start, End Time and the Number of hours between runs. This is to set the number of times the report is generated between the specified start and end time. For example, if you set the Start Time at 6.00 AM, End Time at 12.00 AM and the Number of hours between runs as 2, the report is run at 6.00 AM, 8.00 AM, 10.00 AM and 12.00 AM.
-
-
Review the Summary.
-
To save the report as a template, click Save and Close. Templates are listed in the Report Templates section of the center pane.
-
To generate the report without saving it as a template, click Run and Close. Reports are listed in the Report Results section of the center pane.
-
To view the report, select it from the Reports Results section and then click one of the icons to choose the format: View interactively, View CSV, or View PDF.
See Viewing And Exporting Report Results for more information about generating a compliance job from the result.
About Update Reports
Use Update reports to check for new software updates and security advisories. You can get a general report, or test a system or installed package for available fixes. For auditing purposes, you can create a change history report. Various types of update reports are available for Linux, Oracle Solaris and Windows operating systems. You can export report results to CSV or PDF format.
Update Compliance Reports
The following reports are available for Linux, Oracle Solaris and Windows operating systems:
-
Host Compliance – Provides information on whether your system is compliant with security and bug fixes incidents.
-
Incidence Compliance – Provides information about the number of systems to which the selected OS updates apply.
Linux and Oracle Solaris OS Update Reports
In addition to the reports created for all types of operating systems, the following reports are available for Linux and Oracle Solaris operating systems:
-
Change History – Provides a history of OS update install and uninstall jobs completed on managed systems.
-
CVE Compliance – Provides information on incidents that are related to specific Common Vulnerability and Exposure Identifiers (CVE IDs) and the systems that should have these incidents installed. CVE IDs are unique, common identifiers for publicly known security vulnerabilities.
-
Distribution Update – Provides basic information of all known distribution and local incidents.
-
Package Compliance – Provides the details of the selected packages on your managed system that are compliant or not compliant with the latest recommended version available.
-
RSC – Recommended Software Configuration – Provides information about the system compliance for installing a specific application, such as the Oracle 11g Database, on a Oracle Solaris or Linux OS.
-
Service Pack Compliance (Linux only) – Provides information on incidents created by the publication and release of a service pack by a vendor. This helps to determine whether your system has the latest service packs released by the vendor.
-
Solaris Update Compliance (Oracle Solaris OS only) – Provides information on whether an Oracle Solaris system is compliant with a specific update.
-
Baseline Analysis (Oracle Solaris OS only) – Helps to check the compliance of systems against newly released Oracle Solaris baselines.
See Firmware And Os Update Reports for more details about each type of report and how to create and export a report.
Creating Problem Reports
The following types of problem reports are available:
-
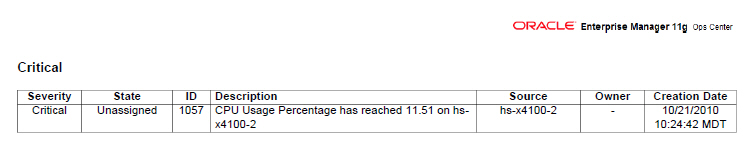
The Problem Summary Report is a historical report that summarizes information about all alerts and problems for a specified category, such as alarm state, alarm owner, asset type, date range, severity levels, and affected asset groups.
Figure 8-2 is an example of a Problem Summary Report for a critical problem.
-
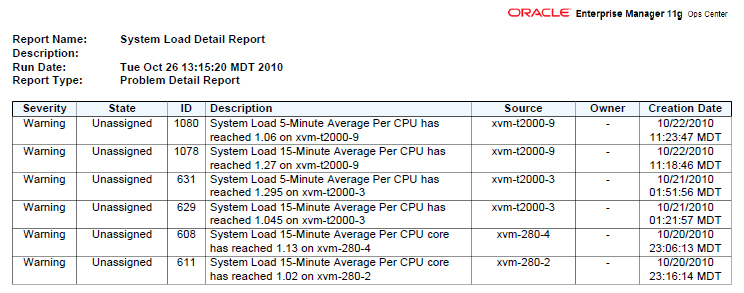
The Problem Detail Report contains detailed information about one or more problems. In addition to a summary, the report includes an audit trail consisting of state-change annotations, alert annotations, suggested-fix annotations, comment annotations, operation annotations.
Figure 8-3 is an example of a Detail Report for System Load Problems. The first page of the report is a summary of the report.
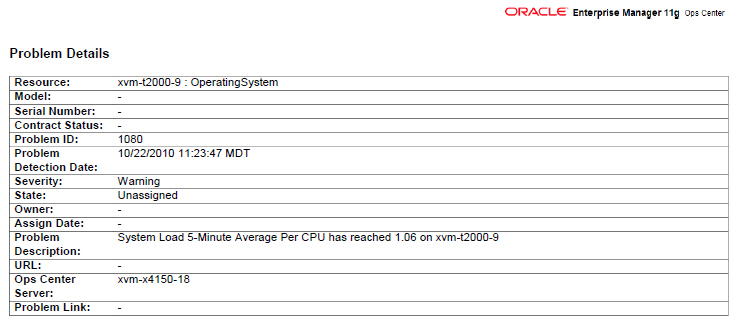
After the summary page, each problem has four pages:
-
Details of the problem, as shown in Figure 8-4
-
Suggested actions, if any
-
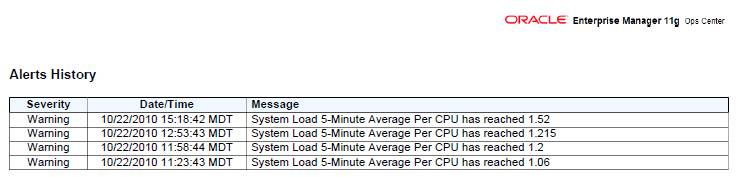
Alerts History, as shown in Figure 8-5
-
Any annotations that are associated with the Problem
-
When you create a report, you can save the report as a template, or you can generate the report. After a report is created, you can view the report, re-run the report to get updated information, or save it as a template.
To Create a Problem Summary Report
-
Expand Reports in the Navigation pane.
-
Click on Problem Reports, and then click Problem Summary Report.
-
Click Create Problem Summary Report in the Actions pane.
-
Define the report parameters by providing the following information, then click Next:
-
Name and description for the report.
-
Choose the targets, either Select All Assets or Select Specific Assets.
-
If you do not want to the report to run on a schedule, click the Create Schedule check box to clear it.
-
Choose the output format, either CSV or PDF.
-
-
Define the problem parameters by providing the following information, then click Next:
-
To create a historical report of all problems and the date that each problem was detected, select All Creation Dates.
-
To create a summary report for problems detected during a specific date range, select Range of Creation Dates, then enter the beginning date in the From field and the ending date in the To field.
-
To filter by severity level, owner, or state, highlight the fields to be included in the report. Use Ctrl+Enter to select multiple options.
-
To filter by one or more criteria, add the criterion in the Description Contains field. Use a comma-separated list for multiple criteria. For example, FileSystemUsage or FileSystemUsage,SwapUsage.
-
-
If you selected Schedule in Step 4, the Report Schedule page is displayed. Select a schedule option, then click Next:
-
Now – Runs the report immediately.
-
Start Date – Select a date and time to generate the report.
-
On a Recurring Schedule – Select the month and day when you want to generate the report on a recurring basis. Select the Start, End Time and the Number of hours between runs.
-
-
Review the Summary.
-
To save the report as a template, click Save and Close. Templates are listed in the Report Templates section of the center pane.
-
To generate the report without saving it as a template, click Run and Close. Reports are listed in the Report Results section of the center pane.
-
-
To view the report, select it from the Reports Results section and then click one of the icons to choose the format: View interactively, View CSV, or View PDF.
To Create a Problem Detail Report
-
Expand Reports in the Navigation pane.
-
Click on Problem Reports, and then click Problem Detail Report.
-
Click Create Problem Detail Report in the Actions pane.
-
Define the report parameters by providing the following information, then click Next:
-
Name and description for the report.
-
Choose the output format, either CSV or PDF.
-
Choose the targets by highlighting one or more problems in the list. Use Ctrl+Enter to select multiple problems. The search field enables you to search for a specific problem. Click a table heading to change the sort order, or remove a column from the table.
-
-
Review the Summary.
-
To save the report as a template, click Save and Close. Templates are listed in the Report Templates section of the center pane.
-
To run the report without saving it as a template, click Run and Close. Reports are listed in the Report Results section of the center pane.
-
-
To view the report, select the report and then click one of the icons to choose the format: View interactively, View CSV, or View PDF.