Release 12.1
Part Number E23439-03
Contents
Previous
Next
| Oracle Environmental Accounting and Reporting User's Guide Release 12.1 Part Number E23439-03 | Contents | Previous | Next |
Oracle Environmental Accounting and Reporting provides the following pre-built dashboards to report the source usage, emissions data, carbon disclosure, and KPI measures for organizations:
Emissions
Energy
Metrics
Reporting
Summaries
Test
Transaction
Usage
The Emissions dashboard displays a summary of emissions by scope and by source for the whole organization in the default organization hierarchy. The summary is shown by year and by month for a selected year. You can set up reporting thresholds for emissions for your organization. When the emissions are below the threshold, a green indicator is seen on the report. When the emissions are above the threshold, a red indicator is seen on the report.
To view the Emissions page
Navigate to OBIEE Dashboards. Click Emissions. The Emissions page appears.
The following reports display in the Summary tab:
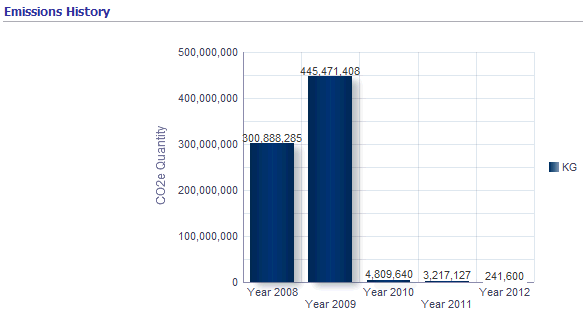
Emissions History is a graphical representation of the history of the carbon emissions by the organization.
Emissions by Year report displays emissions for a selected year for an organization. Select a Year for which you want to view the emissions. The following sub reports display for the organization:
Emissions by Scope by Year report is a tabular representation of the emissions of the organization by scope for the selected year.
Year Number
Emission Scope is the scope of the emissions by the organization.
CO2-e Quantity is the quantity of emissions by the organization.
CO2-e UOM is the unit of measure in which the emissions are measured.
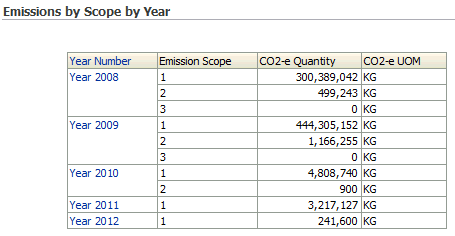
Emissions by Source by Year report is a tabular representation of the emissions of the organization by source for the selected year.
Year Number
Emission Scope is the scope of the emissions by the organization.
Source Description is a brief description of the source of emissions.
Source Code is the code for the source of the emissions.
CO2-e Quantity is the quantity of emissions by the organization.
CO2-e UOM is the unit of measure in which the emissions are measured.
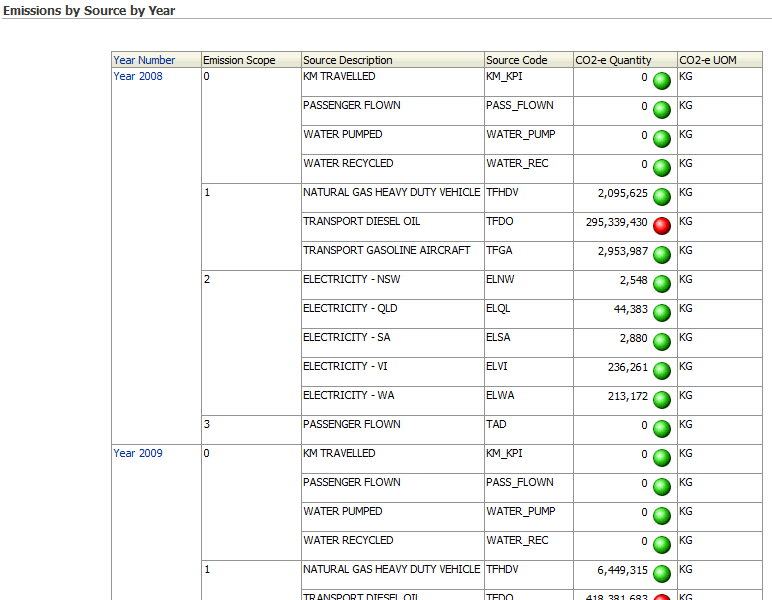
The following reports display in the Emissions by Scope Tab:
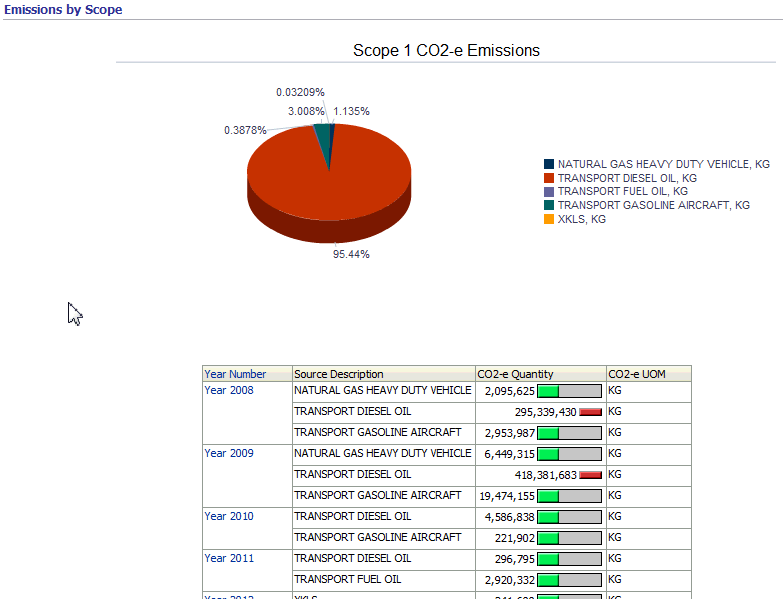
Emissions by Scope report is a graphical representation of the emissions of the organization by scope for the selected year. The emission data also displays in a tabular report with the following fields:
Year Number
Source Description is a brief description of the source of emissions.
CO2-e Quantity is the quantity of emissions by the organization.
CO2-e UOM is the unit of measure in which the emissions are measured.
The following reports display in the Emissions by Source Tab:
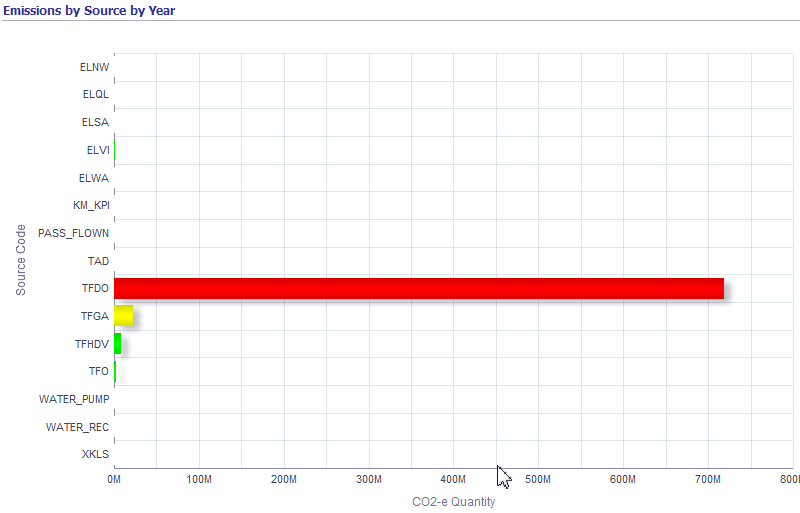
Emissions by Source report is a graphical representation of the emissions of the organization by source. You can select the year and an emission for which you want to view the emissions. The emission data also displays in a table report with the following fields:
Year Number
Emission Scope is the scope of the emissions by the organization.
Source Description is a brief description of the source of the emissions.
Source code is the code for the emission source.
CO2-e Quantity is the quantity of emissions by the organization.
CO2-e UOM is the unit of measure in which the emissions are measured.
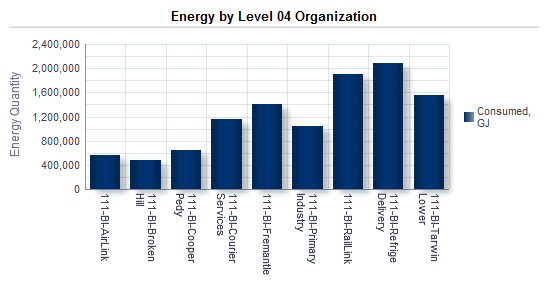
The Energy dashboard displays the energy consumed at the individual hierarchy levels of an organization for the selected year.
To view the Energy page
Navigate to OBIEE Dashboards. Click Energy. The Energy page appears.
Select the Year for which you want to view the energy consumption.
The Energy by Year report displays the energy consumed at the individual levels of the organization depending on its hierarchy.
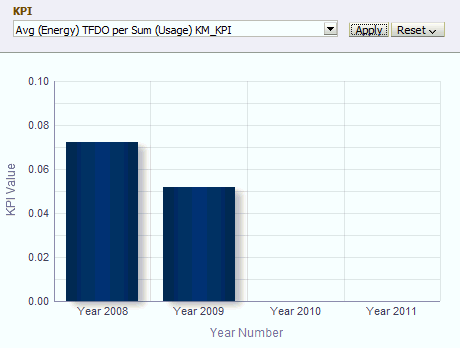
You can define Key Performance Indicators (KPIs) in the Oracle Environmental Accounting and Reporting (EAR) application to obtain information relevant to an organization. Refer to Defining Key Performance Indicators for more information. When you set up the KPIs, the EAR application calculates the metrics using the transactions of the sources that are included in the numerator and denominator of the KPI definition and displays the results in the Metrics dashboard. For example, you can define a KPI or a metric to calculate and report the amount of emissions per distance travelled, or amount of energy used per employee, or amount of fuel consumed per volume of water pumped.
To view the Metrics page
Navigate to the OBIEE Dashboards. Click Metrics. The Metrics page appears.
Select the KPI and the Year for which you want to view the metrics. The following reports display:
A bar chart displays the KPI values for the organization for the selected year.
A graph displays the KPI values for the organization across the months of the selected year.
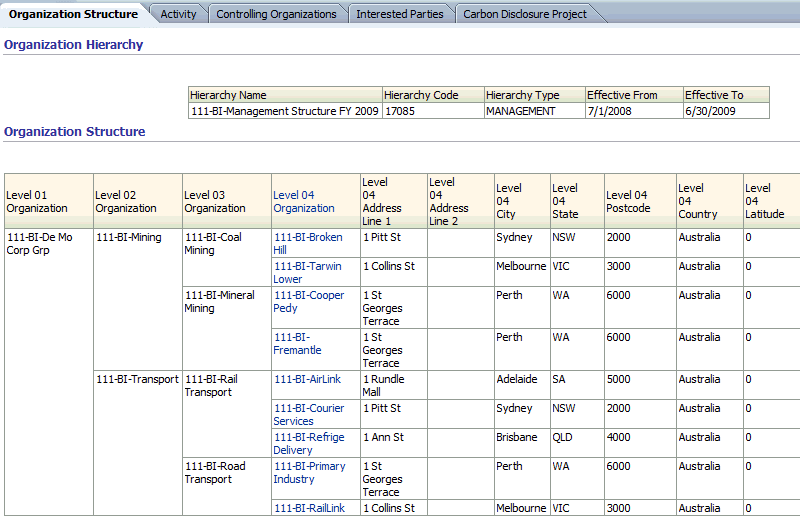
Based on the default organization hierarchy the Reporting dashboard displays the top four levels of the organization structure and the organization control and interested parties to this organization structure.
Note: The pre-built OBIEE dashboards use 01 Level Organization, 02 Level Organization, 03 Level Organization, and 04 Level Organization as the default nomenclature to represent the four levels of the Organization Structure set in the Reporting Parameters. However, you can choose to rename them based on your business needs.
To view the Reporting dashboard
Navigate to the OBIEE Dashboards. Click Reporting. The Reporting page appears.
The following reports display for the organization in the Organization Structure tab:
Organization Hierarchy: The report displays the following fields:
Hierarchy Name is the name of the organizational hierarchy.
Tip: The default Hierarchy Name values are 01 Level Organization, 02 Level Organization, 03 Level Organization, and 04 Level Organization for the four levels of the Organization Structure, but you can rename these levels to meet your business needs.
Hierarchy Code is the code for the organizational hierarchy
Hierarchy is the type of the organizational hierarchy.
Effective From is the date from which the organizational hierarchy is effective.
Effective To is the date to which the organizational hierarchy is effective.
Organization Structure: The report displays the Name, Address, GPS co-ordinates, and the Industry Group Codes for the top four levels of the organization. You can click on the name of a level 4 organization to view details of further levels of the organization hierarchy.
Organizations with Operational Control: The report displays the details of organizations that have operational control on the organization.
Level 4 Organization is the name of the facility on which an organization has operational control.
Control Type Description is the type of operational control an organization has on the facility.
Effective Date From is the effective start date for the controlling organization’s operational control on the facility.
Effective Date To is the effective end date for the controlling organization’s operational control on the facility.
Controlling Organization is the name of the organization that has operational control over the facility.
CEO Name is the name of the CEO of the controlling organization.
Company Identifier is a code for the controlling organization.
Address Line 1, Address City, Address State, Address Postcode and Address Country display the address of the controlling organization.
Interested Parties: The report displays the details of other organizations interested in the current organization.
Level 4 Organization is the name of the facility in which other organizations are interested.
Interest Type Description is the type of interest an organization has on the facility.
Effective Date From is the effective start date for the interested organization’s interest in the facility.
Effective Date To is the effective end date for the interested organization’s interest in the facility.
Interested Organization is the name of the organization that has interest in the facility.
CEO Name is the name of the CEO of the interested organization.
Company Identifier is a code for the interested organization.
Address Line 1, Address City, Address State, Address Postcode, and Address country display the address of the interested organization.
The following reports display for the organization in the Activity tab. Select the Year and the Level 04 Organization for which you want to view activity details:
Organization Details: The report displays the details of the selected facility for the selected year.
Level 01 Organization, Level 02 Organization, and Level 03 Organization fields display the names of the organizations in the top three levels of the organization hierarchy.
Level 04 Organization is the name of the Level 04 Organization of the hierarchy.
Level 04 Address Line 1, Level 04 Address Line 2, Level 04 Address Level 04 City, Level 04 Address State, Level 04 Address Postcode, and Level 04 Address Country fields display the address of the facility.
Level 04 latitude and Level 04 Longitude fields display the GPS co-ordinates for the facility.
Level 04 Industry Group Code is the industry group code for the Organization at Level 4 of the hierarchy.
Activity Summary: The report displays the details of all the activities of the organization at Level 04 depending on the hierarchy setup.
State is the name of the state in which the organization is located.
Month
Emission Scope is the scope for the emissions by the organization.
Parent Source Description
Child Source Description
Activity Type Description is a description of the activity type.
Source Code is the code for the emissions source.
Source Description is a brief description of the emissions source.
Activity is the name of the activity.
Activity Description is the brief description of the activity.
Measurement Criteria
Usage Quantity is the quantity of the source used by the organization.
Usage UOM is the unit of measure in which the source usage quantity is measured.
Activity for Organizations With Operational Control: The report displays the details of the activities of the facility that have operational control.
Activity for Organizations without Operational Control: The report displays the details of those activities of the facility that do not have operational control.
The following report displays for the organization in the Controlling Organizations tab. Select the Year and the Controlling Organization (facility) from the list of values (LOV) for which you want to view activity details. All organizations that are defined as Controlling Organizations in the organization setup display in the LOV:
Activities: The report displays a list of all activities of the facility that the Controlling Organization has control on, depending on their effective dates of control.
State is the name of the state in which the facility is located.
Month
Emission Scope is the scope for the emissions by the facility.
Source Code is the code for the emissions source.
Source Description is a brief description of the emissions source.
Activity Type Description is a description of the activity type.
Parent Source Description
Child Source Description
Measurement Criteria. Refer to “Setting Up Lookups” topic in the Setting Up chapter for information on measurement criteria.
Usage Quantity is the quantity of the source used by the facility.
Usage UOM is the unit of measure in which the source usage quantity is measured.
The following report displays for the organization in the Interested Parties tab. Select the Year and the Interested Organization (facility) from the LOV for which you want to view activity details. The Interest Type displays. All organizations that are defined as Interested Parties in the organization setup display in the LOV.
Activities: The report displays a list of all activities of the facility that the Interested Organization has interest in depending on their effective dates of interest:
State is the name of the state in which the facility is located.
Month
Emission Scope is the scope for the emissions by the facility.
Source Code is the code for the emissions source.
Source Description is a brief description of the emissions source.
Activity Type Description is a description of the activity type.
Parent Source Description
Child Source Description
Measurement Criteria
Usage Quantity is the quantity of the source used by the facility.
Usage UOM is the unit of measure in which the source usage quantity is measured.
The Carbon Disclosure Project displays a selection of questions related to the carbon disclosure project and is presented with the answers derived from the data available to the Oracle Environmental Accounting and Reporting application. Select the Calendar, Year, and Organization Hierarchy for which you want to view the Carbon Disclosure Project report.
Note: In the Carbon Disclosure Project (CDP) dashboard page, Company refers to the Level 01 Organization, Division refers to the Level 02 Organization, and Facility refers to the Level 04 Organization in the Organization Hierarchy. The Level 03 Organization is not used for the CDP.
Refer to Greenhouse Gas Accounting and Reporting for information on the Carbon Disclosure Project.
The Summary dashboard page shows a high level information and comparison of carbon equivalent emissions and energy for related activities for the default parameters for the Organization Hierarchy and Calendar Type by year. For a selected year, the CO2-e emissions are reported by organization and displayed in a bar chart, pie chart, and a table. You can set up reporting thresholds for emissions for your organization using the conditional formatting and other features of Oracle Business Intelligence Enterprise Edition (OBIEE).
To view the Summary page
Navigate to OBIEE Dashboards. Click Summary. The Summary page appears.
Select the Year for which you want to view the emissions and energy consumption information. The default Organizational Hierarchy and Calendar display. The following reports display:
Emissions History is a graphical representation of the history of the carbon emissions by year for the organization.
Energy Consumption History is a graphical representation of the history of energy consumed by year for the organization.
Emissions by Organization displays the carbon emissions by each facility of the organization. This report displays as a graph, a pie chart, and a table.
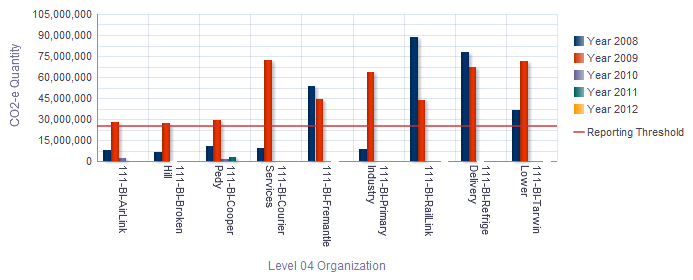
The following fields display in the table:
Level 04 Organization is the name of the organization that exists in the Level 04 of the Organization Hierarchy set in the Reporting Parameters.
CO2-e Quantity is the quantity of the carbon equivalent of the emissions from the organization.
CO2-e UOM is the unit of measure in which the carbon emissions are measured.
CO2-e Quantity % is the percentage of carbon emitted by the facility, of the total emissions by the organization.
System Administrators use the Test dashboard to review the data collected from source systems and stored in the data warehouse. The Test dashboard provides reports for the following entities:
Assets
Transaction Details
Emission Scopes
Sources
Items
Reporting Periods
Source Applications
Subcontractors
Suppliers
Transactions
Organization Hierarchies
Level 01 Organizations
Level 02 Organizations
Level 03 Organizations
Level 04 Organizations
Level 05 Organizations
Level 06 Organizations
Level 07 Organizations
Level 08 Organizations
Level 09 Organizations
Level 10 Organizations
Level 11 Organizations
Level 12 Organizations
Activity Entities
Usage Facts
Controlling Organizations
Interested Parties
KPI Definitions
KPI Transactions
JDE Business Units
Clicking on the link for a data entity provided on the dashboard, such as Emission Scopes, displays the report for the data element in a new page. If the source for the data warehouse is Oracle E-Business Suite (EBS), then the following links on the Test dashboard, which are irrelevant for Oracle EBS, do not show results:
Source Application
Subcontractor
JDE Business Units
System Administrators can use the Test dashboard to verify the accuracy of the data, for debugging, and for troubleshooting.
To view the Test Dashboard page
Navigate to OBIEE Dashboards. Click Test Dashboard.
The Test Dashboard page appears.
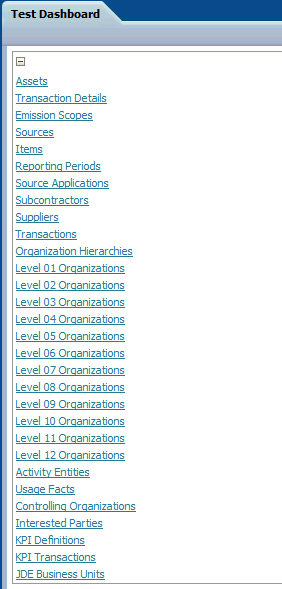
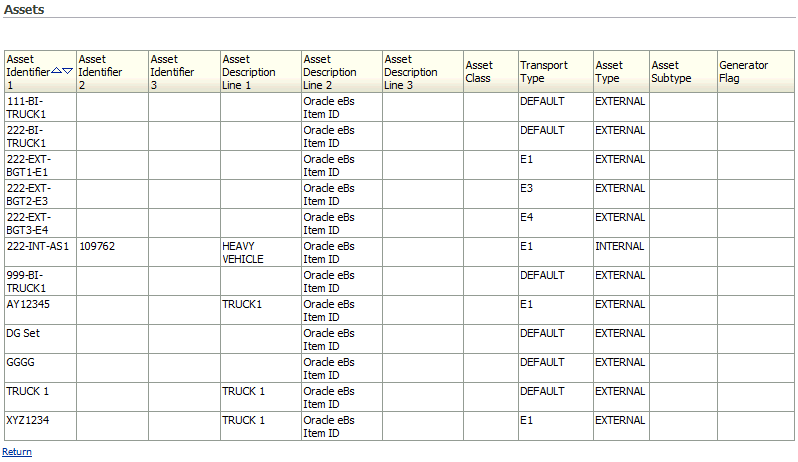
Select one of the report links (Assets, Transaction Details, and so on).
The report displays the data for the entity selected in a new page.
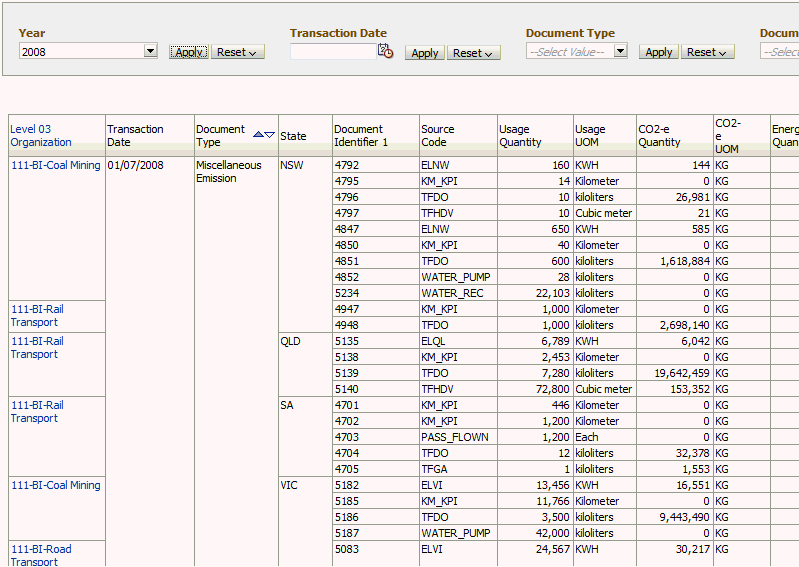
The Transactions dashboard lists the transactions of an organization by day and organization and also displays the usage and emissions data for each transaction
To view the Transactions dashboard
Navigate to the OBIEE Dashboards. Click Transactions. The Transactions page appears.
Select no criteria to display all the results. Select any of the following search criteria to narrow your results:
Year to display transactions in a specific year.
Transaction Date to display transactions on a specific date.
Document Type is the type of transaction document.
Document Identifier is the code for the transaction document.
State to display transactions in a specific state.
Click Go. The following fields display:
Level 03 Organization is the name of the organization at the level 3 of the organization hierarchy.
Transaction Date is the date of the transaction.
Document Type
State is the state in which the Level 03 Organization is located.
Document Identifier
Source code is the code for the emissions source.
Usage Quantity is the quantity of the source used in the transaction.
Usage UOM is the unit of measure in which the usage quantity is measured.
CO2-e Quantity is the quantity of carbon equivalent emissions due to the transaction.
CO2-e UOM is the unit of measure in which the CO2-e quantity is measured.
Energy Quantity is the amount of energy consumed in the transaction.
Source Type is type of source used in the transaction.
Energy UOM is the unit of measure in which the energy quantity is measured.
The Usage dashboard displays the source usages for a facility by year and by source.
To view the Usage dashboard
Navigate to the OBIEE Dashboards. Click Usage. The Usage page appears.
Select no criteria to display all the results. Select any of the following search criteria to narrow your results:
Year to display source usages for a facility in a specific year.
Level 04 Organization to display source usage for a specific facility.
Source Description to display usage for a specific source.
Click Go. The following fields display:
Year Number
Level 04 Organization is the name of the facility.
Emission
Source Description is a brief description of the source.
Usage Quantity is the quantity of the source used by the facility.
Usage UOM is the unit of measure in which the usage quantity is measured.

Depending on the number of data points, you may need to lengthen the axis of a Dashboard graph in order to read all data point titles along the axis. For example, in the Emissions Dashboard, select the Emissions by Source tab. The Emissions by Source by Year horizontal bar graph appears. If you have a large number of emissions sources, you may need to lengthen the vertical axis of the graph in order to read the name of each source.
Graph with a Short Vertical Axis

Same Graph with a Correctly Sized Vertical Axis
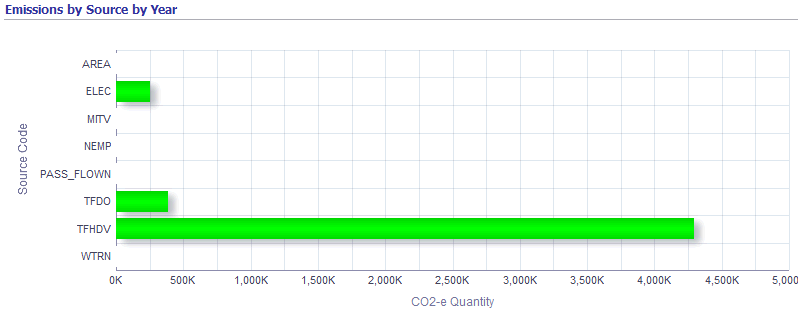
The following procedure explains how to lengthen the axis of a graph using the Emissions by Source by Year horizontal bar graph as an example. You can apply the same steps to any Dashboard graph, though.
To change the size of a graph
Navigate to OBIEE Dashboards. Click Emissions. The Emissions page appears.
Select the Emissions by Source tab.
The Emissions by Source by Year horizontal bar graph appears.
Click the Page Options icon.
The Page Options icon appears in the upper right corner of the page, to the left of the Help icon.
Select Edit Dashboard from the Page Options list.
Hover over the Emissions by Source by Year Graph 1 box. Two buttons appear in the upper right corner of this box. Click Properties (the xyz icon).
Select Edit Analysis from the Properties list.
In the Views region in the lower left corner of the page, select Graph from the list of views.
Click Edit View (the pencil icon in the Views region).
The graph appears.
Select the Edit graph properties icon (the xyz icon) from the toolbar above the graph.
The Graph properties box opens.
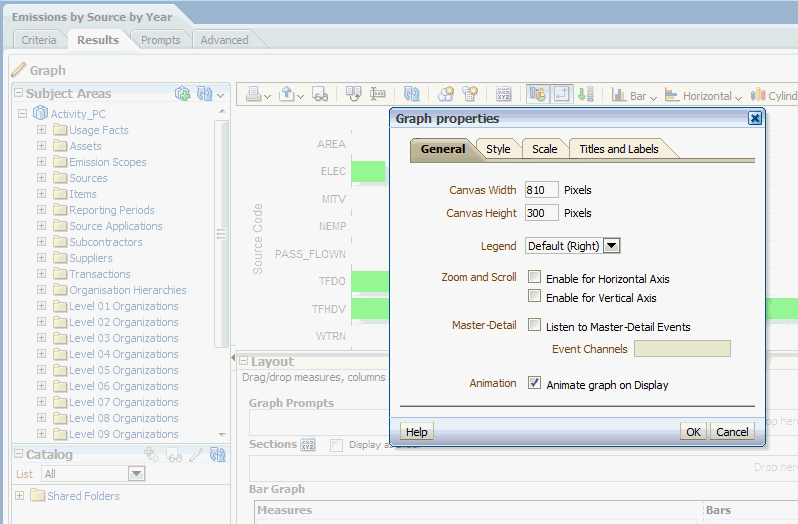
Enter a new graph width or height in the Canvas Width or Canvas Height fields.
Click OK.
If the graph size appears correctly, go to the next step. If you need to change the graph size again, repeat the previous two steps over and over until the graph appears correctly.
Click Done in the upper right corner of the page.
Click the Save Analysis icon (upper right corner of the page, near the Help icon).
Navigate to the Dashboard and verify that the graph appears as expected.
![]()
Copyright © 2011, 2012, Oracle and/or its affiliates. All rights reserved.