Predictive Trade Planning Concepts
This chapter covers the following topics:
- Worksheet Basics
- PTP Data Hierarchy
- Promotions
- Retailer Profiles
- Funding
- Promotion Costs and Spending
- Volume and Volume Breakdown
- Data Access
Worksheet Basics
This section provides a closer look at the basic data elements in worksheets, introduced previously in “Tutorial: Getting Acquainted with Worksheets.”
Levels (Segmentation)
A level lets you aggregate or group data in a worksheet.

For example, if you select a territory, then a retailer, and then a product category to display, the data in the rest of the worksheet is aggregated across this territory, retailer, and category.
Oracle Demantra uses several different kinds of levels:
-
Item levels group and aggregate data according to characteristics of the items you sell. For example, PTP item levels include brand, category, and promotion group.
-
Location levels group and aggregate data according to the locations where they are sold. For example, PTP location levels include retailer, territory, and so on.
-
Promotion levels correspond to promotional events.
In generic terminology, the word member refers to a unit within a level. For example, Albertson's is a member of the retailer level.
Series (Measures)
A worksheet table or graph displays series data associated with the current selection.

PTP provides many kinds of series:
-
Some series describe properties of item-location combinations; for example, Sales Quota. Others describe properties of promotions; for example, Veh Type.
-
Most series have numeric values, but some have string or date values. For some series (like Cons Promo and Veh Type), you choose a value from a dropdown list.
-
Some series are editable, some are editable only for specific dates, and some are not editable at all.
-
Some are based on imported data.
-
Some series are shown in different colors, depending on the data values or on other local conditions. For example, Incr Mfg Prft is shown in red if profit is negative.
PTP Data Hierarchy
PTP uses specific levels, organized into a flexible set of hierarchies. Some of these levels are not used in PTP worksheets, but are available if needed for reporting. Products are organized into several hierarchies, and locations are organized into another set of hierarchies. This section provides an overview.
Product Hierarchies
The lowest item level is the Item. PTP organizes items into four hierarchies.
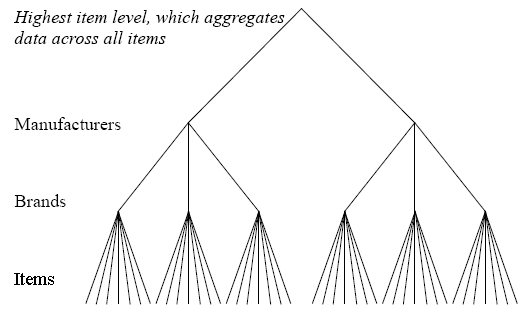
The Manufacturer Hierarchy
In the manufacturer hierarchy, items belong to brands. Brands, in turn, belong to manufacturers.
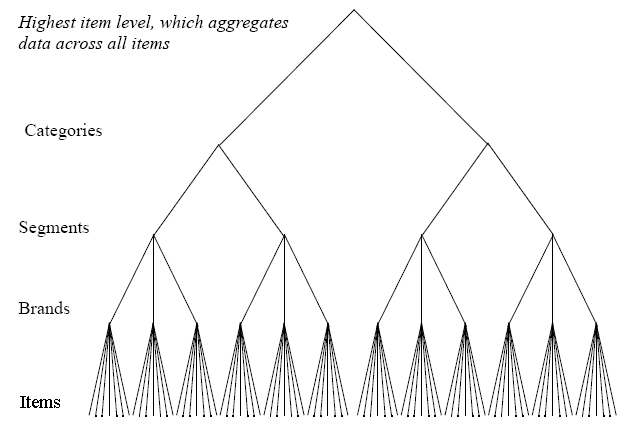
The Category Hierarchy
In the category hierarchy, items belong to brands, which belong to segments. Segments belong to categories.
The Promotion Group Hierarchy
In the promotion group hierarchy, items are organized into promotion groups. Promotions are usually created at this level, applying to entire sets of items.
The Product Line Hierarchy
In the product line hierarchy, items are organized into product subgroups, which are organized into product groups, which are organized into product lines.
Location Hierarchies
PTP provides two location levels that are both at the same (apparent) lowest level. These levels are Ship To and Territory. Internally, PTP has only one lowest location level, which is a combination of Ship To and Territory, created automatically by Oracle Demantra.
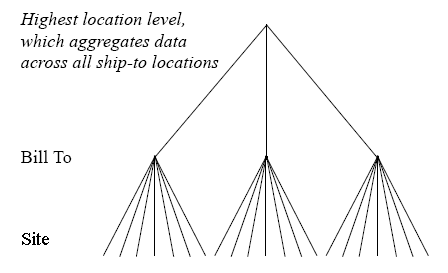
Ship To Hierarchies
Ship To locations are organized by Bill To locations, as follows:
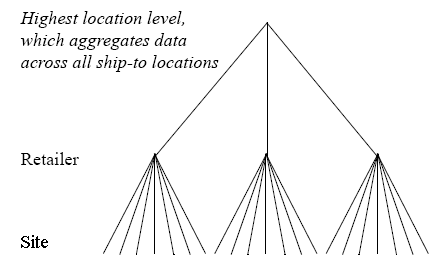
Ship To locations are also organized by retailer.
Territory Hierarchy
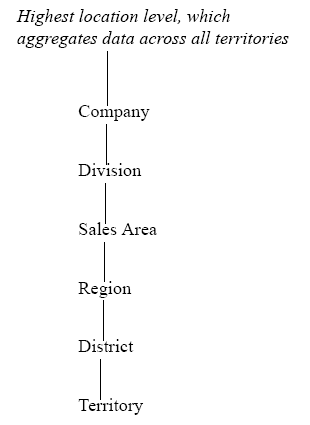
The Territory locations are organized in a single, fairly deep hierarchy. Territories are grouped into districts, which are grouped into regions. Regions, in turn, are grouped into sales areas, which are grouped into divisions, which are grouped into companies. The following figure sketches these relationships without indicating the members of each level:
The Territory-Retailer Level
PTP also uses another level, the combined territory-retailer level, for analytic purposes. This level is meant for use only by the Analytical Engine.
Promotions
A promotion is an occurrence that starts at a specific date, has a certain duration, and has a certain time-varying effect on sales. PTP models promotions as another kind of level, as mentioned earlier, so that they can be used in worksheets in all the same ways as item and location levels.
In PTP, you usually create promotions at the retailer-promotion group level. Multiple promotions can be associated with a retailer and promotion group during the same time bucket.
How PTP Uses Promotion Properties
PTP models a common set of promotion properties that are known to affect the impact of promotions. These properties include the following:
-
Vehicle type
-
Sale price
-
Promotion timing and duration
Each of these properties can have a different effect on the forecast or simulations. When the Analytical Engine runs (either in batch mode or simulation mode), it uses mathematical models to determine what effect each property had in the past. It uses this information to predict how each future promotion will behave.
These properties also affect how the Promotion Optimization behaves. See Optimizing a Promotion.
Promotions and Scenarios
Because it is useful to separate tentative promotions from real ones, most PTP worksheets organize promotions into two scenarios: Current Year and the Sandbox. When you create a new promotion, you place it in the Sandbox as long as it is tentative. When the promotion is definite (when mark its status as Planned), then you should move the promotion to the Current Year scenario.
A third scenario, actuals, contains promotions from previous years. These promotions are excluded from most PTP worksheets because they fall outside the span of time used in these worksheets.
Promotion Life Cycle and Status
PTP models a distinct life cycle for every promotion. The Event Status series shows the stage in which a given promotion resides; you can see this series in the Planning Environment and other worksheets. Typically a qualified user changes the status when appropriate.
-
When a promotion is first created, its status is initialized as Unplanned. Unplanned promotions are considered hypothetical and do not have an impact on the promotion funds or the forecast.
-
Typically you run a simulation to see the baseline and incremental volume for the proposed promotion. In addition, the system will calculate measures to be used for the cost benefit review. These include profit for the manufacturer and retailer, available fund balances as well as the proposed cost for the promotion.
-
Once you are ready to use the event in forecasting, you change its status event to Planned. This causes several things to happen:
-
The cost of the promotion is deducted from the available balance of funds.
-
The forecast is updated.
-
-
The next stage is approved.
-
When you have a firm commitment from the retailer, you move the promotion to the committed stage. When a promotion is marked as committed, PTP takes a snapshot of details of the promotion, for use in later analysis. With this information, it will be possible to compare the total projected sales with the total actual sales, for example.
Once a promotion has been committed, it is no longer editable.
-
After the promotion runs, the retailer may require payment for the promotion. You can advance the status to Partial Paid or to Paid to record the payment status.
-
Finally, the last stage is closed.
Retailer Profiles
Given that different retailers run different types of events differently, PTP stores retailer profiles that include details such as the following:
-
Average everyday selling margin
-
Minimum required event margin
-
Default vehicle costs for each type of event
When you create a promotion of a given type for a retailer, PTP automatically initializes the vehicle cost as appropriate for that retailer, saving you the work of making a manual adjustment each time. You can override this vehicle cost if necessary.
The other retailer details affect the optimization process, which finds the best possible promotion for a given goal, considering the retailer-specific constraints.
PTP provides default settings that you can use for any retailer, so that you can start by providing details for just a few key retailers, without needing to enter all of them. You can modify these default settings as needed.
Funding
PTP provides the following standard set of promotion funds:
-
Brand Development Funds (BDF)
-
Market Development Funds (MDF)
-
Slotting funds
In turn, both BDF and MDF include a portion for fixed funds and a volume-dependent portion, per common practice. For example, the total authorized BDF fund is computed as follows:
rate * volume + fixed funds
This means that when the planned volume increases, you accrue funding. That is, the authorized funding also increases.
In the Planning Environment, the Fund Balances window displays a summary of the funds and their balances. To set fund amounts, see PTP: Managing and Viewing Quotas and Funds - Overview.
Promotion Costs and Spending
Following standard practice, PTP models the promotional spend as a combination of fixed spending and per-unit spending. Specifically, apart from slotting costs, the spend for a given promotion is computed as follows:
vehicle costs + volume * buydown
For a given retailer, each vehicle type is assumed to have its own default cost. When you specify the vehicle type for a promotion for a retailer, PTP looks up and displays that cost. You can override this cost if necessary. As part of specifying the promotion details, you also specify the buydown, or discount per promoted unit that will be paid to the retailer (either as billback from the retailer or as an off-invoice settlement with the retailer).
In addition to specifying the promotion cost as described here, you also control how that promotion is to be funded. Specifically, when you mark a promotion as planned, you indicate how to split the cost between MDF and BDF; see Marking a Promotion as Planned.
Volume and Volume Breakdown
In general, PTP volume calculations use actuals for the past and forecasted volume for the future. So to compute volume as needed for total MDF or BDF funds for the year, PTP combines the actuals to date and the forecast.
In addition to providing the overall volume, PTP shows a breakdown of that volume into the following categories:
-
Base volume.
-
Incremental volume due to a promotion. Part of this incremental volume is due to cannibalization effects. The manufacturer and the retailers have different points of view about cannibalization, as noted below.
-
Pre and post-promotional effects. Sales are usually lower just before and after a promotion, as consumers take advantage of the better price during the promotion itself. The Analytical Engine computes the total volume before and after the promotion, as a result of the promotion, so that you can include this in your overall analysis.
Cannibalization
In addition to computing the incremental volume due to a promotion, the Analytical Engine computes specific cannibalization effects. Cannibalization includes multiple components, and the manufacturer and the retailer have different points of view.
-
Product switching, as described in Cannibalization Seen by the Manufacturer, decreased sales due to sales at another retailer.
-
Decreased sales of other products of the same brand at the same retailer. For example, sales of Exedra 24 were depressed by the promotion on Exedra 100, at the same retailer.
-
Decreased sales of other brands (of the same manufacturer), regardless of retailer. For example, sales of Advo 50 were depressed by the promotion on Exedra 100, which is made by the same manufacturer.
Cannibalization Seen by the Manufacturer
PTP computes cannibalization that is undesirable to the manufacturer.

This worksheet table shows a promotion group where a promotion was run and all promotion groups that were adversely affected, according to the manufacturer.
The row in blue indicates the promotion group (Exedra 100) on which you ran a promotion. In this row, you can see the total event dollars, incremental event dollars, net incremental event dollars and so on, for the promotion. Note that for Exedra 100, there was zero dollars of cannibalization and $2324 of pre- and post-promotional effect.
On the other hand, examine the other promotion groups here and notice that they were all cannibalized. Of course, for these promotion groups, there was zero direct lift, by definition, as the promotion did not run on them.
Cannibalization Seen by the Retailer
PTP also computes cannibalization that is undesirable to the retailer.

This worksheet table shows a promotion group where a promotion was run and all promotion groups that were adversely affected, according to the retailer. As before, the row in blue indicates the promotion group (Exedra 100) on which you ran a promotion.
Notice two promotion groups are listed here that were not seen in the manufacturer version: Notrim 24 and Tyitol 50. These promotion groups represent products that this retailer sells, but that are made by a different manufacturer. To the retailer, it is undesirable to cannibalize these promotion groups.
Data Access
Once customer data is loaded, an administrator can configure a security access level for each user.
The Paste method is enabled for any level that has Write or Full Control permission in the component.
-
If you do not have access to the target population, the Paste method is not visible
-
If you have partial access to the target population the method Paste is visible but when the method is executed, read-only members are removed from the population.
For levels with a population attribute:
-
When creating a new promotion, the default population is a merge of the worksheet levels and the population of the level member from where the method was invoked.
-
Members of the population with Read-Only or No Access are excluded.
See Also:
"Security" in the Oracle Demantra Implementation Guide Supplement