PMO: Simulation and Optimization
This chapter covers the following topics:
- Overview
- Running the Analytical Engine in Simulation Mode
- Running a Simulation
- Optimizing a Promotion
- Viewing Optimization Results
- Accepting an Optimized Promotion
- Reference
Overview
Before you mark a promotion as planned (or before you commit a promotion), you may want to run a simulation on it, or run the optimizer, or both. This chapter describes how to perform these tasks. It includes the following sections:
You may also want to examine the promotion in detail or create several tentative promotions (all in the Sandbox scenario) and view them side by side. See PMO: Examining and Comparing Promotions - Comparing Promotions in a Scenario.
A qualified user or administrator typically runs the Analytical Engine periodically in batch mode to generate a forecast for all items and locations in the system. The forecast data includes total volume, base volume (volume in the absence of promotions), incremental volume, pre- and post-promotional volume, and volume due to cannibalization.
To see an immediate forecast for a newly entered promotion, however, you do not have to wait for the next batch run, You can simply run a simulation, which considers only one promotion. With the forecasted numbers, you can see the effect on quota, accruals, spending, and so on. Likewise, if you change the properties of a promotion, you can run a simulation to see the resulting forecast.
Also, to help you find the most effective promotion for your needs, PTP provides the ability to optimize a promotion. The Promotion Optimization module uses the previously stored results of the Analytical Engine. You provide a specific goal and constraints, and the optimizer determines the best set of promotion properties. PTP provides a worksheet for viewing the optimized results, which you can then accept, if these results meet your needs.
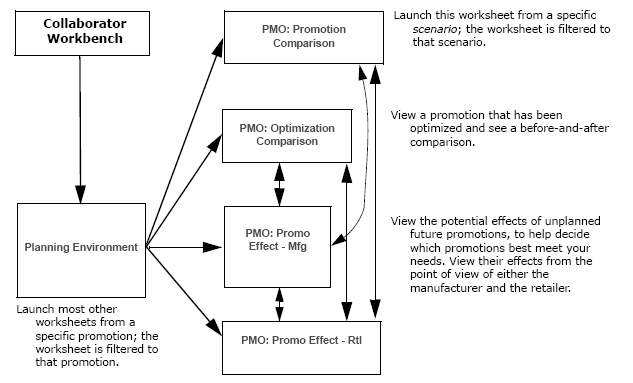
In principle, you can run simulation or optimization anywhere PTP displays future promotions. Then you can open another worksheet filtered to your promotion to see further details. Or you can first open that worksheet and then run simulation or optimization. Several worksheets are useful for these purposes.

The path you choose depends on what meets your needs at any time, but consider the following general principles:
-
If you run a simulation in the Planning Environment or the PMO: Optimization Comparison worksheet, the engine does not have the data needed to see cannibalization, which means that you may need to rerun simulation later in a different worksheet. If you run simulation in the other worksheets (PMO: Promotion Comparison, PMO: Promo Effect - Mfg, and PMO: Promo Effect - Rtl), the Analytical Engine can find cannibalization.
-
The PMO: Optimization Comparison worksheet is the only place that displays optimization results.
Note: Before you can perform either simulation or optimization, it is necessary to run the Analytical Engine in batch mode once in your application. See Running Required Workflows.
Running the Analytical Engine in Simulation Mode
Before you can perform simulations, you must start the Analytical Engine in simulation mode. Note that an error will occur if the Analytical Engine has not been run previously in batch mode.
To run the engine in simulation mode
-
Click Start > Programs.
-
Click Demantra > Demantra Spectrum release > Simulation Engine.
Running a Simulation
You can run a simulation to get a forecast for a promotion, particularly a newly created promotion or a promotion that you have just changed.
Note: The promotion must start in the future.
To run a simulation
-
Make sure the Analytical Engine is running in simulation mode; see Running the Analytical Engine in Simulation Mode.
-
Start in the Planning Environment worksheet.
-
Right-click a promotion and launch a worksheet, such as PMO: Promo Effect - Mfg or PMO: Promo Effect - Rtl.
Note: In principle, you can run a simulation in any worksheet. Note that if you run a simulation in the Planning Environment worksheet, however, the engine does not have the data needed to see cannibalization.
-
Click Data > Run Simulation. Or click the Simulation button.
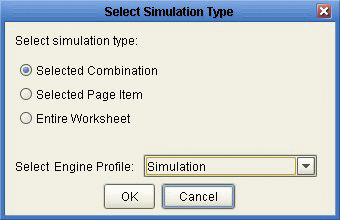
The Select Simulation Type page appears.

-
Click Selected Combination.
-
For Select Engine Profile, click Simulation.
-
Click OK.
Depending on the amount of data in your worksheet, simulation may take a few minutes.
-
When the simulation is complete, Oracle Demantra displays a message. Click OK.
-
Rerun the worksheet.
-
Examine the results.
Optimizing a Promotion
If you need to find the best possible promotion, license Oracle Demantra Trade Promotion Optimization (TPO).
PTP provides an optimizer that you can use to find the best possible promotion to maximize revenue, profit, or units. It considers constraints such as the following:
-
Retailer-specific details such as minimum needed retailer event margin. You can override the retailer's default event margin if needed.
-
Maximum budget and buydown for this promotion.
-
Basics such cost of goods, list price, and so on.
If you need more control of the analytical engine and use Oracle Demantra Trade Promotion Optimization, you can use its advanced analytics capability.
To optimize a promotion
Note: Before you can optimize a promotion you must set certain parameters and other setup tasks. For more information, see Configuring Promotion Optimization for Predictive Trade Planning in the Demantra Implementation guide.
-
You typically start in the Planning Environment or the PMO: Optimization Comparison worksheet. See Introduction to the Planning Environment and Viewing Optimization Results.
-
In the Event Planner window, right-click any future promotion and click Methods > Optimize.
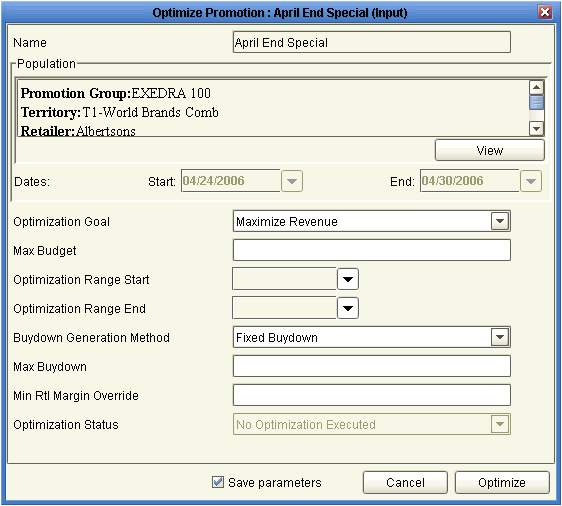
PTP displays the Optimize Promotion dialog box.

-
Specify values for the following parameters:
Optimization Goal Select one of the following goals for this promotion: -
Maximize Revenue
-
Maximize Profit
-
Maximize Units
Max Budget Maximum allowed budget for this promotion. If you leave this unspecified, there is no maximum budget. Optimization Range Start, Optimization Range End If these are blank, Promotion Optimization assumes that you want the optimized promotion to fall within the span of time of the original promotion. If you want Promotion Optimization to search for a better time for this promotion, use these parameters to specify the range of time for optimization to consider. Buydown Generation Method Specify whether Promotion Optimization should use the buydown that you have already entered or calculate an optimal buydown for this promotion. Max Buydown Maximum allowed buydown for this promotion. If Promotion Optimization calculates an optimal buydown, the buydown will not exceed this value. Min Rtl Margin Override Minimum margin that the retailer must make on this promotion, as specified in this retailer's profile. Use this parameter to override that value, if needed.
Use a value greater than 0 and less than or equal to 1. -
-
Click Optimize.
Now the system will select the promotion parameters (sale price, vehicle type, and so on) that best meet your goal. This is a huge time saver because you do not have to go through all the possible permutations of each promotion in order to find the best one for your goal.
When optimization is complete, PTP displays a message that indicates the status of the optimization and the number of iterations that it ran. (You may not see this message, depending on how PTP is configured.)
Then PTP asks if you want to rerun the worksheet.
-
Click OK.
-
If you are not yet in the PMO: Optimization Comparison worksheet, right-click the promotion and open that worksheet. See Viewing Optimization Results.
Viewing Optimization Results
To view optimization results
If you are not yet in the PMO: Optimization Comparison worksheet, right-click the promotion and click Open With > PMO: Optimization Comparison.

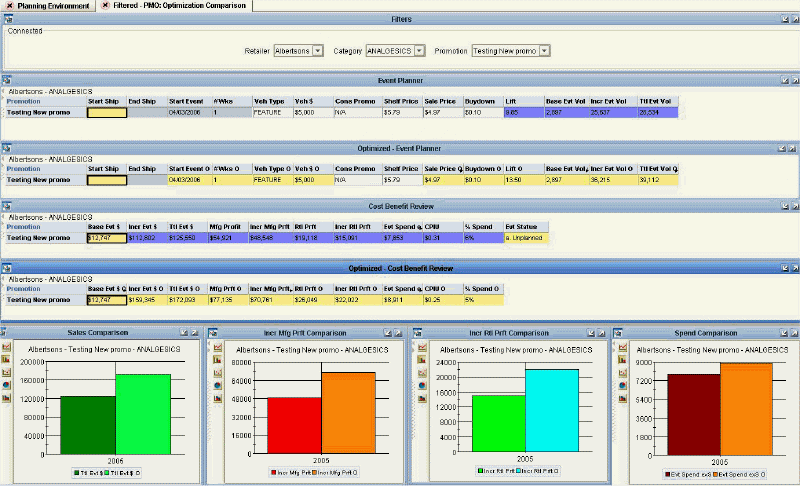
The PMO: Optimization Comparison worksheet provides the capability to view the optimization results (shown in yellow) and compare them to the current state of the promotion, to help you decide if you want to accept this optimization. This worksheet contains the following information.
Event Planner and Optimized Event Planner
These windows provide details of the events, including start and end ship dates, vehicle type, vehicle cost, buydown, base volume and incremental volume. Incremental volume is generated by Oracle Demantra's comprehensive analytical engine.

The Event Planner window shows these details for the actual promotion as it currently is. The Optimized - Event Planner window shows the details of the optimized promotion. If you accept the optimization, these details are moved to the actual promotion.
Notice that the values are given right below the original values of the promotion to facilitate easy comparison.
If you have not yet optimized this promotion, the Optimized - Event Planner window is empty.
Cost Benefit Review and Optimized - Cost Benefit Review
These windows display a detailed cost benefit analysis, including profitability metrics from both the manufacturer and retailer's perspective, overall event spend, cost per incremental unit (CPIU), and so on. The Cost Benefit Review window displays these details for the actual promotion as it currently is. The Optimized - Cost Benefit Review window shows the details of the optimized promotion. If you accept the optimization, these details are moved to the actual promotion.

Here notice that the color of the Evt Status series (upper window only) indicates the optimization status of this promotion:
-
White means that the promotion has not been optimized.
-
Yellow means that the promotion has been optimized.
-
Green means that the promotion has been optimized and accepted, so that the promotion is using the optimization results.
If you have not yet optimized this promotion, the Optimized - Cost Benefit Review window is empty.
Graphs
This worksheet also provides the following graphs:
-
Sales Comparison: Compares the total event dollars generated before and after optimization.
-
Incr Mfg Prft Comparison: Compares the incremental manufacturing profit generated before and after optimization. This is the additional profit that the manufacturer earns because of the promotion, in addition to the base profit that would be earned even without a promotion.
-
Incr Rtl Prft Comparison: Compares the incremental retailer profit generated before and after running optimization. This is the additional profit that the retailer earns because of the promotion, in addition to the base profit that would be earned even without a promotion.
-
Spend Comparison: Compares the event spend before and after running optimization.
If you have not yet optimized this promotion, each of these graphs includes only one bar, corresponding to the promotion in its current state.
Possible Actions
In this worksheet, depending on your authorization, you can do the following:
-
Edit a promotion, by changing the sale price and other properties. You can also right-click a promotion and select Edit to access other properties.
-
Run simulations. See Running a Simulation.
-
Run or rerun optimization. See Optimizing a Promotion.
-
Use the right-click menu to open other worksheets filtered to this promotion.
Accepting an Optimized Promotion
After you optimize a promotion, you can accept it. You can do this in any worksheet that displays promotions. For example, you can start in the PMO: Optimization Comparison worksheet.
Note: This action has no effect on a promotion that has not been optimized.
To accept an optimized promotion
-
Right-click the promotion and select Methods > Accept Optimization.
If you accept the optimization, the attributes of the optimized promotion are copied into the original promotion. Also notice that the color of the Evt Status series changes to green, to indicate that optimization has been accepted.
-
Optionally rerun simulation for a new net-lift analysis; see Running a Simulation.
-
Optionally right-click the promotion and launch either PMO: Promo Effect - Mfg or PMO: Promo Effect - Rtl.
See
-
PMO: Examining and Comparing Promotions - .Examining Promotions from the Manufacturer's Point of View
-
PMO: Examining and Comparing Promotions - Examining Promotions from the Retailer's Point of View.
-
Reference
PMO: Optimization Comparison
Basics
| Accessing this worksheet | Right-click a promotion and click Open With > PMO: Optimization Comparison. |
| Levels you can select | Territory, Retailer, Promotion |
| Levels used in cross tabulation | Promotion Group, Scenario |
| Time aggregation | Yearly |
Business Data
| View | Series | Description |
|---|---|---|
| Event Planner | Start Ship | Date when product will start to ship |
| End Ship | Date when shipments will end for the event | |
| Start Event | Date when promotion starts in stores | |
| # Wks | Event length in whole weeks, assuming that each week starts on Monday. | |
| Veh Type | Vehicle type or event type of the promotion | |
| Veh $ | Vehicle cost for the promotion | |
| Cons Promo | Consumer overlay, the deal type as seen by the consumer. | |
| Shelf Price | Everyday price to the consumer | |
| Sale Price | Sale price per unit at shelf | |
| Buydown | Buydown allowance per unit, discount offered to retailer for running the event | |
| Lift | Lift factor for the promotion | |
| Base Evt Vol | Base volume during the promotion | |
| Incr Evt Vol | Incremental volume due to the promotion | |
| Ttl Evt Vol | Total volume for the promotion | |
| Optimized - Event Planner | Start Ship | Date when product will start to ship |
| End Ship | Date when shipments will end for the event | |
| Start Event O | Date when optimized promotion starts in stores | |
| # Wks O | Event length in whole weeks, assuming that each week starts on Monday, for optimized promotion | |
| Veh Type O | Vehicle type or event type of the optimized promotion | |
| Veh $ O | Vehicle cost for the optimized promotion | |
| Cons Promo | Consumer overlay, the deal type as seen by the consumer. | |
| Shelf Price | Everyday price to the consumer | |
| Sale Price O | Sale price per unit at shelf, for the optimized promotion | |
| Buydown O | Buydown allowance per unit, for optimized promotion | |
| Lift O | Lift factor for the optimized promotion | |
| Base Evt Vol O | Base volume for optimized promotion | |
| Incr Evt Vol O | Incremental volume due to the optimized promotion | |
| Ttl Evt Vol O | Total volume for the optimized promotion | |
| Cost Benefit Review | Base Evt $ | Base sales for the manufacturer, during the promotion |
| Incr Evt $ | Incremental sales to the manufacturer due to the event | |
| Ttl Evt $ | Total sales during the promotion, for the manufacturer | |
| Mfg Profit | Manufacturer's profit from the event | |
| Incr Mfg Prft | Incremental profit to the manufacturer due to the promotion | |
| Rtl Prft | Retailer's profit from the event | |
| Incr Rtl Prft | Incremental profit to the retailer due to the promotion | |
| Evt Spend exS | Total planned buydown and vehicle costs for promotion | |
| CPIU | Event cost per incremental unit sold as a result of the promotion. | |
| % Spend | Event spending, as a percentage of event sales | |
| Evt Status | Current status of the promotion | |
| Optimized - Cost Benefit Review | Base Evt $ O | Base sales for manufacturer, for optimized promotion |
| Incr Evt $ O | Incremental sales to the manufacturer due to the event, for the optimized promotion | |
| Ttl Evt $ O | Total sales during the promotion, for the manufacturer (for the optimized promotion) | |
| Mfg Prft O | Manufacturer's profit from the optimized event | |
| Incr Mfg Prft O | Incremental profit to the manufacturer due to the optimized promotion | |
| Rtl Prft O | Retailer's profit from the optimized event | |
| Incr Rtl Prft O | Incremental profit to the retailer due to the optimized promotion | |
| Evt Spend exS O | Total planned buydown and vehicle costs for optimized promotion | |
| CPIU O | Event cost per incremental unit sold as a result of the promotion, for optimized promotion | |
| % Spend O | Event spending, as a percentage of event sales, for optimized promotion | |
| Sales Comparison | Ttl Evt $ | Total sales during the promotion, for the manufacturer |
| Ttl Evt $ O | Total sales during the promotion, for the manufacturer (for the optimized promotion) | |
| Incr Mfg Prft Comparison | Incr Mfg Prft | Incremental profit to the manufacturer due to the promotion |
| Incr Mfg Prft O | Incremental profit to the manufacturer due to the optimized promotion | |
| Incr Rtl Prft Comparison | Incr Rtl Prft | Incremental profit to the retailer due to the promotion |
| Incr Rtl Prft O | Incremental profit to the retailer due to the optimized promotion | |
| Spend Comparison | Evt Spend exS | Total planned buydown and vehicle costs for promotion |
| Evt Spend exS O | Total planned buydown and vehicle costs for optimized promotion |