PMO: Examining and Comparing Promotions
This chapter covers the following topics:
- Overview
- Examining Promotions from the Manufacturer's Point of View
- Examining Promotions from a Retailer's Point of View
- Comparing Promotions in a Scenario
- Reference
Overview
This chapter describes how to examine and compare promotions, to help you choose the best promotion for your needs. It includes the following sections:
Before you mark a promotion as planned (or before you commit a promotion), you generally examine the promotion to be sure you have chosen the best vehicle type and so on.
To evaluate promotions, you generally start in the Planning Environment worksheet. From there, you right-click a promotion and launch any of the relevant PMO worksheets to see data for that promotion.
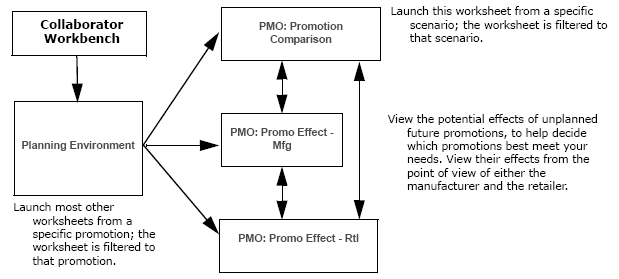
Or, to compare multiple promotions, you right-click a scenario and launch a worksheet to view the promotions in that scenario side-by-side. As shown here, you can also open one worksheet from another, to look at the same promotion in a different way.
You may also want to run simulation, optimization, or both, as described in "PMO: Simulation and Optimization."
Examining Promotions from the Manufacturer's Point of View
To evaluate a future promotion from the manufacturer's point of view
-
You typically start in the Planning Environment; see Introduction to the Planning Environment.
-
In the Event Planner window, right-click a promotion and click Open With > PMO: Promo Effect - Mfg.
-
If the worksheet does not show data immediately, click Data > Rerun. Or click the Run button.
The system displays the PMO: Promo Effect - Mfg worksheet, filtered to display just the promotion that you right-clicked.
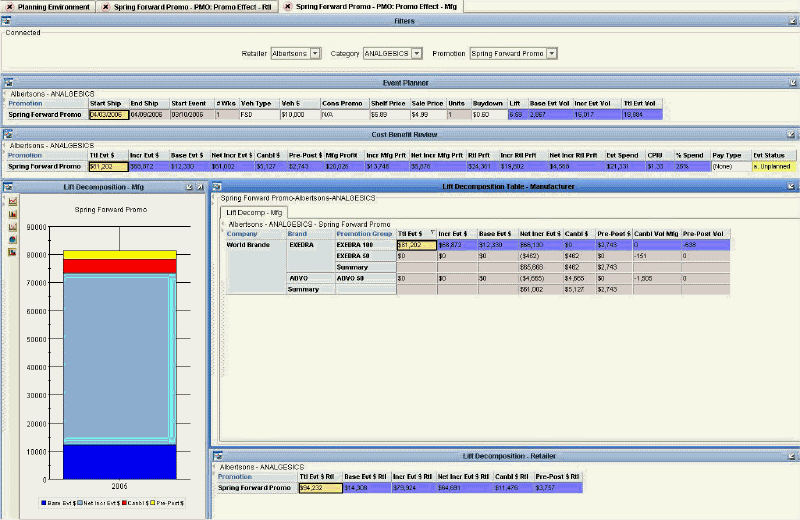
This worksheet includes the following areas.
Event Planner
This window is the same as the Event Planner window in the Planning Environment worksheet. It displays details of all events, including start and end ship dates, vehicle type, vehicle cost, buydown, base volume and incremental volume.
Cost Benefit Review
This window is similar to the Cost Benefit Review window in the Planning Environment worksheet. It displays a detailed cost benefit analysis, including profitability metrics, overall event spend, and cost per incremental unit (CPIU).
Lift Decomposition Graph - Manufacturer
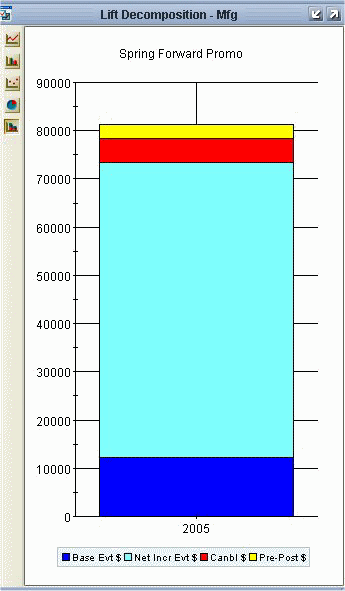
This window shows the effects of the promotion, from the perspective of the manufacturer.
-
Base Evt Value is the base money earned by the manufacturer over the course of the promotion. This money would have been earned even without the promotion.
-
Canbl Value P is the net additional money earned by the manufacturer as a result of the promotion; this accounts for both cannibalization and pre- and post-effects.
-
Canbl $ is the money lost by the manufacturer due to cannibalistic effects of the promotion. For display purposes only, this is shown as a positive number so that it can be graphed.
-
Pre Post Sales is the money lost by the manufacturer due to decreased sales before and after the promotion. For display purposes only, this is shown as a positive number so that it can be graphed.
The total height of the bar graph indicates how much money the manufacturer received in sales, if cannibalization and pre- and post-effects were ignored.
Lift Decomposition Table - Manufacturer
The Lift Decomposition table displays the same numbers as the preceding graph, but displays all promotion groups that were impacted by the selected promotion. Each promotion group is shown as a row; the blue row indicates the promotion group on which the selected promotion actually ran. This table also summarizes the effects across brands, and across companies, for convenient comparison.

For the promoted promotion group (Exedra 100), you can see the total event dollars, incremental event dollars, net incremental event dollars and so on, for the selected promotion. Note that for Exedra 100, there was zero dollars of cannibalization and $2743 of pre- and post-promotional effect.
On the other hand, examine the other promotion groups and notice that they were all cannibalized. Of course, for these promotion groups, there was zero direct lift, by definition, as the promotion did not run on them.
Here you can see these useful summaries:
-
Total for promotion group where the promotion was run.
-
Total effect on the brand.
-
Total effect on the manufacturer.
Also notice that this table displays cannibalized and pre- and post-event volume, as well.
Lift Decomposition - Retailer
This table summarizes the cannibalization effects as seen by the retailer; see Examining Promotions from a Retailer's Point of View for details.

Possible Actions
In this worksheet, depending on your authorization, you can do the following:
-
Edit a promotion, by changing the sale price and other properties. You can also right-click a promotion and select Edit to access other properties.
-
Run simulations. See Running a Simulation.
-
Run optimization. See Optimizing a Promotion.
-
Use the right-click menu to open other worksheets filtered to this promotion. For example, you can open the PMO: Promo Effect - Rtl worksheet to see the retailer's perspective. See Examining Promotions from a Retailer's Point of View.
-
View aggregate information for the retailer at the bottom of the screen.
Examining Promotions from a Retailer's Point of View
To evaluate a future promotion from a retailer's point of view
-
You typically start in the Planning Environment; see "Introduction to the Planning Environment.
-
In the Event Planner window, right-click a promotion and click Open With > PMO: Promo Effect - Rtl.
-
If the worksheet does not show data immediately, click Data > Rerun. Or click the Run button.
The system displays the PMO: Promo Effect - Rtl worksheet, filtered to display just the promotion that you right-clicked.
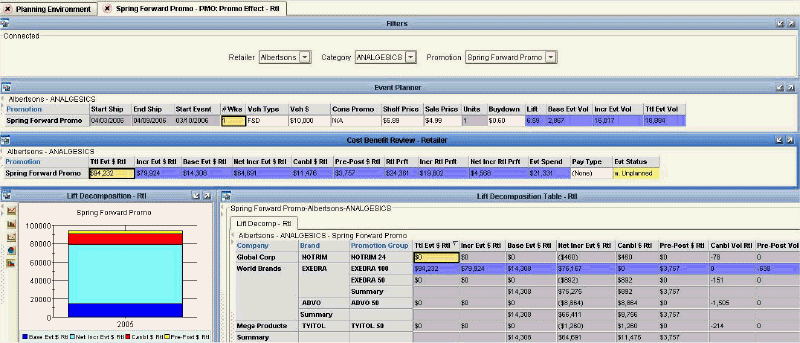
This worksheet includes the same areas as the PMO: Promo Effect - Mfg worksheet, but from the retailer's point of view rather than the manufacturer's.
Lift Decomposition Table - Retailer
The Lift Decomposition table displays all promotion groups that were impacted by the selected promotion, from the point of view of the retailer. Each promotion group is shown as a row; the blue row indicates the promotion group (Exedra 100) on which the selected promotion actually ran.

Notice two promotion groups are listed here that were not seen in the manufacturer version: Notrim 24 and Tyitol 50. These promotion groups represent products that this retailer sells, but that are made by a different manufacturer. To the retailer, it is undesirable to cannibalize these promotion groups.
Here you can see these useful summaries:
-
Total for promotion group where the promotion was run.
-
Total effect on the brand.
-
Total effect on each manufacturer.
Also notice that this table displays cannibalized and pre- and post-event volume, as well.
Possible Actions
In this worksheet, depending on your authorization, you can do the following:
-
Edit a promotion, by changing the sale price and other properties. You can also right-click a promotion and select Edit to access other properties.
-
Run simulations. See "Running a Simulation."
-
Run optimization. See "Optmizing a Promotion."
-
Use the right-click menu to open other worksheets filtered to this promotion. For example, you can open the PMO: Promo Effect - Mfg worksheet to see the manufacturer's perspective. See "Examining Promotions from the Manufacturer's Point of View." .
Comparing Promotions in a Scenario
To determine how best to spend trade dollars, you can compare and evaluate multiple promotions in a scenario. Typically you create multiple unplanned promotions in the Sandbox scenario and then open the PMO: Promotion Comparison worksheet to view them side by side.
When you identify the best promotion, you can mark it as planned; see Marking a Promotion as Planned.
To compare promotions
-
You typically start in the Planning Environment; see "Introduction to the Planning Environment."
-
In the Event Planner window, right-click a scenario and click Open.
-
If the worksheet does not show data immediately, click Data > Rerun. Or click the Run button.
This launches the PMO: Promotion Comparison worksheet filtered to show the promotions of that scenario.
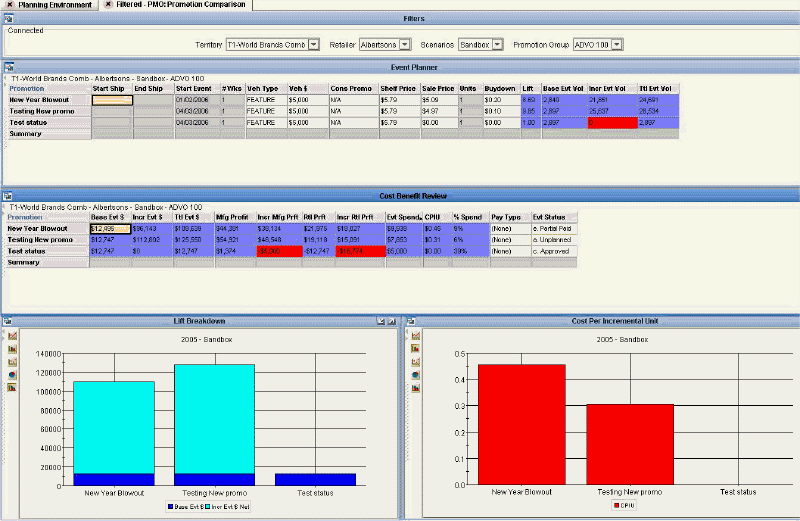
Now you can easily compare all events in the selected scenario. The screen now displays the following areas.
Event Planner
This window is the same as the Event Planner window in the Planning Environment worksheet. It displays details of all events, including start and end ship dates, vehicle type, vehicle cost, buydown, base volume and incremental volume. Incremental volume is generated by Oracle's comprehensive Analytical Engine.
Cost Benefit Review
This window is the same as the Cost Benefit Review window in the Planning Environment worksheet. It displays a detailed cost benefit analysis, including profitability metrics from both the manufacturer and retailer's perspective, overall event spend, cost per incremental unit (CPIU), payment type and price analysis (average retail vs. list).
Graphs
This worksheet displays the following graphs:
-
Lift Breakdown: each event is shown as a separate bar.
-
Cost Per Incremental Unit: each event is shown as a separate bar.
Possible Actions
In this worksheet, depending on your authorization, you can do the following:
-
Edit a promotion, by changing the sale price and other properties. You can also right-click a promotion and select Edit to access other properties.
-
Create new promotions; see Creating a Promotion.
-
Delete a promotion; see Deleting a Promotion.
-
Make a copy of a promotion; see Copying and Pasting a Promotion.
-
Run simulations. See Running a Simulation.
-
Run optimization. See Optimizing a Promotion.
-
Right-click a promotion and open another worksheet filtered to that promotion. For example, you can open the PMO: Promo Effect - Rtl worksheet to see cannibalization from the retailer's perspective. See Examining Promotions from a Retailer's Point of View.
-
Change the status of a promotion, as described in PMO: Planning Promotions - Introduction to the Planning Environment.
Reference
PMO: Promo Effect - Mfg
Basics
| Accessing this worksheet | Right-click a promotion and click Open With > PMO: Promo Effect - Mfg. |
| Levels you can select | Retailer, Category, Promotion |
| Levels used in cross tabulation | Promotion |
| Time aggregation | Yearly |
Business Data
| View | Series | Description |
|---|---|---|
| Event Planner | Start Ship | Date when product will start to ship |
| End Ship | Date when shipments will end for the event | |
| Start Event | Date when promotion starts in stores | |
| # Wks | Event length in whole weeks, assuming that each week starts on Monday. | |
| Veh Type | Vehicle type or event type of the promotion | |
| Veh $ | Vehicle cost for the promotion | |
| Cons Promo | Consumer overlay, the deal type as seen by the consumer. | |
| Shelf Price | Everyday price to the consumer | |
| Sale Price | Sale price per unit at shelf | |
| Units | Number of units in the deal to the consumer. Usually equal to 1. Use 2 for 2-for-1 sales, for example. | |
| Buydown | Buydown allowance per unit, discount offered to retailer for running the event | |
| Lift | Lift factor for the promotion | |
| Base Evt Vol | Base volume during the promotion | |
| Incr Evt Vol | Incremental volume due to the promotion | |
| Ttl Evt Vol | Total volume for the promotion | |
| Cost Benefit Review | Ttl Evt $ | Total sales during the promotion, for the manufacturer |
| Incr Evt $ | Incremental sales to the manufacturer due to the event | |
| Base Evt $ | Base sales for the manufacturer, during the promotion | |
| Net Incr Evt $ | Net revenue to the manufacturer, after considering cannibalization and pre- and post-effects | |
| Canbl $ | Cannibalization dollars for the manufacturer | |
| Pre Post $ | Total sales made before and after the promotion, as a result of the promotion (manufacturer's perspective) | |
| Mfg Profit | Manufacturer's profit from the event | |
| Incr Mfg Prft | Incremental profit to the manufacturer due to the promotion | |
| Net Incr Mfg Prft | Net incremental profit for the manufacturer, after considering cannibalization and pre- and post-effects | |
| Rtl Prft | Retailer's profit from the event | |
| Incr Rtl Prft | Incremental profit to the retailer due to the promotion | |
| Net Incr Rtl Prft | Net incremental profit for the retailer, after considering cannibalization and pre- and post-effects | |
| Evt Spend | Total planned spending for promotion, sum of buydown, vehicle costs, and slotting | |
| CPIU | Event cost per incremental unit sold as a result of the promotion. | |
| % Spend | Event spending, as a percentage of event sales | |
| Cost Benefit Review | Pay Type | Indicates the payment terms between the manufacturer and the retailer for this promotion |
| Evt Status | Current status of the promotion | |
| Lift Decomposition - Mfg | Base Evt $ | Base sales for the manufacturer, during the promotion |
| Net Incr Evt $ | Net revenue to the manufacturer, after considering cannibalization and pre- and post-effects | |
| Canbl $ | Cannibalization dollars for the manufacturer | |
| Pre Post $ | Total sales made before and after the promotion, as a result of the promotion (manufacturer's perspective) | |
| Lift Decomposition Table - Manufacturer | Ttl Evt $ | Total sales during the promotion, for the manufacturer |
| Incr Evt $ | Incremental sales to the manufacturer due to the event | |
| Base Evt $ | Base sales for the manufacturer, during the promotion | |
| Net Incr Evt $ | Net revenue to the manufacturer, after considering cannibalization and pre- and post-effects | |
| Canbl $ | Cannibalization dollars for the manufacturer | |
| Pre Post $ | Total sales made before and after the promotion, as a result of the promotion (manufacturer's perspective) | |
| Canbl Vol Mfg | ||
| Pre Post Vol | Total volume before and after the promotion, as a result of the promotion | |
| Lift Decomposition - Retailer | Ttl Evt $ Rtl | Total sales during the promotion, for the retailer |
| Base Evt $ Rtl | Base sales for the retailer, during the promotion | |
| Incr Evt $ Rtl | Incremental sales to the retailer due to the event | |
| Net Incr Evt $ Rtl | Net revenue to the retailer, after considering cannibalization and pre- and post-effects | |
| Canbl $ Rtl | Cannibalization dollars for the retailer | |
| Pre Post Value Rtl | Total sales made before and after the promotion, as a result of the promotion (retailer's perspective) |
PMO: Promo Effect - Rtl
Basics
| Accessing this worksheet | Right-click a promotion and click Open With > PMO: Promo Effect - Rtl. |
| Levels you can select | Retailer, Category, Promotion |
| Levels used in cross tabulation | Promotion |
| Time aggregation | Yearly |
Business Data
| View | Series | Description |
|---|---|---|
| Event Planner | Start Ship | Date when product will start to ship |
| End Ship | Date when shipments will end for the event | |
| Start Event | Date when promotion starts in stores | |
| # Wks | Event length in whole weeks, assuming that each week starts on Monday. | |
| Veh Type | Vehicle type or event type of the promotion | |
| Veh $ | Vehicle cost for the promotion | |
| Cons Promo | Consumer overlay, the deal type as seen by the consumer. | |
| Shelf Price | Everyday price to the consumer | |
| Sale Price | Sale price per unit at shelf | |
| Units | Number of units in the deal to the consumer. Usually equal to 1. Use 2 for 2-for-1 sales, for example. | |
| Buydown | Buydown allowance per unit, discount offered to retailer for running the event | |
| Lift | Lift factor for the promotion | |
| Base Evt Vol | Base volume during the promotion | |
| Incr Evt Vol | Incremental volume due to the promotion | |
| Ttl Evt Vol | Total volume for the promotion | |
| Cost Benefit Review - Retailer | Ttl Evt $ Rtl | Total sales during the promotion, for the retailer |
| Incr Evt $ Rtl | Incremental sales to the retailer due to the event | |
| Base Evt $ Rtl | Base sales for the retailer, during the promotion | |
| Net Incr Evt $ Rtl | Net revenue to the retailer, after considering cannibalization and pre- and post-effects | |
| Canbl $ Rtl | Cannibalization dollars for the retailer | |
| Pre-Post $ Rtl | Total sales made before and after the promotion, as a result of the promotion (retailer's perspective) | |
| Rtl Prft | Retailer's profit from the event | |
| Incr Rtl Prft | Incremental profit to the retailer due to the promotion | |
| Net Incr Rtl Prft | Net incremental profit for the retailer, after considering cannibalization and pre- and post-effects | |
| Evt Spend | Total planned spending for promotion, sum of buydown, vehicle costs, and slotting | |
| Pay Type | Indicates the payment terms between the manufacturer and the retailer for this promotion | |
| Evt Status | Current status of the promotion | |
| Lift Decomposition - Rtl | Base Evt $ Rtl | Base sales for the retailer, during the promotion |
| Net Incr Evt $ Rtl | Net revenue to the retailer, after considering cannibalization and pre- and post-effects | |
| Canbl $ Rtl | Cannibalization dollars for the retailer | |
| Pre Post Value Rtl | Total sales made before and after the promotion, as a result of the promotion (retailer's perspective) | |
| Lift Decomposition Table - Retailer | Ttl Evt $ Rtl | Total sales during the promotion, for the retailer |
| Incr Evt $ Rtl | Incremental sales to the retailer due to the event | |
| Base Evt $ Rtl | Base sales for the retailer, during the promotion | |
| Net Incr Evt $ Rtl | Net revenue to the retailer, after considering cannibalization and pre- and post-effects | |
| Net Incr Rtl Prft | Net incremental profit for the retailer, after considering cannibalization and pre- and post-effects | |
| Canbl $ Rtl | Cannibalization dollars for the retailer | |
| Pre-Post $ Rtl | Total sales made before and after the promotion, as a result of the promotion (retailer's perspective) | |
| Canbl Vol Rtl | ||
| Pre Post Vol | Total volume before and after the promotion, as a result of the promotion |
PMO: Promotion Comparison
Basics
| Accessing this worksheet | Right-click a scenario and click Open. |
| Levels you can select | Territory, Retailer, Promotion Group |
| Levels used in cross tabulation | Scenario, Promotion |
| Time aggregation | Yearly |
Business Data
| View | Series | Description |
|---|---|---|
| Event Planner | Start Ship | Date when product will start to ship |
| End Ship | Date when shipments will end for the event | |
| Start Event | Date when promotion starts in stores | |
| # Wks | Event length in whole weeks, assuming that each week starts on Monday. | |
| Veh Type | Vehicle type or event type of the promotion | |
| Veh $ | Vehicle cost for the promotion | |
| Cons Promo | Consumer overlay, the deal type as seen by the consumer. | |
| Shelf Price | Everyday price to the consumer | |
| Sale Price | Sale price per unit at shelf | |
| Units | Number of units in the deal to the consumer. Usually equal to 1. Use 2 for 2-for-1 sales, for example. | |
| Buydown | Buydown allowance per unit, discount offered to retailer for running the event | |
| Lift | Lift factor for the promotion | |
| Base Evt Vol | Base volume during the promotion | |
| Incr Evt Vol | Incremental volume due to the promotion | |
| Ttl Evt Vol | Total volume for the promotion | |
| Cost Benefit Review | Base Evt $ | Base sales for the manufacturer, during the promotion |
| Incr Evt $ | Incremental sales to the manufacturer due to the event | |
| Ttl Evt $ | Total sales during the promotion, for the manufacturer | |
| Mfg Profit | Manufacturer's profit from the event | |
| Incr Mfg Prft | Incremental profit to the manufacturer due to the promotion | |
| Rtl Prft | Retailer's profit from the event | |
| Incr Rtl Prft | Incremental profit to the retailer due to the promotion | |
| Evt Spend exS | Total planned buydown and vehicle costs for promotion | |
| CPIU | Event cost per incremental unit sold as a result of the promotion. | |
| % Spend | Event spending, as a percentage of event sales | |
| Pay Type | Indicates the payment terms between the manufacturer and the retailer for this promotion | |
| Evt Status | Current status of the promotion | |
| Lift Breakdown | Base Evt $ | Base sales for the manufacturer, during the promotion |
| Incr Evt $ Net | ||
| Cost Per Incremental Unit | CPIU | Event cost per incremental unit sold as a result of the promotion. |