Events
This chapter covers the following topics:
- About Events
- Business Applications
- Promotions
- New Product Introductions and Cannibalization
- Product Phase Outs
- Events Calendar
About Events
This section provides a detailed discussion on how to define and manage events. Any occurrence that is expected to impact the sales or demand is termed as events here. Some different types of events are promotions, new product introductions, cannibalization, phasing out products, store openings and closings, new features and changes in existing product, introduction of products to the new markets.
Any business needs to plan ahead for all these events and analyze their potential effect on future demand. The outcome of such an analysis may be in the form of a lift or modification factor. The positive modification factor would indicate increased sales while a negative modification factor would indicate cannibalization or reduced sales. For example, 10% reduction in the retail price of product A may result in a 15% lift in its sales but a 3% reduction in sales for product B.
Oracle Demand Planning has a user interface to define such events and their impacts on future sales that can vary by product, time, and market. The events so planned and defined are considered for calculating a demand forecast as shown in the figure below.
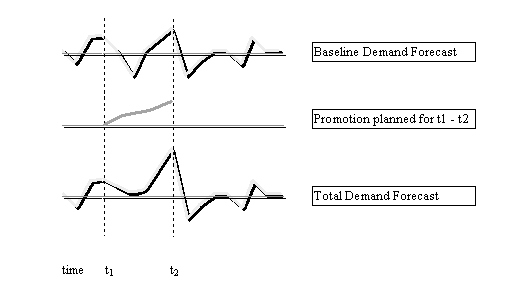
Supported event types
-
Promotions and other events: events for those existing products for which some history data is available to generate a baseline forecast and for which the impact of an event can be defined in terms of modification factors for base demand and price. Some such events are: price reductions to clear the inventory, advertising campaigns, a new product introduced by the competition, and a Christmas week sales promotion.
-
New product introductions and cannibalization: events for those existing or new products for which history data is not available but which are expected to sell, similar to some existing products with known sales history or forecast. The baseline forecast is generated on the basis of available data and can be modified by applying suitable modification factors. Some such events are: new product introductions or product introduction in new markets.
-
Product phase outs: events for products nearing the end of life when the sales of those products is expected to become flat or reduce at some rate to zero and the impact of event can be defined in terms of modification factors. Some such events are: removing a product from a certain market, product declared unsafe, or product replaced by the next generation.
Event modeling capability
It is possible to specify all the items that the event affects and the time period for which the event is effective. The expected increase or decrease in demand and price for each event can also be specified. Any such impact of an event could be multiplicative, additive, or subtractive. The user is able to enter the absolute values or the change in value. For example, if the event is a promotion or introduction of a product, the impact could be in the form of a increase by percentage modification factor. However, such an event, like reduced sales, may lead to cannibalization or phase out of other products, for which the impact could be a decrease by percentage modification factor.
Different modifications factors can be specified for different time periods. For example, it is possible to specify percentage increase in demand by 10% and 20% for two different time periods within the effective period of a promotion.
Event impacts can also vary by region, market, and sales channel. To model this requirement, different modification factors can be defined for any dimension, such as geography and sales channel, supported by Oracle Demand Planning. Within the dimension, different modifications can also be specified for various levels, for example: region, country, and ship-to-location for the geography dimension. It is common to see a marketing campaign that does well in one market and not well in another. Such situations can be handled by specifying a increase in sales by 10% for western region and a decrease in sales by 400 for the eastern region and the direct sales channel.
Note: Events are downloaded with four user dimensions: geography, product, time, and organization. Collapsed dimensions like demand class are downloaded as a hierarchy of one of the user dimensions (like geography). Although the event works with the collapsed dimension, the collapsed dimension name is not shown as the event qualification in the shared database.
Simulation capability
After the events have been completely defined, they can be associated with a scenario. Multiple events can be associated with a scenario and multiple scenarios are allowed to be associated with an event. This feature provides unlimited what-if events analysis capability. It may be recalled here that multiple scenarios can be defined within a demand plan in the demand planning server. For example, the optimistic forecast scenario may include promotions with higher estimate of increase in sales or lower estimate of reduction in price. The events associated with a scenario are applied on top of the base forecast for that scenario.
Conflict resolution
If there is a conflict when a product is covered by two events, there exists precedence logic to resolve it. Alternative events can be accurately modeled by assigning priority at the time of associating an event with the scenario. This obviates the need for multiple definitions of the same event just to change the priority. The priority determines the order in which the events are applied.
Business Applications
To increase the sales, clear excess inventory, expand existing markets or build new ones, improve margins, match the competition, or improve investor or company morale, events are planned by most companies. Because the company may be offering many similar products, increases in the sales of one product may cannibalize (reduce) the sales of other similar product. Introducing a new product may also reduce the sale of another similar spatial variety and may lead to end-of- life phasing out of an existing product. Such events and their impacts, different for different dimensions, can be defined in the Demand Planning Server at Events and Product Introductions under Demand Planning System Administration responsibility in the navigator window.
Sample business application
A company has two models, 00FLMA and 00FLMB, in the light motor car segment. It decides to introduce a new model 00FLMF on 1 June 2001. Hereinafter, these models are respectively called A, B, and F for simplicity. F is expected to sell 20% more during 2001 than what model A would have sold. The demand for A is expected to decrease by 50% due to introduction of F. The company also decides to reduce the price of model B by 5% starting 1 April 2001 only in the United States, which is expected to increase the sale of B in the United States by 10% for first two months but only 5% afterwards due to introduction of F. The company expects to phase out model A during the year 2002 as follows:
-
United States only from 01/01/2002 to 03/31/2002 by 25%.
-
All geography from 04/01/2002 to 06/30/2002 by 25% and afterwards to death at the end of the year 2002.
Procedure for defining events
Oracle Demand Planning supports global events as well as personal events. Global events are defined by the Demand Planning Administrator, and are available to all the demand planners. Global events are universal in scope that is they may cover events across planners' demand scope. Personal events are defined and used by demand planners within each planner's own demand scope. For details, see: Events.
The following procedure describes how you would define global events in the Demand Planning Server for the sample business application.
To define events:
-
Choose the Demand Planning Administrator responsibility.
-
In the Navigator, select Events and Product Introductions > Promotions and Other Events.
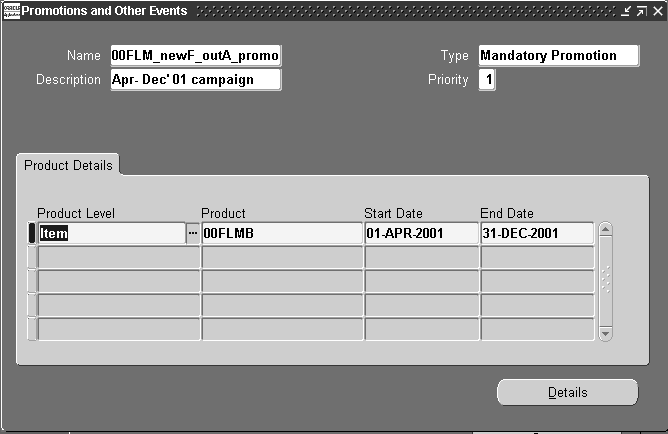
-
Select Details to open the Details window.
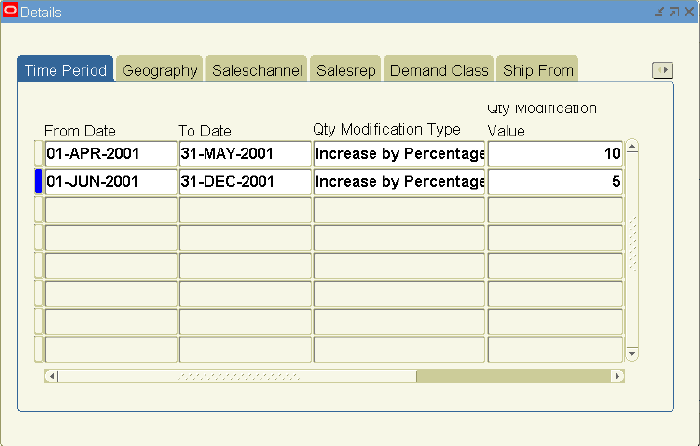
-
Complete the fields in the Details window as follows:
Field Value From Date First Row: 01-APR-2001. Second Row: 01-JUN-2001. To Date First Row: 31-MAY-2001. Second Row: 31-DEC-2001. Qty. Modification Type Both Rows: Increase by Percentage. Qty. Modification Value First Row: 10. Second Row: 5. -
Price modification of 5% for this scenario can be specified if users scroll to the right and:
-
Select the Geography tab.
-
Select the following geography values:
-
Geography column, first row is Country.
-
Geography Value column, first row is United States.
-
Geography column, second row is Country.
-
Geography Value column, second row is United States.
At this point, you have modeled the following part of the scenario:
The existing forecast for B (from 1 April 2001 to 31 December 2001) in the United States is increased by 10% during 1 April 2001 to 31 May 2001 and by 5% during 1 June 2001 to 31 December 2001. The revenue forecast for B in the United States during the period from 1 April 2001 to 31 December 2001 decreases by 5%.
-
-
To open the New Product Introduction window, select Events and Product Introduction > New Product Introductions and Cannibalization in the Navigator.
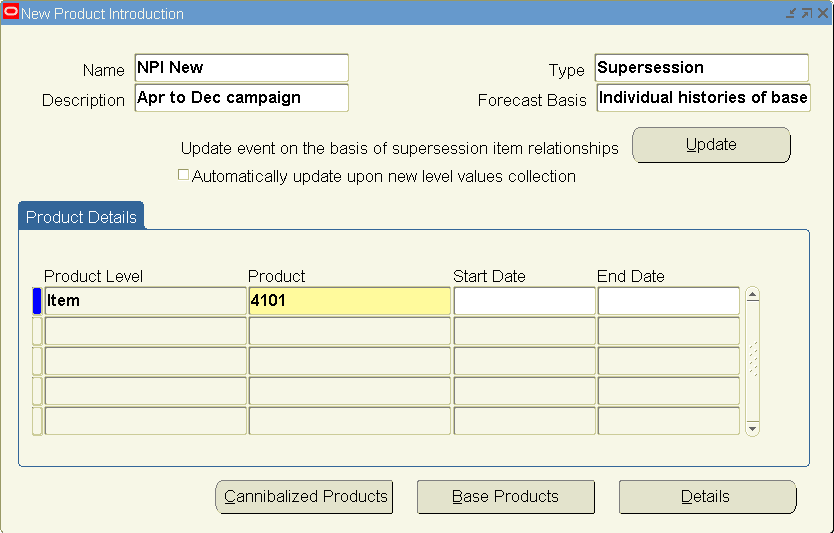
-
Complete the fields in the New Product Introduction window as follows:
Field Value Name NPI New Description Apr to Dec Campaign Type Supersession Forecast Basis Individual histories of base products Product Level Item Product 4101 Start Date - End Date - -
Select the Details tab to open the Details window.
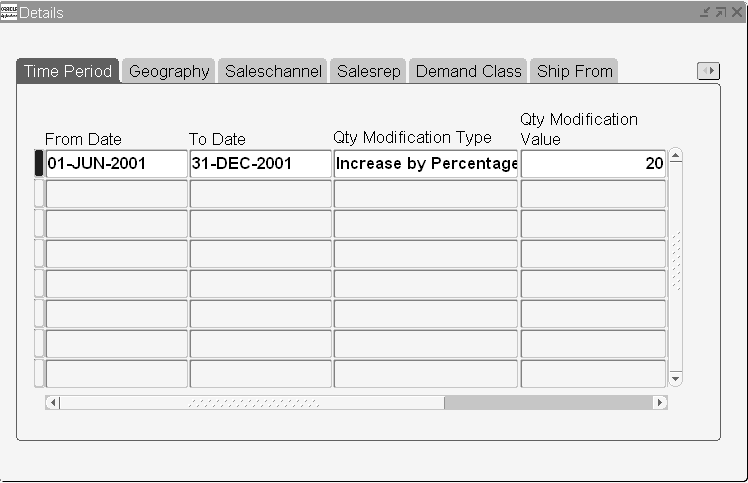
-
Complete the fields in the Details window as follows:
Field Values From Date 01-JUN-2001 To Date 31-DEC-2001 Qty Modification Type Increase by Percentage Qty Modification Value 20 -
Close the Details window.
The New Product Information window reappears.
-
Select Base Product to open the Base Products window.
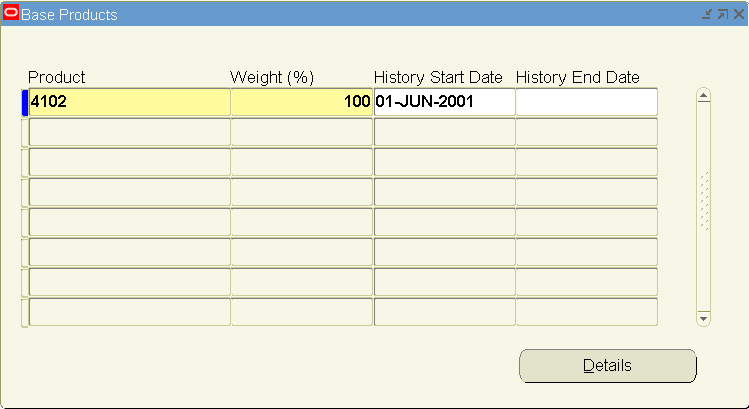
-
Complete the fields in the Base Products window as follows:
Field Value Product 4102 Weight 100 History Start Date 01-JUN-2001 History End Date - Though not required for this scenario, details for base products can also be entered. Also, any number of base products with varying weights (total should be 100) can be used to model the forecast of new product. Weight % for a base product determines the fraction of its forecast that is used as the forecast of the new product.
-
Close the Base Products window.
The New Product Information window reappears.
-
Select Cannibalized Products to open the Cannibalized Products window.
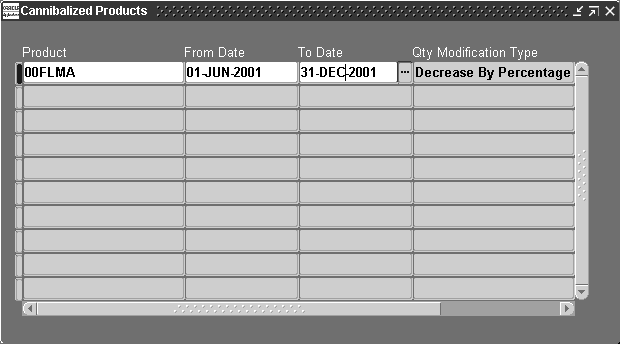
-
Complete the fields in the Cannibalized Products window as follows:
Field Value Product 00FLMA From Date 01-JUN-2001 To Date 31-DEC-2001 Qty Modification Type Decrease by Percentage Qty Modification Value 50 At this point, you have modeled the following part of the scenario:
The existing forecast for A from 1 June, 2001 to 31 December, 2001 is increased by 20% and is considered as the forecast for model F during the same period. On the other hand, the same existing forecast for model A is decreased by 50% and is considered as the new forecast for A.
-
To open the Product Phase Out window, select Events and Product Introductions > Product Phase Out in the Navigator.
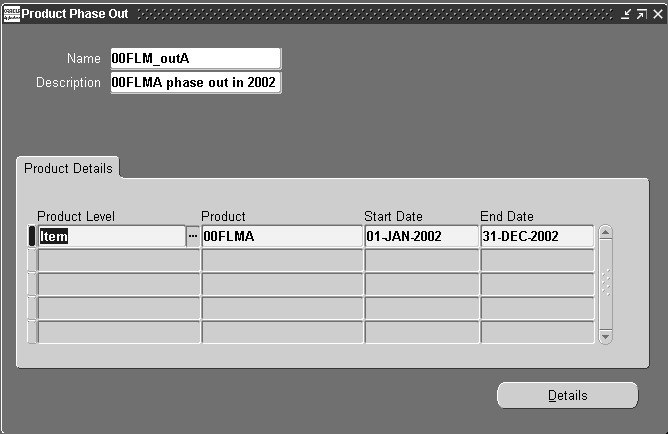
-
Complete the fields in the Product Phase Out window as follows:
Field Value Name 00FLM_outA Description 00FLMAphase out in 2002 Product Level Item Product 00FLMA Start Date 01-JAN-2002 End Date 31-DEC-2002 If you want to start with the reduced forecast on 01 January, 2002 due to cannibalization (in step 17), the Start Date should be entered here as 01 January, 2002.
-
Select Details.
The Details window appears.
-
Complete the fields in the Details window as follows:
Field Values From Date First Row: 01-JAN-2002.
Second Row: 31-MAR-2002.
Third Row: 30-JUN-2002.To Date First Row: 31-MAR-2002.
Second Row: 30-JUN-2002.
Third Row: 31-DEC-2002.Qty Modification Type All three rows: Decrease by Percentage. Qty Modification Value First Row: 25.
Second Row: 25.
Third Row: 100. -
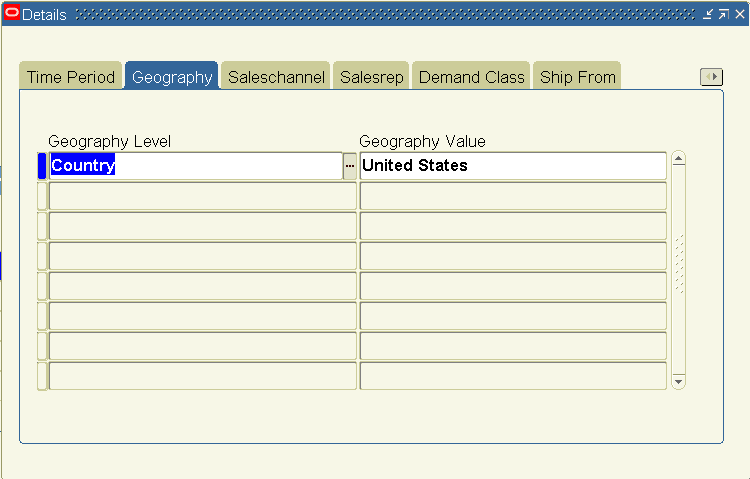
Click the Geography tab to open the Details window for Geography.
-
Complete the fields in the Details window as follows:
Field Value Geography First Row is Country (this row has been added to the screenshot).
Second Row is All Geography.
Third Row is All Geography.Geography Value First Row is United States (this has been added to the screenshot).
Second Row is All Geography.
Third Row is All Geography.
At this point, you have modeled the following part of the scenario:
-
For United States: The forecast for A linearly decreases by 25% on 31 March 2002 from its value on 1 January 2002 and then by another 25% on 30 June 2002 from its decreased value on 31 March 2002. It reduces to zero on 31 December 2002 from the reduced value on 30 June 2002.
-
For all geography except United States: The forecast for A remains unchanged for 1 January 2002 to 31 March 2002, and then linearly decreases by 25% on 30 June 2002 from its value on 31 March 2002. It reduces to zero on 31 December 2002 from the reduced value on 30 June 2002.
Events can be associated to either demand plans or scenarios.
-
To associate events to demand plans, use the events tab on the demand plans form so that the events are available for all forecast scenarios.
To associate events to scenarios, follow the instructions in Procedure to define a Demand Plan. Stop after performing the first step in Scenarios.
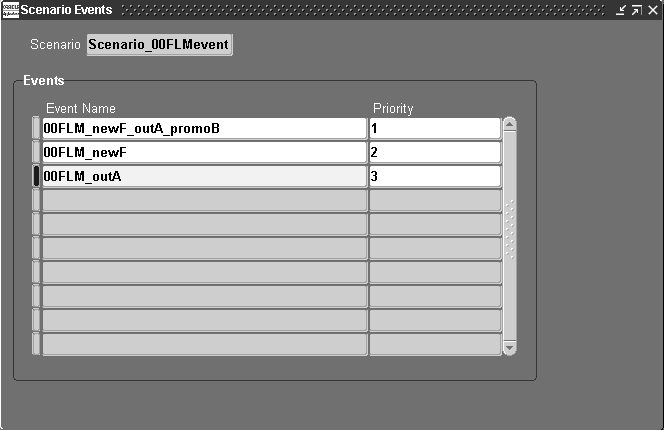
At the end of that step, select Events to open the Scenario Events window.
-
Associate the three defined events; promotion (in steps 2 through step 7), new product introduction (in steps 8 through 17), and product phase out (in steps 18 through 23) to a scenario and specify priority for each association as shown in the following table:
Field Value Scenario Default value Event Name Select the event name Priority Enter the priority number Priority indicates the order in which the events are applied. Within the same priority, the events are applied in the order of their creation in the system and thus the event priority should always be specified. When the corresponding demand plan is used to generate the forecasts in the Demand Planning Engine, these events would be included in the event forecast.
Promotions
Mandatory and optional promotions
There are two types of promotions that can be defined (in step 1) in the Events section: mandatory and optional.
Note: Throughout Promotions, all references to steps refer to the steps in Events.
Mandatory promotion means that it is applied regardless of whether another promotion has been applied, while the optional promotion is applies when a mandatory promotion for the same item has not been applied. In addition to this, a priority can also be specified to resolve any conflicts between the two promotions of the same type. However, this priority is overridden by the priority specified at the time of associating a promotion to a scenario (in step 8). Two or more promotions can also be specified in one window, in which case the priority or the promotion type is the same for both promotions. In this situation, the promotions are applied in the order they are defined.
For example, if two mandatory promotions are defined during the same time period, first one at all product level with 10% modification factor and second for item A with 20% modification factor, these promotions would be applied successively. The result would be a lift of 10% for all products except for item A, which would have a 20% lift on top of the 10% lift.
Types of modifications
Multiple time periods with varying modifications can be defined for any promotion as shown (in steps 3 and 5). For each time period and quantity modification, one price modification type and value can be selected.
The quantity modification types are:
-
Increase by percentage, decrease by percentage, increase by quantity, decrease by quantity, and absolute.
The price modification types are:
-
Increase by percentage, decrease by percentage, increase by quantity, decrease by quantity, and absolute.
Details of promotions
While all other events can be defined for a product, the promotions can also be specified at other levels in the product dimension; product category and product family. For each promotion, at least one detailed entry needs to be made under Details as shown (in steps 3 and 5). This includes the time period (for example, From Date and To Date), type of modifications for quantity as well as price, and corresponding modification values. Various dimension levels and values can also be entered for each detail as indicated (in step 3). The values for the From Date and To Date (in steps 3 and 5) are defaulted from the Start Date and End Date on the main form (in step 1). The user can modify these values.
New Product Introductions and Cannibalization
Life cycle and supersession based new product introductions
The information about the existing products is used for generating forecasts for new products, as there are no historical data to use as a starting point. The existing products used in the context of modeling a new product introduction are referred to as base products. Any new product introduction can be modeled in two distinct ways (in steps 7 and 8). These are:
-
Life Cycle: refers to situations when the new product is expected to follow the demand patterns of some existing products. The historical sales data of one or more existing products during specified time periods is considered as the forecast for the new product with some specified time difference.
-
Supersession: refers to the replacement of the existing product(s) by a new product. There are two methods for modeling supersessions depending on whether the new sales data (as the sales come in) of the new product should or should not be used for forecasting purposes until the new product is matured:
-
Based on individual histories of base products: The forecasts of existing products are created on the basis of their individual historical sales data, modified by specified percentages, and added by specified weights to create the forecast of new product.
-
Based on combined histories of new and base products: The historical sales data of the existing products during the specified time periods is transferred to the new products and then the forecast for the new products is created on the basis of combined history of new and existing products.
-
Types of modification
Multiple time periods with varying modifications can be defined for any new product introduction (in step 10). There are no price modifications allowed for new product introduction events. The quantity modification types are: increase by percentage, and decrease by percentage.
Details of new product introductions
For each new product introduction event, at least one detailed entry needs to be made. This includes the time period, for example, From Date and To Date, type of modifications for quantity only, and corresponding modification values. The values for the From Date and To Date (in steps 10 and 11) are defaulted from the Start Date and End Date on the main form (in steps 7 and 8). The user can modify these values. Various dimension levels and values can also be entered for each detail. If no qualifications are specified, the event applies to all levels.
Service part supersessions can be modeled using new products. The New Product Introduction events can be used to enable service part supersessions in Oracle Demand Planning. You use combined histories of new and superseded parts to create forecast for the new parts.
For example, you can have the supersession of part A by part B for two consecutive planning cycles.
The forecast of the new part B is based on the combined history of part A and B. Assume that part B supersedes part A with effect from 1 Aug 03 as a service part of Itch equipment company. Part A is immediately phased out with no forecast for part A after 31 Jul 03. Also, assume that no Qty Modification Type/Value is specified.
For Planning Cycle 1, on 1 Aug 03
Original histories (before applying the event):
| Service Part | Booking History | Booking History | Booking History | Forecast | Forecast | Forecast |
|---|---|---|---|---|---|---|
| May 03 | Jun 03 | Jul 03 | Aug 03 | Sep 03 | Oct 03 | |
| Electrode A | 10 | 15 | 12 | |||
| Electrode B | NA | NA | NA |
Logic in applying the event:
| Service Part | Booking History | Booking History | Booking History | Forecast | Forecast | Forecast |
|---|---|---|---|---|---|---|
| May 03 | Jun 03 | Jul 03 | Aug 03 | Sep 03 | Oct 03 | |
| Electrode A | 10 | 15 | 12 | 0 | 0 | 0 |
| Electrode B | 10 | 15 | 12 | 16 | 13 | 17 |
Actual data and display after applying event:
| Service Part | Booking History | Booking History | Booking History | Forecast | Forecast | Forecast |
|---|---|---|---|---|---|---|
| May 03 | Jun 03 | Jul 03 | Aug 03 | Sep 03 | Oct 03 | |
| Electrode A | 10 | 15 | 12 | 0 | 0 | 0 |
| Electrode B | NA | NA | NA | 16 | 13 | 17 |
For Planning Cycle 2, on 1 Sep 03
Original histories (before applying the event):
| Service Part | Booking History | Booking History | Booking History | Forecast | Forecast | Forecast |
|---|---|---|---|---|---|---|
| Jun 03 | Jul 03 | Aug 03 | Sep 03 | Oct 03 | Nov 03 | |
| Electrode A | 15 | 12 | 5 | |||
| Electrode B | NA | NA | 10 |
Logic in applying the event:
| Service Part | Booking History | Booking History | Booking History | Forecast | Forecast | Forecast |
|---|---|---|---|---|---|---|
| Jun 03 | Jul 03 | Aug 03 | Sep 03 | Oct 03 | Nov 03 | |
| Electrode A | 15 | 12 | 5 | 0 | 0 | 0 |
| Electrode B | 15 | 12 | 15 | 12 | 16 | 13 |
Actual data and display after applying event:
| Service Part | Booking History | Booking History | Booking History | Forecast | Forecast | Forecast |
|---|---|---|---|---|---|---|
| Jun 03 | Jul 03 | Aug 03 | Sep 03 | Oct 03 | Nov 03 | |
| Electrode A | 15 | 12 | 5 | 0 | 0 | 0 |
| Electrode B | NA | NA | 10 | 12 | 16 | 13 |
You can automatically update the event on the basis of supersession item relationship, which is defined in Oracle Inventory and collected into Oracle Demand Planning during level values collection. The user can effect changes as necessary, including changing items and specifying dates or modifications.
From the Demand Planning System Administrator responsibility, select Events and Product Introductions > New Product Introductions and Cannibalization to open the New Product Introduction screen.
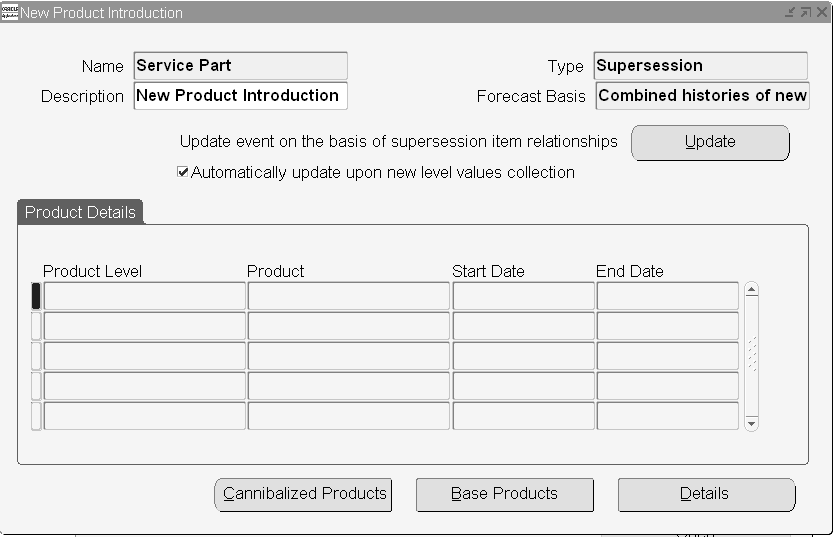
Complete the New Product Introduction window. If the Start Date is not specified, then the New Product Introduction event will be applied from the horizon start date of the forecast measure to which the event is associated. If the End Date is not specified, then the New Product Introduction event will be applied until the horizon end date of the forecast measure to which the event is associated.
For a supersession type New Product Introduction event, the Forecast Basis is enabled. The list of values are Combined histories of new and base products and Individual histories of base products.
-
Selecting Individual histories of base products enables supersession where the forecasts of base products are created on the basis of their individual histories, modified by specified percentages, and added by specified weights to create the forecast of new product.
-
Selecting Combined histories of new and base products is a new functionality allows the transfer of the history of base products to the new product. This means that the history during the historical dates of the base products is transferred to the new products, and the forecast for the new products is created for the New Product Introduction Start and End Dates on the basis of combined history of new and base products.
For a supersession type New Product Introduction event, when you select the Update button, the update event (on the basis of supersession item relationship) is generated using supersede item relationships. The item relationships are defined in Oracle Inventory and collected into Oracle Demand Planning during level value collection.
Rerunning the Update event process will refresh the event on the basis of current status (in other words, as of last collection of level values) of item relationships and the changes, if any, after the previous run will be lost.
For a supersession type New Product Introduction event, the Automatically update upon new level values collection checkbox is used to automatically update the event with new or changed item relationships when level values are collected afresh in the subsequent planning cycles. Checking this box makes all the columns non-editable for the event. This means that item relationships then only be changed in the source applications only.
Details of base products
It is possible to use historical data of a base product for any region to model a new product that is being introduced only in a certain region.
Additional dimension information for any base product can be entered under the Base Product Details. For each base product, a different level can be selected for any of the six dimensions and two user-defined dimensions. If more than one base products are used, the relative weight, such as 30% of the forecast for base product A and 70% for B, for each base product can be specified. If no details are specified for the base products, all their available history/forecast for all dimensions is used as basis for the new product introduction.
Service part supersessions can be modeled using base products. Select Base Products button to open the Base Product window.
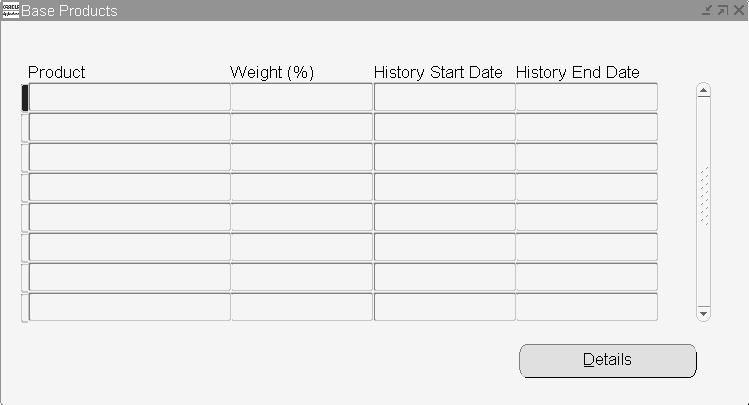
To complete the Base Products window, you can specify any percentage of Weights for base products.
If the History Start Date field is left blank, the history start date to of the forecast measure to which the event is associated is used. For supersession type New Product Introduction events, this means that the history of the base products from the History Start Date are used to create the forecast for the new product.
If the History End Date field is left blank, the history end date of the forecast measure to which the event is associated is used. The History End Date indicates that the history of the base products until the History End Date is used to create the forecast for the new product. Specifying the history end date allows you to use New Product Introduction event definition as the basis of history periods for the new product and ignore the forecast measure's history periods. This prevents reduction in the forecast of the new product when the base product is phased out or cannibalized.
The base product's forecast will not considered the History Start and End dates and is created based on the history periods of the forecast measure to which the event is associated.
Details of cannibalized products
Introduction of a new product may reduce sales cannibalization of some existing products (in steps 16 and 17). Any number of products for which the sales will be reduced due to the respective new product introduction can be selected under Cannibalized Products. Time period and quantity modification can be defined for each cannibalized product.
Select Cannibalized Products button to open the Cannibalized Products window.
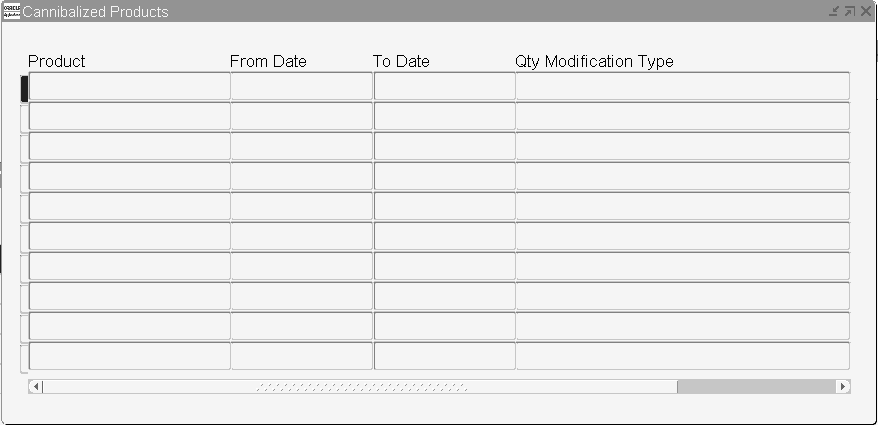
Complete the Cannibalized Products window. If the From Date column is not specified, cannibalization is applied from the horizon start date of the forecast measure to which the event is associated. The To Date column indicates the forecast end date and the cannibalization end date. Thus, the forecast for the cannibalized product is created only until this date and the forecast after this date will be zero. If To Date column is not specified, cannibalization is applied until the horizon end date of the forecast measure to which the event is associated.
The Qty Modification Type column has two possible values:
-
Decrease by Percentage: Creates the forecast based on product's own history and decreases the forecast by the percentage specified in Qty Modification Value field. Thus, the specified Qty Modification Value is applied as a percentage of the cannibalized product's forecast.
-
Decrease by Percentage of New Product: The specified Qty Modification Value is applied as a percentage of the new product's forecast.
For supersession type:
-
Based on combined histories of new and base products: New products's pre-lift forecast is used.
-
Based on individual histories of new and base products: New products's post-lift forecast is used.
Pre-lift and post-lift forecasts refer to a separate Qty Modification Value that might have been applied to the new product's forecast itself. Cannibalization before an uplift allows you to apportion a percentage of the combined forecast to a new product and the remaining to the base product.
-
To create base product's forecast based on event's history dates, cannibalization needs to be specified to drive the base product's demand by percentage of new product. To do this, complete the Cannibalized Products window.
Product Phase Outs
Linear and nonlinear phase outs
Sales promotion or a new product introduction may not only reduce the sale of another similar spatial product but may also lead to end-of-life phasing out of an existing product. Phasing out products is a conscious decision on the part of an organization. Product phase out can be linear or nonlinear. Nonlinear phase out essentially means phase out with multiple gradients and is achieved by defining multiple time periods with varying modification factors. This was shown in steps 3 and 4. If multiple time periods with varying modification factors are not defined, the forecast is linearly reduced to zero at the end of the specified phase out period.
Types of modification
Multiple time periods with varying modifications can be defined for any phase out (in steps 3 and 4). There is no price modification allowed for a new product introduction event. The quantity modification types are decrease by percentage and decrease by quantity.
Details of product phase outs
Defining product phase outs is similar to defining promotions and new product introductions and can be accomplished from Product Phase Out in the main navigator window. Additional information for the phase out is entered under Details as shown (in steps 3, 4, and 6). This includes the time period type of modifications for quantity only, and corresponding modification values. The values for the From Date and To Date (in steps 3 and 4) are defaulted from the Start Date and End Date on the main form (in steps 17 and 2). The user can modify these values. If no details are entered, the forecast for the product from the start date will be linearly reduced to zero at the end date. Various dimension levels and values can also be entered for each time period and modification detail. If no qualifications are specified, the event applies to all levels. If there is no entry to completely phase out the product, a warning is given to the user suggesting the necessity to enter detail whereby Modification Type is set to decrease by percentage and Modification Value is set to 100. For example, in the scenario described in the earlier section, if the following details are entered (in steps 3 and 5):
-
United State: 1 January 2002 to 31 March 2002 decrease by 25%
-
All geography: 31 March 2002 to 30 June 2002 decrease by 25%
Then, everything remains the same except that after 30 June 2002 the forecast flattens out; that is, its value remains unchanged until 31 December 2002.
No separate set up is required for events. However, some validations are performed by the system as under:
-
Date validation: the From Date and To Date values on the details form should be between the Start Date and End Date on the main form.
-
Increase by Percentage: if this has been selected as the modification type, the value should be zero or greater.
-
Decrease by Percentage: if this has been selected as the modification type, the value should be between zero and 100.
Events Calendar
Demand Planners and the Demand Plan Manager can view the details of the events impacting the forecast. For example, if three events affect the demand forecast of a product, the final forecast numbers show only the overall impact of the events. However, the demand planner needs to know the details of these three events that have changed the overall forecast numbers.
The Events Calendar addresses this need for better analysis of the forecast by presenting the events in the form of a simple calendar. For details about the events calendar, see: Using the Events Calendar.
Applying events at aggregate time levels
The events are specified at the day level. For example, a promotion with 10% volume lift is planned for Item-A during the period from 1-Jan-2002 to 17-Jan-2002. The results would be different when the same event is applied at the day level and at an aggregate level.
Applying events at aggregate time levels means applying events to the forecast or any other data stream for which the lowest time level is higher than a day and the data are not even allocated to the data level. For details on how to specify lowest time levels for a demand plan, see: Lowest Time Levels for the demand plan. Since the events are independent of the demand plan definition, the dates cannot be restricted during the event definition process. To apply events at aggregate time levels, weighted average lift factors are used. The weighted average would be by the days in the aggregate bucket.
Example
The following sales forecast at the all geography, all sales channels, and all organizations levels is used as the baseline forecast:
| 1/27/02 | 1/28/02 | 1/29/02 | 1/30/02 | 1/31/02 | 2/01/02 | 2/02/02 | |
|---|---|---|---|---|---|---|---|
| Item A | 100 | 200 | 100 | 200 | 300 | 100 | 100 |
The daily forecast numbers are aggregated to a weekly forecast of 1100, assuming an additive aggregation for Item A.
Assume that the Lowest Time Level as an aggregation bucket is selected as the Week for a manufacturing calendar and Month for the Gregorian calendar.
In this case, the seven days of the week will be truncated to two days, 31 Jan 02 and 2 Feb 02 so that the daily forecast numbers can be properly aggregated to the week of 1/27/02 as well as to the months of January and February 2002. For details, see: Lowest Time Levels for the demand plan.
Assume that following promotion at the all geography, all sales channels, and all organizations levels is applicable for Item A during this week. The following events are independently applied on this forecast:
| Start Date | End Date | Modification type | Modification factor |
|---|---|---|---|
| 1/27/02 | 1/28/02 | Increase by percent | 10 |
| 1/29/02 | 2/02/02 | Absolute | 50 |
The weighted average lift factors for the truncated day 31-Jan-02 are:
Percent lift = 2 * 10/5 = 4%
Absolute lift = 3 * 50 = 150
Forecast, 31 Jan 02= 900 * 0.04 + 150 +900 = 1086
The weighted average lift factors for the truncated day 02-Feb-02 are:
Percent lift = 0
Absolute lift = 2 * 50 = 100
Forecast, 02 Feb 02 = 200 + 100 = 300
The total weekly forecast will now become 1386. Had the promotion been applied to the daily forecast numbers, the weekly forecast would have been:
(100 * 0.10 + 200 * 0.10 + 250 + 1100) = 1380