Application Debugging Architecture
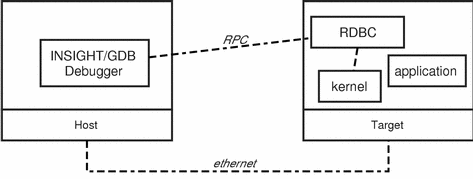
The ChorusOS application debugging architecture includes two components:
-
GDB debugging tool for ChorusOS with Insight graphical user interface (GUI)
-
Remote debugging daemon (RDBC)
The GDB debugging tool for ChorusOS systems and the Insight GUI run on the host. The remote debugging daemon runs on the target and communicates with GDB and Insight over a TCP/IP line (ethernet or PPP serial line). The application debugging architecture is illustrated in Figure 2-1.
Figure 2-1 Application Debugging Architecture

Application debugging is used to debug dynamically loaded applications, user applications, and certain supervisor applications. It is not possible to debug C_OS components, the microkernel, or the system drivers with application debugging.
Application debugging relies on the RDBC supervisor actor which uses the services of the C_OS, the microkernel, and system drivers such as the Ethernet driver. When an application is debugged, only that application is affected. Other applications in the operating system, as well as the operating system itself, continue running.
- © 2010, Oracle Corporation and/or its affiliates
