Chapter 2 Debugging ChorusOS Applications
This chapter describes how to debug applications developed for ChorusOS systems with the GDB and Insight debugging tools. The chapter includes the following:
Application Debugging Architecture
The ChorusOS application debugging architecture includes two components:
-
GDB debugging tool for ChorusOS with Insight graphical user interface (GUI)
-
Remote debugging daemon (RDBC)
The GDB debugging tool for ChorusOS systems and the Insight GUI run on the host. The remote debugging daemon runs on the target and communicates with GDB and Insight over a TCP/IP line (ethernet or PPP serial line). The application debugging architecture is illustrated in Figure 2-1.
Figure 2-1 Application Debugging Architecture
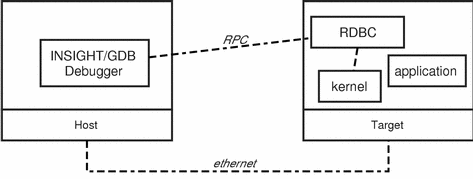
Application debugging is used to debug dynamically loaded applications, user applications, and certain supervisor applications. It is not possible to debug C_OS components, the microkernel, or the system drivers with application debugging.
Application debugging relies on the RDBC supervisor actor which uses the services of the C_OS, the microkernel, and system drivers such as the Ethernet driver. When an application is debugged, only that application is affected. Other applications in the operating system, as well as the operating system itself, continue running.
Setting up a Debugging Session
The way in which you set up your debugging session depends on whether you are doing an application debug or whether you are analyzing a process dump. For standard application debugging, you must configure the RDBC daemon. To analyze a process dump, the RDBD server is used.
Setting up an Application Debugging Session
Application debugging uses the RDBC daemon which processes remote debugging requests issued by the GDB debugging tool. It is accessed from a host using Sun RPC over UDP/IP. RDBC must run on a system which includes at least the POSIX_SOCKETS feature (minimal process and I/O managers).
Configuring and Using RDBC
The RDBC daemon can be started automatically or manually.
For RDBC to be started automatically, the conf/sysadm.ini file, read during system initialization by C_INIT, must contain a command which mounts the NFS root. If this mount command is present, edit
the conf/sysadm.ini file and add the following line just
after the mount command:
rdbc
Note -
You cannot use the & character with
this command.
RDBC will follow NFS root changes.
To start RDBC manually, as a normal application, type the following at the command line:
$ rsh target_name rdbc |
Running RDBC manually enables you to choose when you want to carry out application debugging, freeing up valuable resources.
To stop RDBC, use the akill command. First identify the process ID (pid):
$ rsh target_name aps |
Then kill the RDBC process:
$ rsh target_name akill pid |
Note -
Your application debug session terminates when you stop RDBC.
The input and output of debugged applications is displayed in the terminal in which you started RDBC. If you start RDBC with the -c option, the terminal connection is closed and RDBC runs in the background.
RDBC can be used to debug several applications at the same time from different GDB clients.
Two or more RDBC servers can be run on the same target to provide a separate console for each program being debugged.
See rdbc(1CC) for more information.
Note -
Customers who have the source delivery of ChorusOS 5.0 can find information on how to compile GDB for application debugging in the README.CHORUSOS file, located in install_dir/chorus-family/opt/gdb/doc/.
Analyzing a Process Dump
Process dumps enable you to examine processes post-mortem. A process dump is triggered when:
-
A process crashes and the CORE_DUMP feature has been set to TRUE.
-
The pdump command is issued on a process.
-
The pdump API primitive is called by an application.
A core file is generated in the root_dir/tmp directory, by default, and contains information about each of the process's threads and all memory regions associated with the process. Only regions attached to the actor are dumped. Supervisor regions not bound to the process are not dumped.
The iom.maxcoresize tunable specifies the maximum size of a core file. If iom.maxcoresize is set to 0, no core dump can be performed.
The RDBD daemon is used to debug application core dumps. rdbd(1CC) is similar to rdbc(1CC), the remote debugging daemon. However, RDBD runs on the host, whereas RDBC runs on a target. Execution commands (step, cont, next) are also not available in RDBD.
The debugging tool communicates with RDBD on the host. RDBD is responsible for reading the core file generated by the process dump.
Configuring and Using RDBD
The RDBD daemon enables the GDB debugging tool to debug core dumps. It is possible to run several RDBD servers on the same host, provided that each one uses a different communication slot number. The slot number must be used as a port number when configuring the debugging tool to use the debug server.
When you start RDBD, you must specify the exact path to the ChorusOS core dump directory manually, as follows:
$ rdbd [options] core_directory |
The following options are available:
- -fast-start
-
Do not check for another RDBD daemon already using the selected communication slot. This significantly accelerates startup.
- -force-slot
-
If another RDBD daemon is already using a given slot, force the new RDBD daemon to steal the slot.
- -slot number
-
Creates a communication slot number instead of using the default
0. - core_directory
-
Directory containing the core files generated by pdump or generated due to an exception.
RDBD can be run in the background because it does not require access to a terminal.
Using Insight for Application Debugging
This section describes how to use the Insight GUI in all application debugging scenarios, including the analysis of a process dump. The use of the GDB command line interface is described in the following sections.
Starting Insight for Application Debugging
Before starting Insight, make sure that:
-
RDBC is running on the target (for standard application debugging). If RDBC is not running, run it without any argument.
-
RDBD is running on the host (for process dump analysis).
The name of the Insight executable differs according to the target platform and takes the form target-type-chorusos-gdb. Thus, depending on the platform, type one of the following to start Insight:
-
$ sparc-chorusos-gdb
-
$ powerpc-chorusos-gdb
-
$ i386-chorusos-gdb
By default, the Insight GUI is started when you start GDB. The main window of the Insight GUI is shown in Figure 2-2.
Figure 2-2 Insight Source Window

Connecting to the Target and Loading the Application
The following procedures describe how to connect to the target using the Insight GUI and how to load the application to be debugged.
To Connect to the Target Using Insight
-
Open the Target Selection Window.
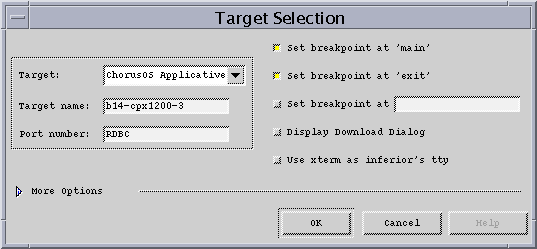
Select File -> Target Settings to display the Target Selection window:
Figure 2-3 Target Selection Window
-
Select ChorusOS Applicative Debug from the Target list.
-
Specify the target or host name.
In the Target name field, type the remote target name or IP address (to perform a standard application debug) or the host name or IP address of the machine on which RDBD is running (to analyze a process dump).
-
Specify the port.
In the Port number field, type RDBC (equivalent to 2072), RDBD (equivalent to 0) or a different port number to use for the connection.
-
Click OK to save the target settings.
-
Select Run -> Connect to target.
The connection has been completed successfully when the message
Successfully connectedis displayed.
Note -
If you select Run -> Connect to target before you have set your target or loaded an executable, the Target Selection window is displayed automatically.
All GDB commands are accessible from the Insight Console window. In addition, certain commands are accessible from the various ChorusOS windows.
To Load the Application Using Insight
-
Select File -> Open.
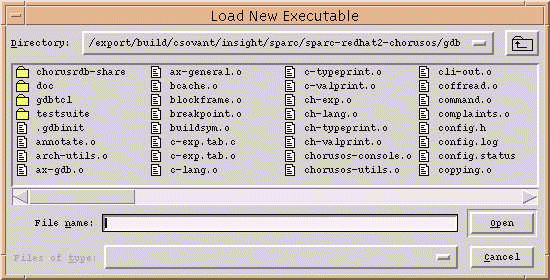
The Load New Executable window is displayed:
Figure 2-4 Load New Executable Window
-
Select the application to debug and click Open.
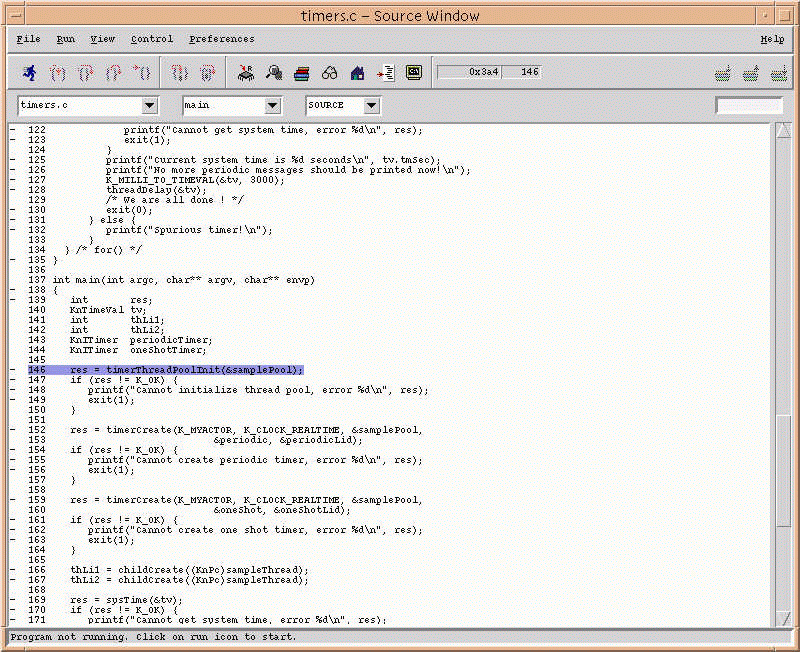
After you have selected the application, the source of the application is displayed in the Source window:
Figure 2-5 Application Source Window
Note -
All GDB commands have an equivalent in Insight. All the commands are accessible from the Insight Console. In addition, certain commands are accessible from the ChorusOS windows.
For additional information on using the Insight GUI, refer to the README.GDBTK file, located in install_dir/chorus-family/opt/gdb/doc/.
Executing an Application for Debugging
The way in which you execute an application depends on whether you are performing standard application debugging or analyzing a process dump.
Executing for Standard Application Debugging
If you are performing standard application debugging, the application can be executed in three ways:
-
Select Run from the Run menu.
-
Click the Run button on the toolbar.
Note -When GDB is busy (during the execution of a program, for example) the Run button is replaced by a Stop button. Use this button to stop the application.
-
Select View -> Console and use the run command in the View -> Console window.
Troubleshooting Application Execution
If nothing happens when you attempt to execute your application in Insight, perform the following checks:
-
Open the Console window and type run.
-
If the following message is displayed:
Warning: executable path does not match the path translation.
Unable to create remote process, File not found (maybe / has changed).
refer to "Loading and Executing the Application" for assistance in solving the problem.
-
If you consistently have the same problem, check whether your program links to one or more dynamic libraries. If your program does link to dyamic libraries, you must add the environment variable LD_LIBRARY_PATH, with a value set to the path where the libraries are located.
You can add the library path environment variable using the ChorusOS Environment Variables window (see "Displaying ChorusOS Environment Variables" for more information), or using the Console window. To add the variable using the Console window, type:
(chgdb) rdbsetenv LD_LIBRARY_PATH=/bin/examples:/bin/lib
PATH=/bin:/sbin
HOST=
TZ=GMT0
LD_LIBRARY_PATH=/bin/examples:/bin/lib
(chgdb)
where LD_LIBRARY_PATH is the path to the libraries.
Attaching to a Process Dump
Before performing a process dump analysis, select the process dump you want to analyze. Use the ChorusOS Processes window to attach to the process dump. See "Displaying ChorusOS Processes" for more information.
Alternatively, you can use the command-line interface in the Console window.
Insight GUI - ChorusOS Specifics
Most of the Insight windows used in ChorusOS debugging sessions are standard and information on their use is available in the standard Insight documentation. Some functionality has been added or customized for ChorusOS operating systems. These additions and customizations are described in the following sections.
Displaying ChorusOS Processes
The ChorusOS Processes window displays a list of the processes running on the target (if the server is RDBC) or of core dumps known to the debug daemon (if the server is RDBD). To display the ChorusOS Processes window, select ChorusOS -> Processes.
Figure 2-6 ChorusOS Processes Window
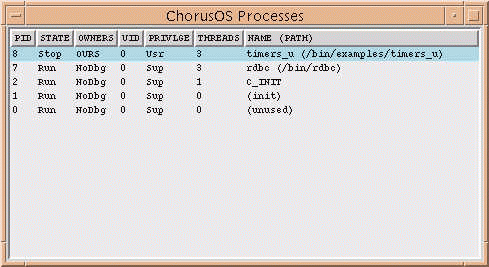
If a process or core dump is attached to the debug server, it is shown at the top of the list.
To investigate a process within the ChorusOS Processes window, select a line in the list and right-click to display a pop-up menu of options related to that process or core dump. The menu includes the following options:
- Information
-
Display information about the selected process (microkernel information or information maintained by the debug server).
- Attach
-
Attach the selected process to the debug server.
- Detach
-
Detach the selected process from the debug server.
- Kill
-
Kill the selected process (only if it is currently being debugged).
Displaying ChorusOS Threads
The ChorusOS Threads window displays a list of threads in the debugged process or core file. To display the ChorusOS Threads window, select ChorusOS -> Threads.
Figure 2-7 ChorusOS Threads Window
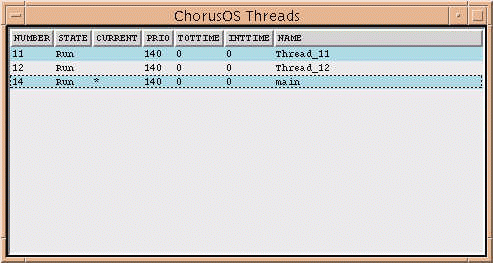
To navigate the ChorusOS Threads window, select a line in the list and right-click to display a pop-up menu of options related to that thread. Note that several threads can be selected at the same time.
If only one thread is selected, the pop-up menu includes the following options:
- Information
-
Displays information about the selected thread (microkernel information, per-thread-data, and all known registers for the thread).
- Suspend
-
Suspends the selected thread.
- Resume
-
Resumes the selected thread.
- Abort
-
Aborts the selected thread.
- Set as active thread
-
Sets the selected thread as the active thread (change the current context).
- Change name
-
Enables you to edit the name of the selected thread. Press Enter to validate the change. Pressing any other key will cancel the change.
If several threads are selected simultaneously, the pop-up menu includes the following options:
- Suspend
-
Suspends all selected threads.
- Resume
-
Resumes all selected threads.
Displaying ChorusOS Environment Variables
The ChorusOS Environment Variables window displays a list of the environment variables defined in the debug server and passed to newly created processes. To view the Environment Variables window, select ChorusOS -> Environment Variables.
Figure 2-8 ChorusOS Environment Variables Window
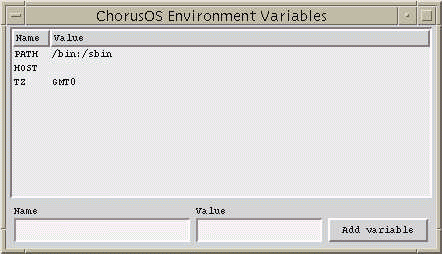
To investigate an environment variable with the ChorusOS Environment Variables window, select a line in the list and right-click to display a pop-up menu of options related to that environment variable. The menu includes the following option:
- Edit
-
Edit the value of the selected variable. The value change is validated by pressing the Return key. Pressing any other key will cancel the change.
To add a new environment variable:
-
Type the name of the variable in the Name field.
-
Type the value of the variable in the Value field. (It is not mandatory to add a value at this stage).
-
Click the Add variable button.
Displaying ChorusOS General Information
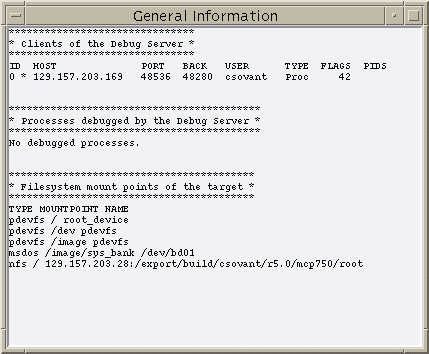
The ChorusOS General Information window displays the following information:
-
Clients of the debug server
-
Processes debugged by the remote debug server
-
Filesystem mount points of the target
Figure 2-9 General Information Window
Displaying the ChorusOS System Log
The ChorusOS System Log window displays the last N messages of the system log, where N is specified in the Count field. To view the System Log window, select ChorusOS -> System Log.
Figure 2-10 ChorusOS System Log Window
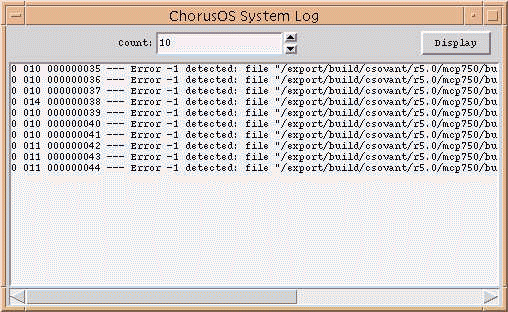
To change the number of messages displayed enter a value in the Count field (or use the up and down arrows) and click the Display button.
Using GDB for Application Debugging
This section provides examples on the use of GDB in all application debugging scenarios, including the analysis of a process dump.
Starting GDB for Application Debugging
Before starting GDB, ensure that:
-
RDBC is running on the target (for standard application debugging). If RDBC is not running, run it without any argument.
-
RDBD is running on the host (for process dump analysis).
The name of the GDB executable differs according to the target platform and takes the form target-type-chorusos-gdb. Thus, depending on the platform, type one of the following to start GDB:
-
$ sparc-chorusos-gdb --nw
-
$ powerpc-chorusos-gdb --nw
-
$ i386-chorusos-gdb --nw
Note -
By default, the Insight GUI is started when you start GDB. To start GDB without the Insight GUI, you must include the --nw option.
Connecting to the Target With GDB
The following procedures describe how to connect to the target for a standard application debug and for a process dump.
To Connect for a Standard Application Debug
-
Specify the communication port.
If RDBC has been started on a default port:
(chgdb) rdbport RDBC
RDB port is now 2072
(chgdb)
If RDBC has been started on a non-default port, specify the communication port as follows:
(chgdb) rdbport port_number
RDB port is now port_number
(chgdb)
-
Connect to the target.
(chgdb) target chorusrdb remote_host
Attaching remote machine across net...
Setting path translation 'root_dir' '/'
Connected to remote_host.
Now the "run" command will start a remote process.
(chgdb)
You can also pass the port number directly in the target command:
(chgdb) target chorusrdb remote_host:RDBC Attaching remote machine across net... Setting path translation 'root_dir' '/' Connected to remote_host:RDBC. Now the "run" command will start a remote process. (chgdb) |
To Connect for a Process Dump Analysis
-
Specify the communication port.
If RDBD has been started on a default port:
(chgdb) rdbport RDBD
RDB port is now 0
(chgdb)
If RDBD has been started on a non-default port, specify the communication port as follows:
(chgdb) rdbport port_number
RDB port is now port_number
(chgdb)
-
Connect to the target.
(chgdb) target chorusrdb remote_host
Attaching remote machine across net...
Connected to remote_host.
Now the "run" command will start a remote process.
(chgdb)
You can also pass the port number directly in the target command:
(chgdb) target chorusrdb remote_host:RDBD Attaching remote machine across net... Setting path translation 'root_dir' '/' Connected to remote_host:RDBD. Now the "run" command will start a remote process. (chgdb) |
Loading and Executing the Application
To debug an application with GDB, use the file command to specify its executable pathname on the host. Because GDB for ChorusOS systems is a cross-debugging tool, the debugged process is created remotely on the target by the target itself. The target view of files is different from the host view (the target root directory is usually a subdirectory on the host filesystem). It is therefore necessary to translate the host pathname of the executable file into its corresponding target form. GDB for ChorusOS includes a path translation mechanism for this purpose.
A default path translation (provided by RDBC) is established when you connect to a target using the NFS mount point information. It is possible to change this default translation, if necessary, using the rdbpathtranslate hostpath targetpath command. If a host pathname starts with hostpath, this portion of the pathname is replaced with targetpath. The default target path is /.
The following examples show how an application is executed for a debugging session with and without the use of rdbpathtranslate.
Example 2-1 Loading and Executing Normally
In the following example, the pathname of the executable matches the default path translation, so there is no need to change the path.
(chgdb) file root_dir/bin/examples/timers_u Reading symbols from root_dir/bin/examples/timers_u...done. (chgdb) run Starting program: root_dir/bin/examples/timers_u Program exited normally. (chgdb) |
Example 2-2 Loading and Executing With rdbpathtranslate
In the following example, the default path translation does not match the pathname of the executable.
(chgdb) file build_dir/build-EXAMPLES/progov/timers_u Reading symbols from build_dir/build-EXAMPLES/progov/timers_u...done. (chgdb) rdbpathtranslate Syntax is: rdbpathtranslate <host-path> [target-path] Currently 'build_dir/root' '/' (chgdb) run Starting program: build_dir/build-EXAMPLES/progov/timers_u Warning: executable path 'build_dir/build-EXAMPLES/progov/timers_u' does not match the path translation set with 'rdbpathtranslate' (from 'build_dir/root' to '/'). It will be used without translation. Unable to create remote process (remote problem): File not found (maybe / has changed). (chgdb) |
In the preceding example, the pathname of the executable is build_dir/build-EXAMPLES/progov/timers_u. It does not start with hostpath, which is build_dir/root. However, the build_dir directory has been mounted as /tests on the target:
(chgdb) i rdbmounted TYPE MOUNTPOINT NAME pdevfs / root_device pdevfs /dev pdevfs pdevfs /image pdevfs msdos /image/sys_bank /dev/bd01 nfs / local_host_ip:/build_dir/root nfs /tests local_host_ip:build_dir (chgdb) |
You can execute the program successfully by redefining the path translation as follows:
(chgdb) rdbpathtranslate build_dir /tests (chgdb) run Starting program: build_dir/build-EXAMPLES/progov/timers_u Program exited normally. (chgdb) |
To Analyze a Process Dump
This procedure shows how a process is executed for a process dump rather than a standard debugging session.
-
Load the executable.
(chgdb) file root_dir/bin/examples/timers_u
Reading symbols from root_dir/bin/examples/timers_u...done.
-
Examine the available process dumps.
The available process dumps appear as stopped processes in the process list. Use the info command to display the process list.
(chgdb) info rdbprocesses
PID  STATE  OWNERS  UID  PRIVLGE  THREADS  NAME (PATH)
1    Stop   0       0    Usr      2        core_timers_u
-
Attach to the selected process.
Use the attach command to attach to the selected process id:
(chgdb) attach 1
Attaching program: root_dir/bin/examples/timers_u pid 1.
[Switching to Thread 6 ()]
0xeffe41b8 in sampleThread () at root_dir/opt/examples/progov/timers.c:93

93 res = timerThreadPoolWait(&samplePool, &cookie, &overrun, K_NOTIMEOUT);
(chgdb)
Note -
When analyzing process dumps, certain standard commands (cont, next, step, run), and certain ChorusOS commands do not work.
Working With Threads
In a GDB debugging session, threads have two numbers: a ChorusOS thread number and a GDB number. Both numbers are unique. The GDB thread number is never reused, unlike the ChorusOS thread number.
The standard command to list threads is info threads:
(chgdb) info threads 3 Thread 13 (Thread_13) sampleThread () at root_dir/system-int/opt/examples/progov/timers.c:81 2 Thread 14 (Thread_14) sampleThread () at root_dir/system-int/opt/examples/progov/timers.c:81 * 1 Thread 11 (main) main (argc=1, argv=0xeffd2008, envp=0xeffd2010) at root_dir/system-int/opt/examples/progov/timers.c:169 (chgdb) |
In the preceding example, the numbers in the first column (3, 2 and 1) are the GDB thread numbers. The numbers in the second column (13, 14 and 11) are the ChorusOS thread numbers.
To change the current thread, use the thread gdb_thread_number command.
In an application debugging session, you can use the info rdbthreads command to obtain additional information about threads:
(chgdb) info rdbthreads NUMBER STATE CURRENT PRIO TOTTIME INTTIME NAME 14 Run 140 0 0 Thread_14 13 Run 140 0 0 Thread_13 11 Run * 140 0 0 main |
Because this command is provided by the debug server, it displays ChorusOS thread numbers only. In the preceding example, the number under the NUMBER column is the ChorusOS thread number and the name in the NAME column (Thread_x) is the ChorusOS thread name.
Use the rdbthread chorusos_thread_number command to change the current thread.
Application Debugging Commands
The following application debugging commands are available. Unless otherwise stated, the commands can be used for the standard application debug or for analyzing a process dump. In most cases the arguments are optional and default to the current process number or to the current thread number, depending on the command. For some commands, if you do not pass an argument, the current state is displayed.
- target chorusrdb remote_host
-
Connects to the ChorusOS target for application debug. The compulsory remote_host argument is the name of the target, as visible on the TCP/IP network. GDB registers itself with the debug server and establishes a default pathname translation from host to target, using the NFS mount point information from the target.
- rdbloadmode string
-
Defines the process loading mode. The default mode is synchronous (sync) and potentially causes RPC timeouts if the binary file is very large or if the communication medium between the target and the filesystem is slow (for example, PPP/SLIP over a serial line). This problem does not occur in asynchronous mode (async) . In asynchronous mode it might, however, be necessary to provide the privilege of the process when the debugging tool is running on ChorusOS versions prior to 5.0. By default, the determination is automatic (auto), but the loading can be forced to user mode (user) or to supervisor mode (sup).
- rdbpathtranslate hostpath targetpath
-
Sets the translation scheme of host pathnames into target pathnames for starting applications on the target. If the host pathname begins with hostpath, this portion of the pathname is replaced with targetpath. The default target path is /. rdbpathtranslate and is implicitly set when connecting to a target using target chorusrdb.
- rdbport portnumber
-
Defines the port of the ChorusOS RDB server before performing the target chorusrdb command. The port number can be either a predefined string or a numerical value. Predefined strings may be rdbc, indicating the process default debug port (value is 2072), or rdbd, indicating the process core dump default debug port (value is 0). If you run the debug servers on non-default ports, values above 25 indicate a UDP port and should be used with RDBC, while values from 0 to 25 are slot numbers, or offsets from a certain predefined RPC program number, and should be used with RDBD.
- rdbsetenv NAME=value
-
Defines an environment variable to be passed to the application when it is run. This command is especially useful for setting the value of the LD_LIBRARY_ PATH variable.
- rdbtabort thread-id
-
Performs the threadAbort(2K) system call over the specified thread in the current process. This enables the thread to be unblocked from most blocking system calls.
Use the following control commands to maintain the target and the debug server.
- rdbdebug 0|1
-
Remotely enables or disables the debug traces on the RDB debug server. The server must have been compiled in debug mode.
- rdbdetach pid
-
Detach and free an arbitrary process from the control of the debug server. By default, the process currently being debugged is detached. You should, however, use the standard GDB detach command for this purpose.
- rdbkill pid
-
Kill an arbitrary process on the target. By default, the process currently being debugged is killed. You should, however, use the standard GDB kill command for this purpose.
- rdbselftest
-
Run a self-test of the RDB server. This involves starting ls(1CC) in debug mode and single-stepping it until the end. Traces are issued at every function call and return. The results are displayed on RDB server's standard output.
- rdbtraceoptions
-
Set the tracing options for the RDB client code in GDB.
The following commands show resource lists defined by the RDB server. All threads are identified using ChorusOS thread IDs rather than GDB thread numbers.
- info rdbdebugged
-
Shows the list of processes or core dumps being debugged by the debug server.
- info rdbmounted
-
Lists the filesystems mounted on the target.
- info rdbprocesses
-
Lists the processes running on the target or core dumps known to the debug server. If a process or core dump is attached to the debug server, it is shown at the top of the list.
- info rdbthreads pid
-
Shows the list of threads in a process or core file debugged by the debug server.
The following commands provide various system resources. All threads are identified using ChorusOS thread IDs rather than GDB thread numbers.
- info dactor pid
-
Provides microkernel information about the process identified by pid. This command cannot be used in process dump analysis.
- info dactors
-
Lists all the actors running on the target. This command cannot be used in process dump analysis.
- info dallports
-
Lists all the ChorusOS IPC ports defined on the target. This command cannot be used in process dump analysis.
- info dallregs thread-id
-
Displays all known thread registers inside the current process, by default the current thread. This command is only useful on platforms like the i386, where GDB does not handle all thread registers.
- info dallthreads
-
Displays all threads running on the system. This command cannot be used in process dump analysis.
- info dclients
-
Displays all the clients of the RDB debug server.
- info denv
-
Displays the environment variables of the RDB server, which are passed to newly created processes.
- info dlog count
-
Shows the last count entries of the system log. This command cannot be used in process dump analysis.
- info dport port-li
-
Provides information about the ChorusOS IPC port identified by the local identifier port-li. If port-li is negative, information about the default port of the actor identified by port-li is displayed. This command cannot be used in process dump analysis.
- info dports pid
-
Displays information about the ChorusOS IPC ports in the process pid. This command cannot be used in process dump analysis.
- info dprocess pid
-
Displays information about the process pid. This command cannot be used in process dump analysis.
- info dpstat pid
-
Displays all information maintained for the process pid by the debug server. This is an RDB server debugging command.
- info dptd thread-id
-
Provides per-thread-data (private data) information for a thread. This information notably includes the current error number value. This command cannot be used in process dump analysis.
- info dregions pid
-
Displays information about memory regions in the process pid. This command cannot be used in process dump analysis.
- info dsched
-
Displays scheduler information for the system. This information includes the currently running thread and all other threads in the run queue. This command cannot be used in process dump analysis.
- info dthread thread-id
-
Displays microkernel information about any thread in the system. This command cannot be used in process dump analysis.
- info dthreads pid
-
Displays thread information for the process pid. This command cannot be used in process dump analysis.
- set rdbasync
-
Sets async as the operation mode for the chorusrdb target. This command should be issued only when the chorusrdb target is not active. The command should not be used until the core GDB code actually supports async operations.
The following commands extend the thread management facilities of GDB. All threads are identified using ChorusOS thread IDs rather than GDB thread numbers. It is also possible to pass the thread name.
- rdbthread thread-id
-
Changes the current thread. This command is similar to thread thread-id but uses ChorusOS thread numbers. It does not accept the apply keyword.
- thread name thread-id name
-
Set a name for thread thread-id. This changes the thread name in the system itself, as if threadName(2K) was called. This command cannot be used in process dump analysis.
- thread resume [all|allbut] thread-ids
-
Resumes one or more threads in the process. This command cannot be used in process dump analysis.
- thread suspend [all|allbut] thread-ids
-
Suspends one or more threads in the process. This command cannot be used in process dump analysis.
- © 2010, Oracle Corporation and/or its affiliates
