Insight GUI - ChorusOS Specifics
Most of the Insight windows used in ChorusOS debugging sessions are standard and information on their use is available in the standard Insight documentation. Some functionality has been added or customized for ChorusOS operating systems. These additions and customizations are described in the following sections.
Displaying ChorusOS Processes
The ChorusOS Processes window displays a list of the processes running on the target (if the server is RDBC) or of core dumps known to the debug daemon (if the server is RDBD). To display the ChorusOS Processes window, select ChorusOS -> Processes.
Figure 2-6 ChorusOS Processes Window
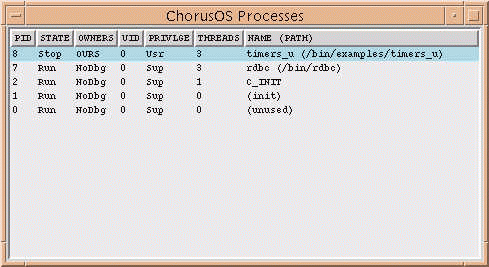
If a process or core dump is attached to the debug server, it is shown at the top of the list.
To investigate a process within the ChorusOS Processes window, select a line in the list and right-click to display a pop-up menu of options related to that process or core dump. The menu includes the following options:
- Information
-
Display information about the selected process (microkernel information or information maintained by the debug server).
- Attach
-
Attach the selected process to the debug server.
- Detach
-
Detach the selected process from the debug server.
- Kill
-
Kill the selected process (only if it is currently being debugged).
Displaying ChorusOS Threads
The ChorusOS Threads window displays a list of threads in the debugged process or core file. To display the ChorusOS Threads window, select ChorusOS -> Threads.
Figure 2-7 ChorusOS Threads Window
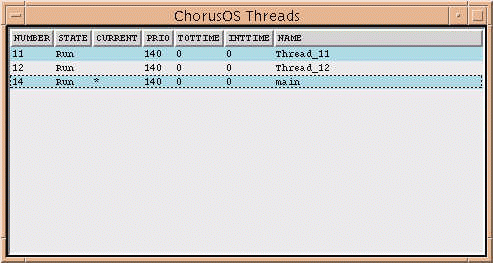
To navigate the ChorusOS Threads window, select a line in the list and right-click to display a pop-up menu of options related to that thread. Note that several threads can be selected at the same time.
If only one thread is selected, the pop-up menu includes the following options:
- Information
-
Displays information about the selected thread (microkernel information, per-thread-data, and all known registers for the thread).
- Suspend
-
Suspends the selected thread.
- Resume
-
Resumes the selected thread.
- Abort
-
Aborts the selected thread.
- Set as active thread
-
Sets the selected thread as the active thread (change the current context).
- Change name
-
Enables you to edit the name of the selected thread. Press Enter to validate the change. Pressing any other key will cancel the change.
If several threads are selected simultaneously, the pop-up menu includes the following options:
- Suspend
-
Suspends all selected threads.
- Resume
-
Resumes all selected threads.
Displaying ChorusOS Environment Variables
The ChorusOS Environment Variables window displays a list of the environment variables defined in the debug server and passed to newly created processes. To view the Environment Variables window, select ChorusOS -> Environment Variables.
Figure 2-8 ChorusOS Environment Variables Window
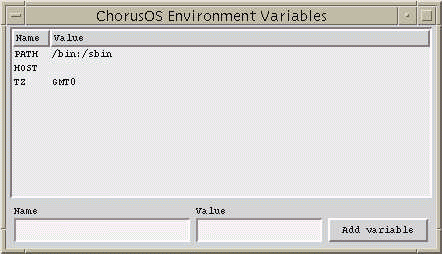
To investigate an environment variable with the ChorusOS Environment Variables window, select a line in the list and right-click to display a pop-up menu of options related to that environment variable. The menu includes the following option:
- Edit
-
Edit the value of the selected variable. The value change is validated by pressing the Return key. Pressing any other key will cancel the change.
To add a new environment variable:
-
Type the name of the variable in the Name field.
-
Type the value of the variable in the Value field. (It is not mandatory to add a value at this stage).
-
Click the Add variable button.
Displaying ChorusOS General Information
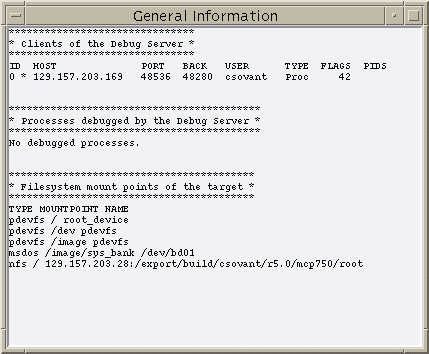
The ChorusOS General Information window displays the following information:
-
Clients of the debug server
-
Processes debugged by the remote debug server
-
Filesystem mount points of the target
Figure 2-9 General Information Window
Displaying the ChorusOS System Log
The ChorusOS System Log window displays the last N messages of the system log, where N is specified in the Count field. To view the System Log window, select ChorusOS -> System Log.
Figure 2-10 ChorusOS System Log Window
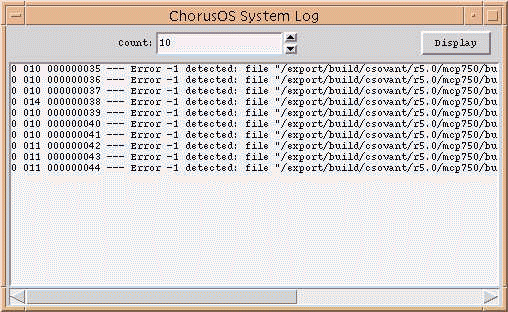
To change the number of messages displayed enter a value in the Count field (or use the up and down arrows) and click the Display button.
- © 2010, Oracle Corporation and/or its affiliates
