Debugging Window
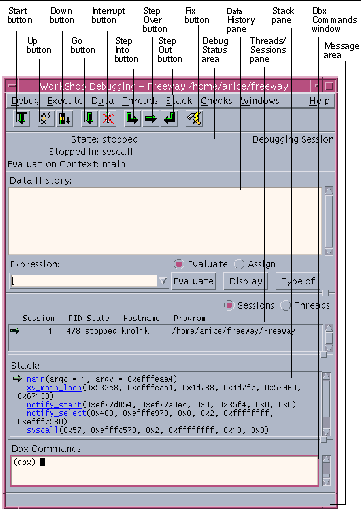
You perform most debugging operations from the Debugging window, shown in Figure 5-1, and the windows you can access from it.
Figure 5-1 Sun WorkShop Debugging Window

|
Debug menu |
Provides commands to debug a program, process, or core file; customize options; and manage sessions. |
|
Execute menu |
Provides commands to run or single-step through lines of code. |
|
Data menu |
Provides commands to evaluate the selection in the Debugging window. |
|
Threads menu |
Provides commands to hide and expose threads in the Threads/Sessions pane. |
|
Stack menu |
Provides commands to move up, down, and pop the stack. |
|
Checks menu |
Provides commands to enable and use runtime checking. |
|
Windows menu |
Provides commands to open the Breakpoints, Data Display, and other debugging windows. |
|
Help menu |
Provides commands to display online help. |
|
Start button |
Runs the program from the beginning. |
|
Up button |
Moves up the call stack one function. |
|
Down button |
Moves down the call stack one function. |
|
Go button |
Runs the program from the current location. |
|
Interrupt button |
Interrupts the program; equivalent to the dbx command Ctrl+C. |
|
Step Into button |
Single-steps into a function. |
|
Step Over button |
Single-steps over the current function. |
|
Step Out button |
Steps past the end of the current function. |
|
Fix button |
Recompiles all changed files and continue debugging. |
|
Debug Status area |
Displays information about the state of your program. |
|
Data History pane |
Displays history when evaluating expressions, querying for type, and modifying values. |
|
Threads/Sessions pane |
If the Threads radio button is selected, lists information about the threads in a multithreaded program. If the Sessions radio button is selected, lists current debugging sessions. |
|
Stack pane |
Shows you the current state of the call stack and lets you move to different stack frames. |
|
Dbx Commands window |
Lets you enter and view the output of dbx commands (displayed only if Show Dbx Commands Window in a separate window is set to No in the Window Layout Category in the Debugging Options dialog box). |
|
Message area |
Displays messages about operations in the window. |
- © 2010, Oracle Corporation and/or its affiliates
