The Overview Display
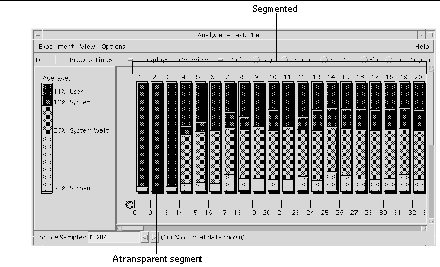
For each sample, the Overview display (see Figure 2-4) shows the amount of time the application spends in different process states. The Sampling Collector always gathers this data during the data collection process, so the Overview display appears by default whenever an experiment is loaded into the Sampling Analyzer.
The Overview display option:
-
Provides a high-level overview of the performance behavior of an application
-
Provides data about how your application's execution time breaks down into different performance areas, helping you identify CPU bottlenecks, I/O bottlenecks, and paging bottlenecks
-
Shows how application performance changes during execution (for example, early parts of the execution might be I/O-bound, while later parts might be CPU-bound)
Figure 2-4 Overview Display

The Overview display contains numbered sample columns made up of segmented bars. Each column represents individual samples collected during an experiment.
The segments inside each column represent different performance areas. The height of each segment is proportional to the time spent in each performance area.
The shade that represents a specific performance area is consistent across all the sample columns in the experiment and across other experiments as well.
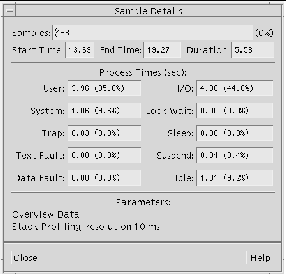
A transparent segment is a segment the same color as the foreground of the display pane. It represents performance areas too small to display individually. To see exactly which performance areas are contained in a transparent segment, click the segment's column and choose View Show Details to open the Sample Details dialog box (see Figure 2-5).
Figure 2-5 Sample Details Dialog Box

The fields in the dialog box contain the following information about the selected samples.
| Samples | Samples currently selected and the percentage of the experiment they represent |
| Start Time | Start time of the sample |
| End Time | End time of the sample |
| Duration | Duration of the sample |
| User | Time spent executing application instructions |
| System | Time the operating system spent executing system calls |
| Trap | Time spent executing traps (automatic exceptions or memory faults) |
| Text Fault | The time spent faulting in text pages |
| Data Fault | The time spent faulting in data pages |
| I/O | Time spent in program I/0 |
| Lock Wait | Time spent waiting for lightweight process locks to be released |
| Sleep | Time the program spent sleeping (due to any cause other than Text Fault, Data Fault, System Wait, or Lock Wait) |
| Suspend | Time spent suspended (including time spent in the debugger when it encounters breakpoints) |
| Idle | Time spent idle |
| Parameters | List of the data parameters collected for each sample (set in the Sampling Collector before beginning the experiment) |
- © 2010, Oracle Corporation and/or its affiliates
