The Histogram Display
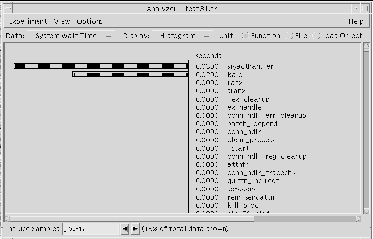
The Histogram display (see Figure 2-6) shows how much time an application spends executing functions, files, or load objects.
The Histogram display option is available for the following data types:
-
User Time
-
System Wait Time
-
System Time
-
Text Page Fault Time
-
Data Page Fault Time
Figure 2-6 Histogram Display Showing Time Spent Executing Functions

To view your application's performance data at various levels of compilation granularity, choose one of the following unit types:
| Function | Time your application spent executing functions |
| File |
Time spent executing file-level units. This view is useful if your application has a large number of functions. All data for a single source file is displayed together. Note: If any part of the executable (including shared libraries) is not compiled with the -g option, the Sampling Collector may not have enough information to associate functions with their containing files. |
| Load Object |
Time spent executing text segments |
You can select which samples to include in the Histogram display in three ways:
-
Type sample numbers directly into the Includes Samples text field: separate numbers with commas (1,3,6), and define ranges using a hyphen (1-6).
-
Select the columns containing those samples while still in the Overview display.
-
Choose either View > Select or View > Select None while still in the Overview display to include or exclude all samples in the experiment.
To select which segments to include in the Histogram display, choose View Segments Included from Files to open the Segments Included from Files dialog. Click any segments and click Apply, or click the Select All button to select all segments.
To sort the Histogram display, choose View > Sort by and select either Values (descending by time value) or Names(alphabetically).
To search for specific names, choose View > Find to open the Find dialog box. Enter the search string in the text field and click Apply.
- © 2010, Oracle Corporation and/or its affiliates
