Chapter 10 Data Visualization
If you need a way to display your data graphically as you debug your program from Sun WorkShop, you can use Data Visualization.
Data visualization can be used during debugging to help you explore and comprehend large and complex datasets, simulate results, or interactively steer computations. The Data Graph window gives you the ability to "see" program data and analyze that data graphically. The graphs can be printed out or printed to a file.
This chapter contains the following sections:
Specifying Proper Array Expressions
To display your data you must specify the array, and how it should be displayed. You can invoke the Data Graph window from the Sun WorkShop Debugging window by typing an array name in the Expression text box. All scalar array types are supported except for complex (Fortran) array types.
Single-dimensional arrays are graphed (a vector graph) with the x-axis indicating the index and the y-axis indicating the array values. In the default graphic representation of a two-dimensional array (an area graph), the x-axis indicates the index of the first dimension, the y-axis indicates the index of the second dimension, while the z-axis represents the array values. You can visualize arrays of n dimensions, but at most, only two of those dimensions can vary.
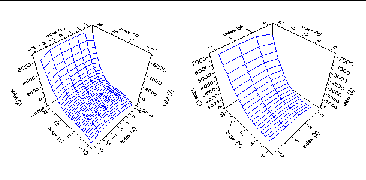
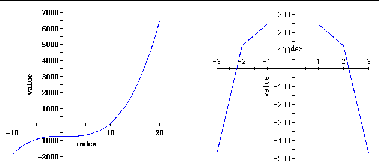
You do not have to examine an entire dataset. You can specify slices of an array, as shown in the following examples. Figure 10-1and Figure 10-2 show the bf array from the sample Fortran program given at the end of this chapter.
Figure 10-1 Graph of (left) bf array name only, (right) bf(0:3,1:20)
The next two figures show the array with a range of values:
Figure 10-2 Graph of array bf: (left) bf(-3:3,:), (right) bf(:,-7:7)
Graphing an Array
Before you can graph an array, you need to follow these preliminary steps:
-
Load a program into the Debugging window.
Choose Debug New Program to load your program. If the program was previously loaded in the current Sun WorkShop session, choose the program from the program list in the Debug menu.
-
Set at least one breakpoint in the program.
You can set a single breakpoint at the end of the program or you can set one or more at points of interest in your program.
-
Run your program.
When the program stops at the breakpoint, decide which array you want to examine.
Now you can graph the array. Sun WorkShop provides multiple ways to graph an array through Sun WorkShop:
From the Debugging window. You can enter an array in the Expression text field and choose Data Graph Expression or you can select an array in a text editor and choose Data Graph Selected in the Debugging window.
From the Data Display window. You can choose the Graph command from the Data menu or from the identical pop-up menu (right-click to open the pop-up). If the array in the Data Display window can be graphed, the Graph command is active.
From the Data Graph window. You can choose Graph New, enter an array name in the Expression text field in the Data Graph: New window and click Graph.
If you click the Replace current graph button, the new graph replaces the current one. Otherwise, a new Data Graph window is opened.
From the dbx Commands window. You can display a Data Graph directly from the dbx command line with the vitem command (you must have opened the Dbx Commands window from Sun WorkShop):
(dbx) vitem -new array-expr
array-expr specifies the array expression to be displayed.
Automatic Updating of Array Displays
The value of an array expression can change as the program runs. You can choose whether to show the array expression's new values at specific points within the program or at fixed time intervals with the Update at field in the graph options.
If you want the values of an array updated each time the program stops at a breakpoint, you must turn on the Update at: Program stops option. As you step through the program, you can observe the change in array value at each stop. Use this option when you want to view the data change at each breakpoint. The default setting for this feature is off.
If you have a long-running program, choose the Update at: Fixed time interval option to observe changes in the array value over time. With a fixed time update, a timer is automatically set for every nth period. The default time is set for one second intervals. To change the default setting, choose Graph Default Options and change the time interval in the Debugging Options dialog box (make sure you are in the Data Grapher category).
Note -
Every time the timer reaches the nth period, WorkShop tries to update the graph display; however, the array could be out of scope at that particular time and no update can be made.
Since the timer is also used in collecting data and when checking for memory leaks and access checking, you cannot use the Update at Fixed time interval setting when you are running the Sampling Collector or the run-time checking feature.
Changing Your Display
Once your data is graphically displayed, you can adjust and customize the display using the controls in the Data Graph window. This section presents examples of some of graph displays that you can examine.
The Data Graph window opens with the Magnify and Shrink options present. when graphing any type of array. With an area graph, the window includes the Axis Rotation and Perspective Depth fields. These options enable you to change your view of the graph by rotating its axis or increasing or decreasing the depth perspective. To quickly rotate the graph, hold the right mouse button down with the cursor on the graph and drag to turn the graph. You can also enter the degree of rotation for each axis in the Axis Rotation field.
Click Show Options for more options. If the options are already shown, click Hide to hide the additional options.
Figure 10-3 shows two displays of the same array. The figure on the left shows the array with a Surface graph type with the Wire Mesh texture. The figure on the right shows the array with a Contour graph type delineated by range lines.
Figure 10-3 Two Displays of the Same Array
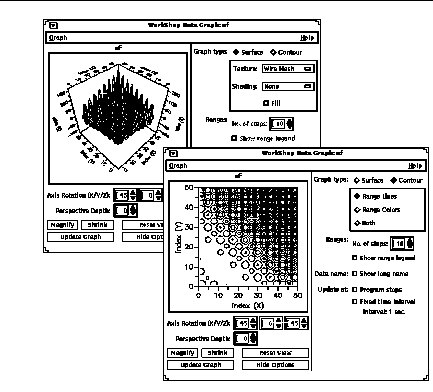
When you choose a Contour graph type, the range options enable you to see areas of change in the data values.
The display options for the Surface graph type are texture, shading, and fill. Texture choices include Wire Mesh or Range Lines as shown in Figure 10-4.
Figure 10-4 Surface graph with (left to right) Wire Mesh, Range Lines

Shading choices for the Surface graph type include Light Source or Range Colors:

Turn on Fill to shade in areas of a graph or to create a solid surface graph.

Choose Contour as the graph type to display an area graph using data range lines. With the Contour graph type, you have the additional options of displaying the graph in lines, in color, or both.
Figure 10-5 Contour graph with (left to right) Range Lines, Range Colors, Both
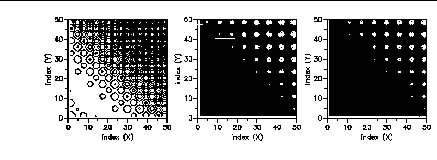
You can change the number of data value ranges being shown by changing the value in the Ranges: No. of steps.field.
Figure 10-6 Number of steps (left to right): 5, 10, 15
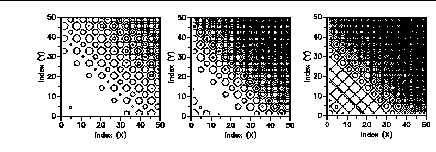
Be aware that if you choose a large number of steps, you can adversely affect the color map.
Click on the Show range legend button if you want a legend to display your range intervals.
Analyzing Visualized Data
There are different ways to update the data being visualized, depending on what you are trying to accomplish. For example, you can update upon demand, at breakpoints, or at specified time intervals. You can observe changes or analyze final results. This section provides several scenarios illustrating different situations.
Two sample programs, dg_fexamp (Fortran) and dg_cexamp (C), are included with WorkShop. These sample programs are used in the following scenarios to illustrate data visualization.
You can also use these programs for practice. They are located in install-dir/SUNWspro/WS5.0/examples/datagrapher, where the default install-dir is /opt. To use the programs, change to this directory and type make, the executable programs are created for you.
Scenario 1: Comparing Different Views of the Same Data
The same data can be graphed multiple times which allows different graph types and different segments of data to be compared.
-
Load the C or Fortran sample program.
-
Set a breakpoint at the end of the program.
-
Start the program, running the program to that breakpoint.
-
Type bf into the Expressions text field in the Debugging window.
-
Choose Data Graph Expression, which brings up a Surface graph of both dimensions of the bf array.
-
Choose Data Graph Expressions again to bring up a duplicate graph.
-
Click Show Options and select Contour for the graph type. Now you can compare different views of the same data (Surface vs. Contour).
-
Type bf(1,:) for the Fortran or bf[1][..] for the C example program into the Expression text field.
-
Now Choose Data Graph Expression to bring up a graph of a section of the data contained in the bf array.
All these different views of the data can now be compared.
Scenario 2: Updating Graphs of Data Automatically.
The updating of a graph can be controlled automatically by turning on the Update at: Program stops option. This feature enables you to make comparisons of data as it changes during the execution of the program.
-
Load the C or Fortran sample program.
-
Set a breakpoint at the end of the outer loop of the bf function.
-
Start the program, running the program to that breakpoint.
-
Type bf into the Expressions text field.
-
Choose Data Graph Expression. A graph of the values in the bf array after the first loop iteration appear.
-
Click Show Options and select Update At: Program stops.
-
Choose the Go command to cause the execution of several other loop iterations of the program. Each time the program stops at the breakpoint, the graph is updated with the values set in the previous loop iteration.
-
Utilizing the automatic update feature can save time when an up to date view of the data is desired at each breakpoint.
Scenario 3: Comparing Data Graphs at Different Points in Program
The updating of a graph can also be controlled manually.
-
Load the C or Fortran example program.
-
Set a breakpoint at the end of the outer loop of the af function.
-
Start the program, running the program to that breakpoint.
-
Type af into the Expression: text field.
-
Choose Data Graph Expression. A graph of the values in the af array after the first loop iteration appears. Make sure automatic updating is turned off on this graph (the default setting).
-
Execute another loop iteration of the program using the Go command.
-
Bring up another graph of the af array choosing Data Graph Expression. This graph contains the data values set in the second iteration of the outer loop.
-
The data contained in the two loop iterations of the af array can now be compared. Any graph with automatic updating turned off can be used as a reference graph to a graph that is continually being updated automatically or manually.
Scenario 4: Comparing Data Graphs from Different Runs of Same Program
Data graphs persist between different runs of the same program. Graphs from previous runs will not be overwritten unless they are manually updated or automatic updating is turned on.
-
Load the C or Fortran example program.
-
Set a breakpoint at the end of the program.
-
Start the program, running the program to the breakpoint.
-
Type vec into the expressions text field, and choose Data Graph Expression.
-
A graph of the vec array appears (as a sine curve).
-
Now you can edit the program (for example, replace sin with cos). Use fix and continue to recompile the program and continue (click the Fix tool bar button).
-
Restart the program.
-
Because automatic updating is turned off, the previous graph does not get updated when the program reaches the breakpoint.
-
Choose Data Graph Expression (vec is still in the Expressions text field), a graph of the current vec values appear alongside the graph of the previous run.
-
The data from the two runs can now be compared. The graph of the previous run will only change if it is updated manually using the update button, or if automatic updating is turned on.
Fortran Example Program
real vec(100)
real af(50,50)
real bf(-3:3,-10:20)
real cf(50, 100, 200)
int x,y,z

ct = 0

do x = 1,100
            ct = ct + 0.1
            vec(x) = sin(ct)
enddo

do x = 1,50
           do y = 1,50
              af(x,y) = (sin(x)+sin(y))*(20-abs(x+y))
           enddo
 enddo

do x = -3,3
          do y = -10,20
            bf(x,y) = y*(y-1)*(y-1.1)-10*x*x*(x*x-1)
          enddo
enddo

do x = 1,50
          do y = 1,100
            do z = 1,200
              cf(x,y,z) = 3*x*y*z - x*x*x - y*y*y - z*z*z
            enddo
          enddo
enddo

end
C Example Program
#include <math.h>
main()
{
    int x,y,z;
    float ct=0;
    float vec[100];
    float af[50][50];
    float bf[10][20];
    float cf[50][100][200];

    for (x=0; x<100; x++)
    {
          ct = ct + 0.1;
          vec[x] = sin(ct);
    }
    for (x=0; x<50; x++)
    {
          for (y=0; y<50; y++)
          {
          af[x][y] = (sin(x)+sin(y))*(20-abs(x+y));
          }
    }
    for (x=0; x<10; x++)
    {
          for (y=0; y<20; y++)
          {
            bf[x][y] = y*(y-1)*(y-1.1)-10*x*x*(x*x-1);
          }
    }
    for (x=0; x<50; x++)
    {
          for (y=0; y<100; y++)
          {
          for (z=0; z<200; z++)
          {
                    cf[x][y][z] = 3*x*y*z - x*x*x - y*y*y - z*z*z ;
          }
          }
    }
}
- © 2010, Oracle Corporation and/or its affiliates
