Specifying Proper Array Expressions
To display your data you must specify the array, and how it should be displayed. You can invoke the Data Graph window from the Sun WorkShop Debugging window by typing an array name in the Expression text box. All scalar array types are supported except for complex (Fortran) array types.
Single-dimensional arrays are graphed (a vector graph) with the x-axis indicating the index and the y-axis indicating the array values. In the default graphic representation of a two-dimensional array (an area graph), the x-axis indicates the index of the first dimension, the y-axis indicates the index of the second dimension, while the z-axis represents the array values. You can visualize arrays of n dimensions, but at most, only two of those dimensions can vary.
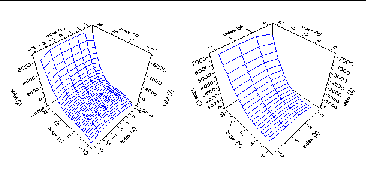
You do not have to examine an entire dataset. You can specify slices of an array, as shown in the following examples. Figure 10-1and Figure 10-2 show the bf array from the sample Fortran program given at the end of this chapter.
Figure 10-1 Graph of (left) bf array name only, (right) bf(0:3,1:20)

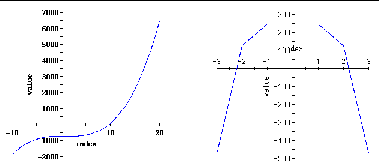
The next two figures show the array with a range of values:
Figure 10-2 Graph of array bf: (left) bf(-3:3,:), (right) bf(:,-7:7)

Graphing an Array
Before you can graph an array, you need to follow these preliminary steps:
-
Load a program into the Debugging window.
Choose Debug New Program to load your program. If the program was previously loaded in the current Sun WorkShop session, choose the program from the program list in the Debug menu.
-
Set at least one breakpoint in the program.
You can set a single breakpoint at the end of the program or you can set one or more at points of interest in your program.
-
Run your program.
When the program stops at the breakpoint, decide which array you want to examine.
Now you can graph the array. Sun WorkShop provides multiple ways to graph an array through Sun WorkShop:
From the Debugging window. You can enter an array in the Expression text field and choose Data Graph Expression or you can select an array in a text editor and choose Data Graph Selected in the Debugging window.
From the Data Display window. You can choose the Graph command from the Data menu or from the identical pop-up menu (right-click to open the pop-up). If the array in the Data Display window can be graphed, the Graph command is active.
From the Data Graph window. You can choose Graph New, enter an array name in the Expression text field in the Data Graph: New window and click Graph.
If you click the Replace current graph button, the new graph replaces the current one. Otherwise, a new Data Graph window is opened.
From the dbx Commands window. You can display a Data Graph directly from the dbx command line with the vitem command (you must have opened the Dbx Commands window from Sun WorkShop):
(dbx) vitem -new array-expr
array-expr specifies the array expression to be displayed.
- © 2010, Oracle Corporation and/or its affiliates
