Changing Your Display
Once your data is graphically displayed, you can adjust and customize the display using the controls in the Data Graph window. This section presents examples of some of graph displays that you can examine.
The Data Graph window opens with the Magnify and Shrink options present. when graphing any type of array. With an area graph, the window includes the Axis Rotation and Perspective Depth fields. These options enable you to change your view of the graph by rotating its axis or increasing or decreasing the depth perspective. To quickly rotate the graph, hold the right mouse button down with the cursor on the graph and drag to turn the graph. You can also enter the degree of rotation for each axis in the Axis Rotation field.
Click Show Options for more options. If the options are already shown, click Hide to hide the additional options.
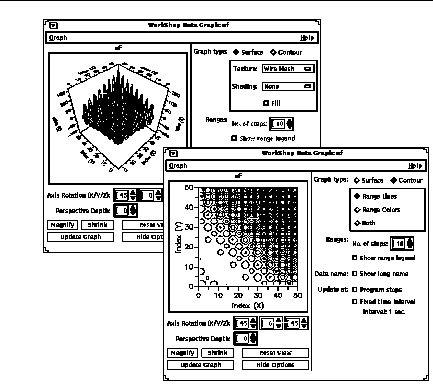
Figure 10-3 shows two displays of the same array. The figure on the left shows the array with a Surface graph type with the Wire Mesh texture. The figure on the right shows the array with a Contour graph type delineated by range lines.
Figure 10-3 Two Displays of the Same Array

When you choose a Contour graph type, the range options enable you to see areas of change in the data values.
The display options for the Surface graph type are texture, shading, and fill. Texture choices include Wire Mesh or Range Lines as shown in Figure 10-4.
Figure 10-4 Surface graph with (left to right) Wire Mesh, Range Lines

Shading choices for the Surface graph type include Light Source or Range Colors:

Turn on Fill to shade in areas of a graph or to create a solid surface graph.

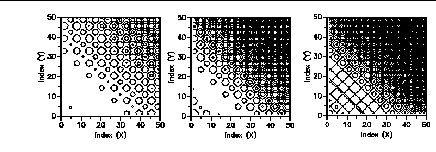
Choose Contour as the graph type to display an area graph using data range lines. With the Contour graph type, you have the additional options of displaying the graph in lines, in color, or both.
Figure 10-5 Contour graph with (left to right) Range Lines, Range Colors, Both

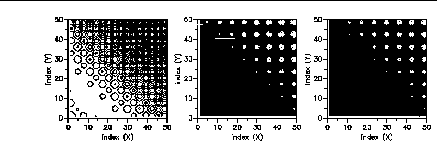
You can change the number of data value ranges being shown by changing the value in the Ranges: No. of steps.field.
Figure 10-6 Number of steps (left to right): 5, 10, 15

Be aware that if you choose a large number of steps, you can adversely affect the color map.
Click on the Show range legend button if you want a legend to display your range intervals.
- © 2010, Oracle Corporation and/or its affiliates
