Visualizing Multiple Processes in MP Prism
When you print or display an object in MP Prism, the data is shown for all processes in the pset you specify (in the current pset, if you do not include a pset qualifier). Choosing the Print or Display selection from the Debug menu prints or displays data for processes in the current pset.
If there is only one process in the pset, the visualizer that is displayed is no different from the visualizer you would see in scalar Prism.
If there is more than one process in the pset, Prism adds a dimension to the visualizer. The extra dimension represents the processes in the set. For example, if the variable is scalar, Prism displays a 1-dimensional array that represents the value of the variable in each process. If you are printing a 1-dimensional array, Prism uses a 2-dimensional visualizer.
For C programs, axis 0 represents the processes. For Fortran 77 programs, the highest-numbered axis represents the processes.
Prism can aggregate data from multiple processes only if the expression has the same size and number of dimensions in each process; if it doesn't, Prism prints an error message.
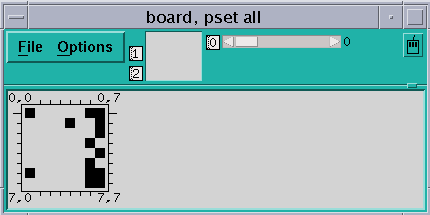
In the example shown in Figure 5-20, the variable board is an 8x8 array (representing a chess board); the current pset contains four processes. Therefore, MP Prism displays a 3-dimensional visualizer. Axis 0 represents the processes. The figure shows the values of board in the first process in the set. You would drag the white bar in the slider portion of the data navigator to display the values in the other processes in the set. (Note that, for a 2-dimensional Fortran array, where axis 3 would represent the processes, you might want to rearrange the display axes so that axis 3 is on the slider. You can do this by clicking in the box to the left of the slider and changing the number to a 3.)
Figure 5-20 Visualizer in MP Prism (Threshold Representation)

To find out the value and process number for an element, shift-click on the element.
Printing to the history region, or in commands-only Prism, works the same way. Axis 0 represents the processes. Here is some of the history-region output for the data shown below:
(prism all) print board board = process 0 (0,0,0:4) 4 1 0 3 0 (0,0,5:7) -1 0 -4 (0,1,0:4) 2 1 0 0 0 (0,1,5:7) 0 -1 0 (0,2,0:4) 3 1 0 0 0 (0,2,5:7) 2 -1 -3 (0,3,0:4) 5 0 0 0 -1 (0,3,5:7) 0 0 -5 (0,4,0:4) 4 0 0 -2 0 (0,4,5:7) 0 0 -6 (0,5,0:4) 0 1 0 0 0 (0,5,5:7) 0 -1 0 (0,6,0:4) 0 1 0 0 0 (0,6,5:7) 0 -1 0 (0,7,0:4) 6 -1 0 0 0 (0,7,5:7) 0 -1 -4 process 1 (1,0,0:4) 4 1 0 3 0 (1,0,5:7) -1 0 -4 (1,1,0:4) 2 1 0 1 0 ... |
The elements of axis 0 do not necessarily correspond to the numbers of the processes they represent. For example, if you were visualizing a variable in pset (1, 3, 5, 7), element 0 of axis 0 would represent process 1, element 1 would represent process 3, and so forth.
MP Prism provides a Cycle visualizer window you can use to display the values of a variable in the cycle pset; see " The cycle Pset". If you issue the command
print x on cycle
Prism displays a window containing the value of x in the current process of the current pset. If you then issue the cycle command or otherwise cycle through the members of the cycle pset, this window automatically updates to display the value of x in the next member of the set. This provides a convenient way of examining a variable in a series of processes.
- © 2010, Oracle Corporation and/or its affiliates
