Visualizing MPI Message Queues
Use the Prism MPI queue visualizer to examine the message queues created by your Sun MPI program. The visualizer shows you the status of messages generated by nonblocking send and receive routines that have not been reaped by a call to MPI_Test or MPI_Wait.
By showing you the state of the queue, detailing the messages that have not completed, Prism gives you clues regarding where your program's logic can be tuned.
The Prism queue visualizer also shows you unexpected receive routines, indicating performance or correctness problems:
-
Performance - An unexpected receive indicates the receipt of a message before a posted matching receive; an extra copy of the message may be incurred.
-
Correctness - An unexpected receive can arise due to an intended receive not having been posted or having been posted incorrectly, such as with the wrong tag. The program may deadlock due to errors.
In addition to viewing the status of messages, you can also view the contents of the messages themselves to ensure that the correct data was transmitted.
Note -
Prism does not display blocking sends and receives on message queues. If a blocking routine such as an MPI_Send hangs your program, you can use Prism to display a stack backtrace to find the problem, showing the MPI_Send present on the stack. Prism also does not display MPI generalized requests.
Launching the MPI Queue Visualizer
To launch the MPI queue visualizer, choose the MPI Msgs selection under the Prism Debug menu. This selection is available only when a program linked to the Sun MPI library has been loaded into Prism. See Figure 5-23 for an example.
Using the MPI Queue Visualizer
Each row of messages displayed in the message queue window corresponds to a process rank, numbered from zero. The following sections describe how each part of the MPI queue visualizer window affects the display of messages.
Selecting the Queue to Visualize
Use the View menu to select the queues to visualize. You can view three classes of MPI queues for each rank:
-
Posted Sends
-
Posted Receives
-
Unexpected Receives
You can view queues only when a rank has stopped. Otherwise, the visualizer displays the label running for that rank. Prism re-evaluates the queue every time the rank stops.
Zooming Through Levels of Message Detail
The MPI queue visualizer opens, by default at zoom level three. Using the Zoom buttons, you can zoom through four levels of message detail. The levels are:
Examples of the zoom levels are:
-
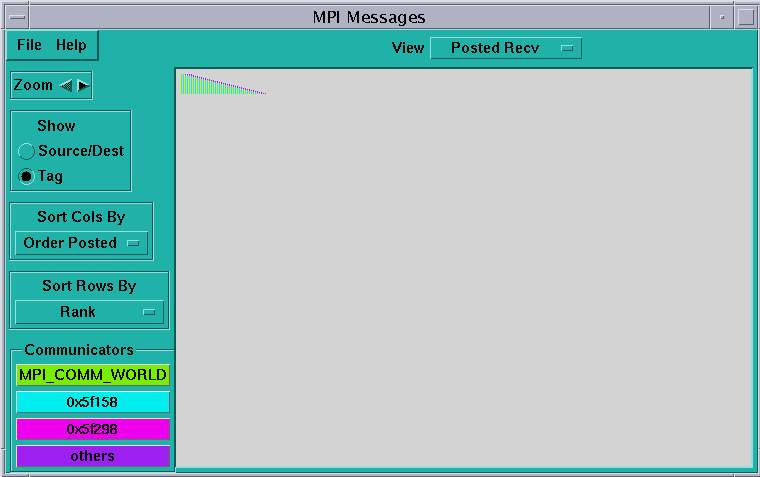
Figure 5-21 shows a single pixel per message. This zoom level is useful when examining very large MPI jobs.
Figure 5-21 Queue Visualizer at Zoom Level One
-
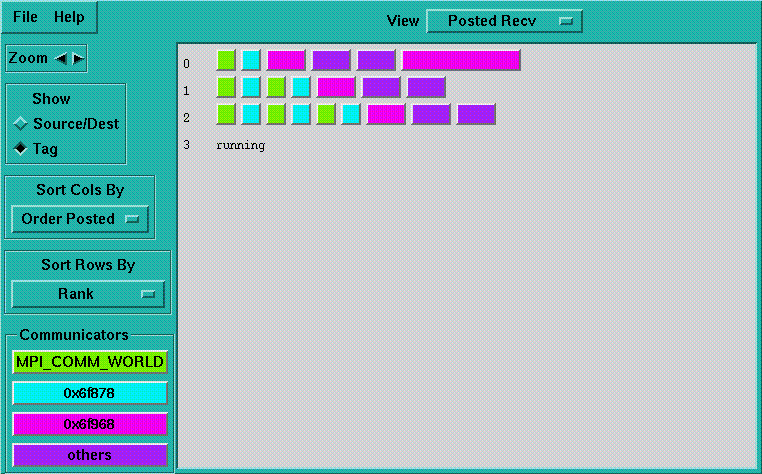
Figure 5-22 shows a simple box per message (the size of the box increases with the size of the message).
Figure 5-22 Queue Visualizer at Zoom Level Two
-
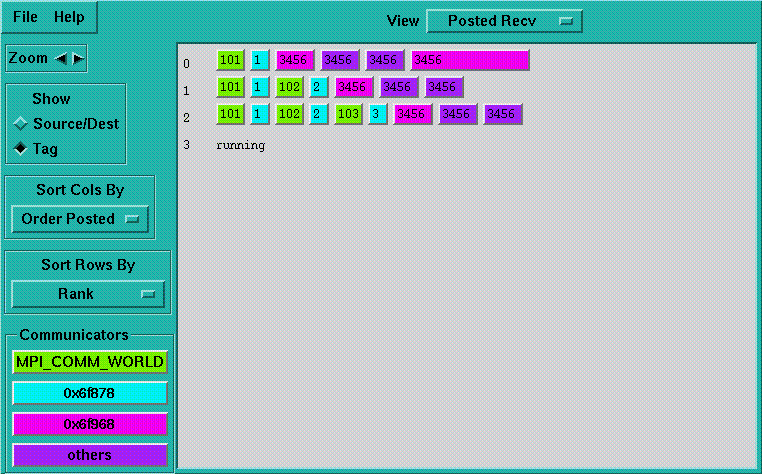
Figure 5-23 shows a single label on message. Clicking the buttons on the Show menu toggles the labels. Label choices are Source/Destination and Tag.
Figure 5-23 Queue Visualizer at Zoom Level Three
-
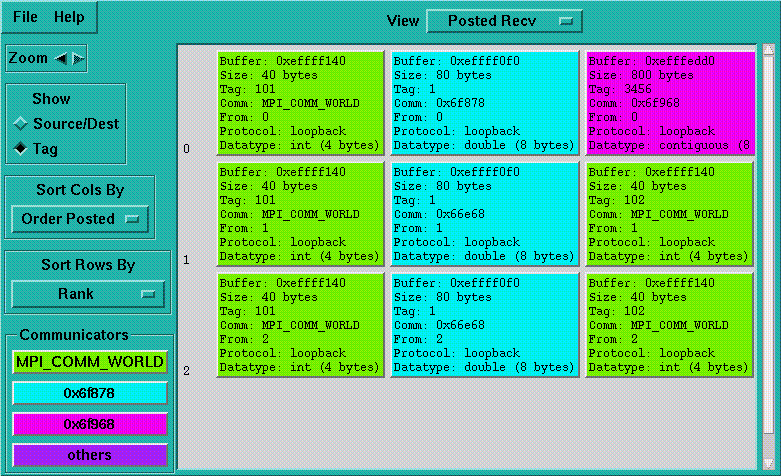
Figure 5-24 shows the entire message.
Figure 5-24 Queue Visualizer at Zoom Level Four
Controlling the Values of Message Labels
Use the toggle buttons under Show on the MPI queue visualizer to control the value of the message labels. Select Source/Dest to show the source or destination rank for the message; select Tag to show the MPI tag of the message. The Show toggle affects the display of messages at zoom level three only.
Sorting Messages
You can sort messages by row or by column according to several criteria, by choosing selections from the Sort Rows By and Sort Columns By option menus.
Table 5-1 Column Sort Criteria|
Sort Criteria |
Description |
|---|---|
|
Order posted |
Sort messages by the order in which messages are posted by the MPI program, with the earliest posted on the left. This is the default. The implementation of MPI Sends of large messages may queue and dequeue the message several times once the rendezvous begins, at which point the posted order seen in the visualizer no longer matches the programmatic order. At present there is no way to distinguish such messages. |
|
Source/Destination |
Sort by the source rank for receives and the destination rank for sends. |
|
Tag |
Sort by the messages' tag values. |
|
Size |
Sort by size in bytes, from small to large. |
|
Communicator |
Sort by communicator address. |
|
Protocol |
Group together messages sent with the same transport protocol. Protocols are loopback, shared memory, RSM, and TCP. |
Table 5-2 Row Sort Criteria
|
Sort Criteria |
Description |
|---|---|
|
Rank |
Sort rows from the smallest to the largest process rank (the default). |
|
Message Count |
Sort by the number of messages posted. |
|
Message Volume |
Sort by the sum of the sizes, in bytes, of all messages for each rank. |
Since the graphical size of a message is not linearly proportional to the message length in bytes, a number of small messages may occasionally extend further to the right in the visualizer than a single large message of greater total size.
Displaying Message Fields
Click individual messages to open the Message dialog box, shown in Figure 5-25.
Figure 5-25 Message Dialog Box
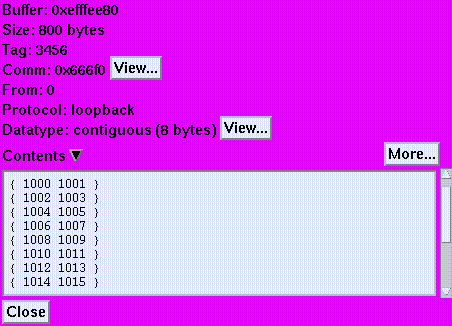
The fields in the Message dialog box are described in Table 5-3.
Table 5-3 Message Dialog Box Fields|
Label |
Description |
|---|---|
|
Buffer |
The address of the message. |
|
Size |
The length (in bytes) of the message. |
|
Tag |
The MPI tag argument passed in the call to post the message. |
|
Comm |
The name of the MPI communicator in which the message belongs, or the communicator's address if it is unnamed. Click on the Communicator View button to display the Communicator dialog box. |
|
To |
The rank of the destination of the message. Prism displays this field only for posted sends. |
|
From |
The rank of the sender of the message. Prism displays this field only for posted receives or unexpected receives. |
|
Protocol |
The implementation method by which the message has been sent. Possible values are: loopback, shared memory, RSM, and TCP. |
|
Data Type |
The MPI data type of the message, with the size of a single data type element in bytes. Click on the Data Type View button to display the Data Type dialog box. See "Data Types" for more information about the Data Type dialog box.The View button is available only for user-defined data types. |
|
Contents |
The contents of the message. Click on the triangular button to open or close the contents area. Click on More repeatedly to scroll through more of the message, until the whole message has been displayed. |
When the Message dialog box displays a posted receive, it displays the value of the buffer address as null (indicating that no buffer has been allocated), and disables the Contents button.
When the Message dialog box displays an unexpected receive, it shows the delivered message with no data type. This characteristic is due to MPI design, since a posted receive declares the data type. Here too, the Contents button is disabled, and the visualizer displays the value of the buffer address as null.
Displaying Communicator Data
Prism displays MPI Communicators in the Communicators region of the MPI queue visualizer window. The visualizer does not display all the communicators that have been created in an MPI program; rather, it displays only communicators referenced by currently posted messages. Thus, if no messages are visible, then the visualizer displays no communicators.
Prism displays as many as three distinct communicators. Each communicator is color coded, and messages are drawn using the color of their communicator. If more than three communicators are present, then the excess are grouped together under a single color labeled Others.
You can change colors for the communicators by setting the following X resources in the Prism application defaults file:
-
Prism.comm1Color
-
Prism.comm2Color
-
Prism.comm3Color
-
Prism.commOtherColor
For information about modifying values in the Prism applications defaults file, see " Changing Prism Defaults".
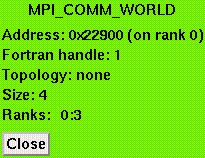
Figure 5-26 shows the Communicator dialog box. Press any of the communicator buttons to reveal the Communicator dialog box, displaying the following information:
-
Name
-
Address - The address of the communicator.
-
Fortran handle - The Fortran identifier for the communicator, if defined. Built in communicators such as MPI_COMM_WORLD have predefined Fortran handles. Other communicators are assigned a Fortran handle only if they are used in a Fortran subroutine.
-
Topology - The options are:
-
Cartesian - Communicators created using MPI_Cart_create.
-
Graph - Communicators created using MPI_Graph_create.
-
None - All others.
-
-
Size - The number of ranks.
-
Remote Size - Shown only for intercommunicators; the size of the remote group (the number of ranks). For information about intercommunicators, see the MPI_Intercomm_create man page.
-
Ranks - The list of ranks, possibly annotated with job identifiers if the communicator was created via an MPI client/server rendezvous or an MPI_Spawn. The ranks displayed for a communicator are relative to MPI_COMM_WORLD, rather than relative to the communicator's parent.
Figure 5-26 Communicator Dialog Box
Data Types
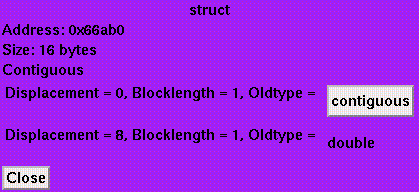
Figure 5-27 shows the Data Type dialog box. Display the Data Type dialog box by clicking on the Data Type View button in a Message dialog box. The fields of this dialog box are:
-
Type - The description of the data type, such as "struct" or "contiguous."
-
Address - The address of the corresponding MPI_Datatype object in the MPI program.
-
Size - The size in bytes of a single element of this data type.
-
Contiguous - An indication that the bytes of this data type are contiguous and may be sent or received without any intermediate packing or unpacking. If the data type is not contiguous, the label changes to Non-contiguous.
-
Additional information that is specific to the data type, representing arguments that were passed to MPI to create the data type. This may include offsets, block sizes, pointers to other data types, and so forth. In this example, Displacement, Blocklength, and Oldtype refer to arguments the programmer used when creating the MPI struct data type. Click on buttons that name other data types to display the Data Type dialog box for that other type.
Figure 5-27 Data Type Dialog Box
- © 2010, Oracle Corporation and/or its affiliates
