Using the tnfview Timeline Window
The main tnfview screen displays the timeline of events generated by your program. Events of different types are represented by different colored shapes. Clicking on a single event selects it. Shift-clicking selects additional events.
The main window of tnfview has several control and display areas (in addition to the timeline graph):
-
Event Table - Selecting an event causes the event's data fields to be displayed in the tnfview Event Table below the timeline graph. Shift-click additional events to add events to the Event Table.
-
Navigation Menu - After you have selected an event, you can browse through the other events in the timeline, moving to the next or previous event in the same navigation category.
|
Menu Category |
Definition |
|---|---|
|
current probe |
Probe name. |
|
current tid |
Solaris thread ID. |
|
current lwpid |
Solaris lightweight process ID. |
|
cpu |
Always zero for user-level traces. |
|
current pid |
Solaris process ID. |
|
current vid |
Virtual thread ID - A logical thread ID assigned when trace files from different nodes are merged. |
|
time |
Strict time sequence, by millisecond. |
-
The navigation categories are shown in Table 6-3.
Note -For single-threaded multi-process programs, the virtual thread ID is the same as the MPI rank of each process.
-
Next, Previous Buttons - Displays each subsequent event's data field values in the tnfview Event Table (or adds the current event's data field values to the events already listed in the tnfview Event Table if one or more events are already listed). Simply clicking on an event empties the Event Table of prior entries, so that the Event Table contains only the data fields of the most recently selected event.
-
Scale Sliders - Adjusts the scale of either the X or Y axis (or both) of the timeline, zooming in or out. Note that the timeline Y axis is scaled by virtual ID, which is equivalent to processor rank in MPI programs.
-
Panner Window - Controls the selection of the area displayed in the timeline graph. Dragging the middle mouse button, you can select a subset of the timeline in the panner window, creating a selection frame. You can drag that frame to another location in the timeline using the left mouse button.
-
Graph Button - Opens the Graph window, in which you can create, modify, display, and analyze datasets based on events and event pairs (intervals).
-
Print Button - Opens the Print dialog box, in which you specify the printer; prints the timeline view
Opening TNF Trace Files
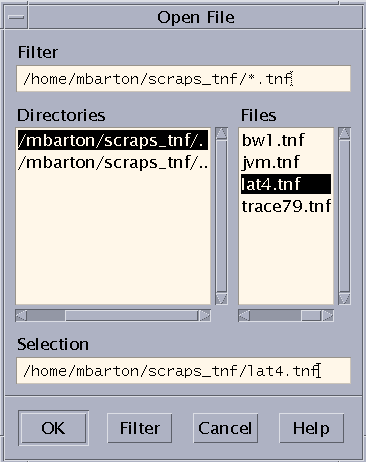
The Open Tracefile selection on the File menu opens the Open File dialog box. Use this dialog box to select a trace file for performance analysis.
Figure 6-2 Open File Dialog Box

Bookmarking Events
You can set a bookmark. in the Timeline window on any selected event. Such bookmarks enable you to return to a specific view in the Timeline window. Bookmarks remain only for the duration of the current session. Once a bookmark has been set, you can select it from the Bookmark menu. Selecting a bookmark will return you to the event, restoring the contents of the Event Table and the zoom and scroll factors that were in effect when the bookmark was set.
Navigating and Controlling the tnfview Timeline Window
The tnfview Timeline Window uses a set of mouse commands for each region of its window. The tnfview mouse commands for each region are shown in Table 6-4 through Table 6-7.
Table 6-4 Timeline Graph Mouse Commands|
Command |
Description |
|---|---|
|
Left Click |
Select an event and clear previous selections |
|
Shift-Left Click |
Select an additional event and add it to the set of selected events |
|
Middle Drag |
Select area for zoom |
|
Middle Click |
Center view around point |
|
Scroll Bars |
Scroll view of graph at current zoom factor |
|
Scale Bars |
Adjust zoom factor of each axis independently |
Table 6-5 Panner Graph Mouse Commands
|
Command |
Description |
|---|---|
|
Left Drag |
Drag view rectangle |
|
Middle Drag |
Select area of timeline for viewing |
Table 6-6 Navigation Control Mouse Commands
|
Command |
Description |
|---|---|
|
Left Arrow Button |
Select previous event |
|
Right Arrow Button |
Select next event |
|
Pull-down Menu |
Select navigation criteria |
Table 6-7 Event Table Mouse Commands
|
Command |
Description |
|---|---|
|
Left Click |
Select an event |
|
Up/Down Arrows (Keyboard) |
Select next/previous event in table |
Exiting tnfview
From the File menu, choose Exit to exit tnfview.
Exiting tnfview eliminates data generated during the current tnfview session. The tnfview program does not save generated datasets, bookmarks (described in "Bookmarking Events"), or any settings chosen during the session. Your original trace file remains unchanged.
- © 2010, Oracle Corporation and/or its affiliates
