Summary Statistics of MPI Usage.
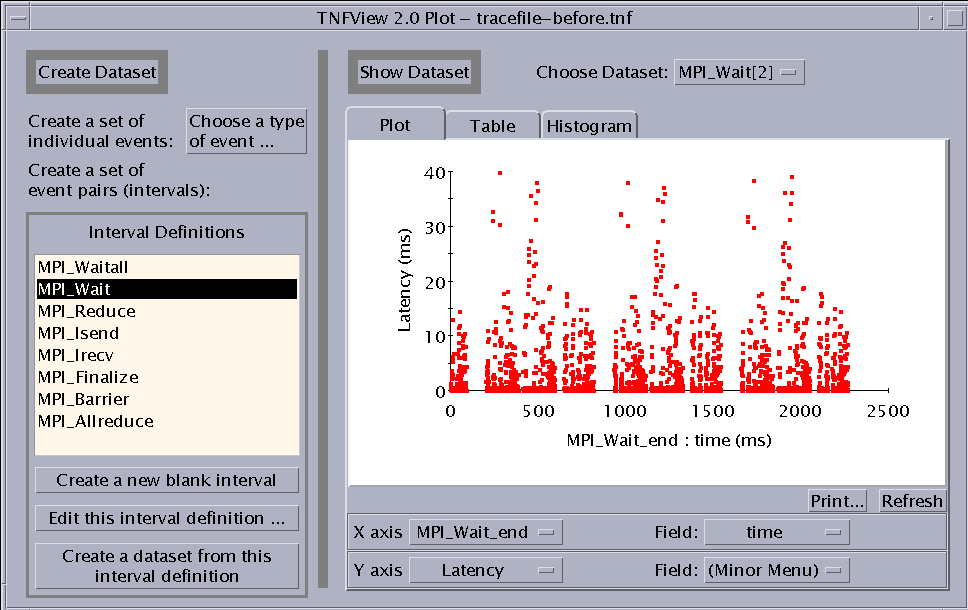
We now change views by clicking on the graph button at the top of tnfview's main window. A new window pops up and in the Interval Definitions panel you can see which MPI APIs were called by the benchmark, provided their probes were enabled. To study usage of a particular MPI routine, click on the routine's name in the list under "Interval Definitions" and then click on "Create a dataset from this interval definition" . The window will resemble Figure 7-3. While each point in Figure 7-1 or Figure 7-2 represented an event, such as the entry to or exit from an MPI routine, each point in Figure 7-3 is an interval -- the period of time between two events that is spent inside the MPI routine. The scatter plot graph shows three 700-ms iterations with three distinct phases per iteration. The vertical axis shows that MPI_Wait calls are taking as long as 40 ms, but generally much less.
Figure 7-3 Graph Window Showing a Scatter Plot of Interval Data.

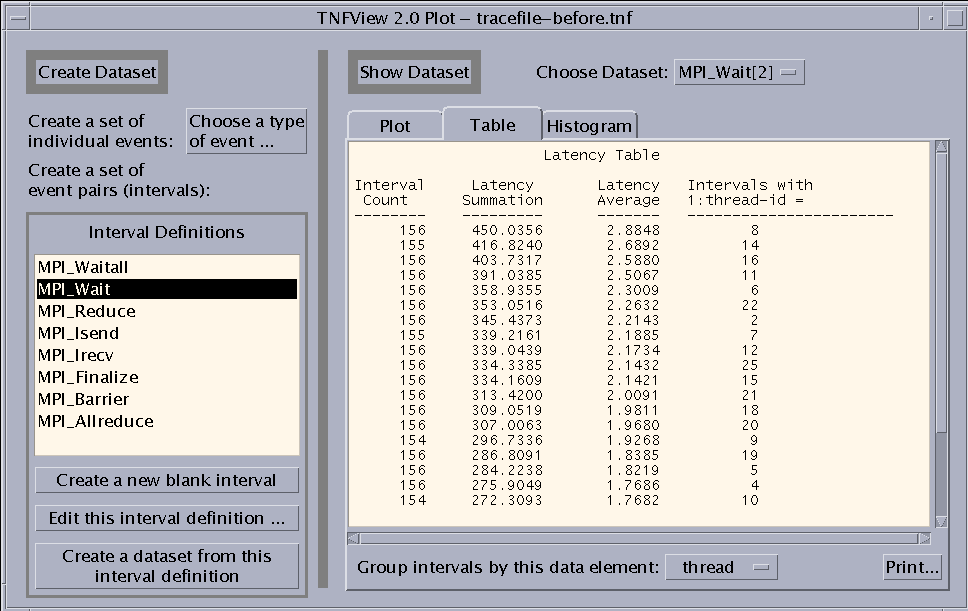
Next, click on the Table tab to produce a summary similar to that depicted in Figure 7-4. Again, times are reported in milliseconds. The first column (Interval Count) indicates how many occurrences of the interval are reported, the second column (Latency Summation) reports the total time spent in the interval, the third column gives the average time per interval, and the fourth column lists the data element used to group the intervals. In the case of Figure 7-4, some threads (MPI processes) spent as long as 450 ms in MPI_Wait calls. Since only about 2.3 seconds of profiling data is represented, this represents roughly 20% of the run time. By repeatedly clicking on other intervals (MPI calls) in the list under "Interval Definitions" and then on "Create a dataset from the selected interval definition", you can examine times spent in other MPI calls and verify that MPI_Wait is, in fact, the predominant MPI call for this benchmark.
Figure 7-4 Graph Window Showing a Summary Table of Interval Data.

The graph window summary can be used to judge, overall, which MPI calls are costing the most time.
The tables may be organized in different ways. For example, we may pull down Group intervals by this data element: and select 2:bytes. That is, we want to group MPI_Wait calls by the number of bytes received, as reported by event 2 (MPI_Wait_end).
We learn that much of the MPI_Wait time is spent waiting for receives of roughly 40 Kbytes, but more time is spent waiting for sends to complete. (In the current release, this fourth column is often reported in hexadecimal format.)
- © 2010, Oracle Corporation and/or its affiliates
