Synchronizing Skewed Processes: Scatter Plot View
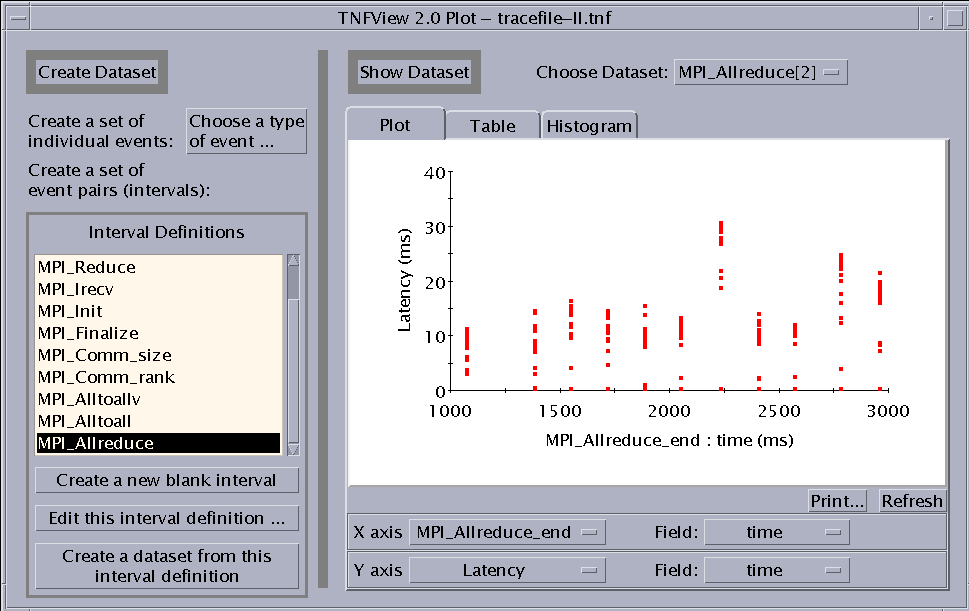
We can see even more data in one glance by going to a scatter plot. In Figure 7-9, time spent in MPI_Allreduce (its latency) is plotted against the finishing time for each call to this MPI routine. There is one warm-up iteration, followed by a brief gap, and then ten more iterations, evenly spaced. In each iteration, an MPI process might spend as long as 10 to 30 ms in the MPI_Allreduce call, but other processes might spend vanishingly little time in the reduce. The issue is not that the operation is all that time consuming, but simply that it is a synchronizing operation, and so early arrivers have to spend a some time waiting for latecomers.
Figure 7-9 Scatter Plot of MPI_Allreduce Latencies (x axis: MPI_Allreduce_end).

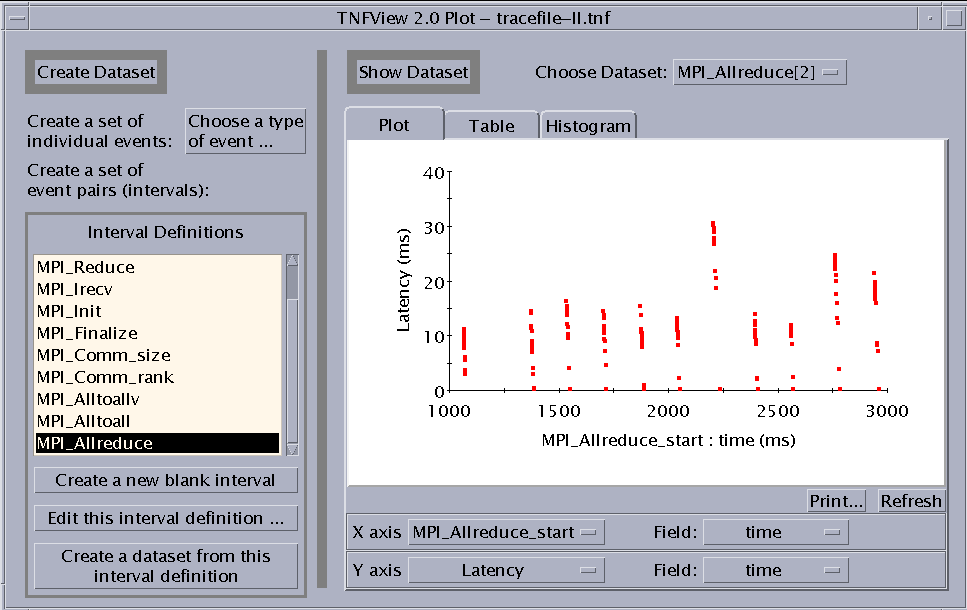
We see another view of the same behavior by selecting the time for the MPI_Allreduce_start event, rather than for the MPI_Allreduce_end event, for the X axis. Clicking on Refresh produces the view seen in Figure 7-10. This curious view is much like Figure 7-9, but now the lines of points are slanted up to the left instead of standing straight up. The slopes indicate that high latency is exactly correlated to early entry into the synchronizing call. For example, a 30-ms latency corresponds to an early entrance into the MPI_Allreduce call by 30 ms. This is simply another indication of what we saw in Figure 7-9. That is, processes enter the call at different times, but they all exit almost immediately once the last process has arrived. At that point, all processes are fairly well synchronized.
Figure 7-10 Scatter Plot of MPI_Allreduce Latencies (x axis: MPI_Allreduce_start) Showing Process Skew.

The next MPI call is to MPI_Alltoall, but from our Prism profile we discover that it occurs among well-synchronized processes (thanks to the preceding MPI_Allreduce operation) and uses very small messages (64 bytes). It consumes very little time.
- © 2010, Oracle Corporation and/or its affiliates
