Interpreting Performance Using Histograms
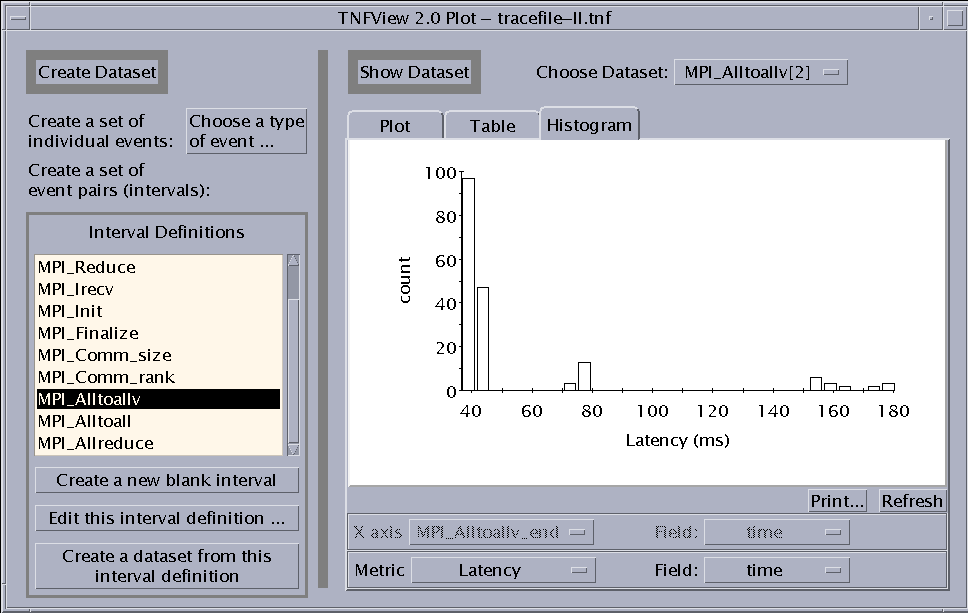
The chief MPI call is this case study is the MPI_Alltoallv operation. The processes are still well synchronized, as we saw in Figure 7-8, but we learn from the Table display that there are on average 2 Mbyte of data being sent or received per process. Clicking on the Histogram tab, we get the view seen in Figure 7-11. There are a few, high-latency outliers, which a scatter plot would indicate take place during the first warm-up iteration. Most of the calls, however, take roughly 40 ms. The effective bandwidth for this operation is therefore
(2 Mbyte / process)
* 16 processes / 40 ms = 800 Mbyte/second
Basically, each datum undergoes two copies (one to shared memory and one from shared memory) and each copy entails two memory operations (a load and a store), so this figure represents a memory bandwidth of 4 * 800 Mbyte/s = 3.2 Gbyte/s. This benchmark was run on an HPC 6000 server, whose backplane is rated at 2.6 Gbyte/s. Our calculation is approximate, but it nevertheless indicates that we are seeing saturation of the SMP backplane and we cannot expect to do much better with our MPI_Alltoallv operation.
Figure 7-11 Histogram of MPI_Alltoallv Latencies.

- © 2010, Oracle Corporation and/or its affiliates
