

This chapter covers the following topics:
The OS Crash Dump Analyzer checks the dump configuration of a system and detects OS crash dumps.
This module also does the following:
- It displays the current configuration of the system crash dump data and helps detect OS crash dumps saved in the savecore directory.
- Then, it helps you to analyze the crash dumps by printing out the initial system crash dump analysis.
- Finally, it enables you to specify one or more email addresses to which the resulting output can be sent.
The OS Crash Dump module generates:
- An alert alarm when it detects at least one crash dump is detected.
- A caution alarm if savecore is disabled, since this is not a recommended configuration.
- A caution alarm for each UNIX or vmcore file the module cannot find.
You can configure the alarm thresholds through the Attributes window. For more information on the Attributes window, refer to the Sun Management Center 3.0 Software User's Guide.
The dumpadm command on which the data acquisition for the module is based is available only on Solaris 7 and 8 operating environments. Therefore, if at setup time the dumpadm tool cannot be found, the module prompts for the location of the savecore directory. The usual location is /var/crash/<system_name>. This information is then saved in a configuration file:
/var/opt/SUNWsymon/SysMgtPack/crashdump/dumpadm.cfg
|
The content of this file is then used (instead of the dumpadm command) to get the data. If both the dumpadm command and this configuration file are not accessible, the module becomes unavailable and generates an error alarm.
 |
To Access the OS Crash Dump Analyzer
|
| |
1. |
Load the OS Dump Analyzer module. |
| |
|
To learn how to load a module, refer to the Sun Management Center 3.0 Software User's Guide. The Sun Management Center loads this module under the Operating System category. You can also specify your contact email address at this time. |
| |
2. |
Double-click the Operating System option in the Navigator window. |
| |
3. |
Double-click the OS Crash Dump Analyzer option. |
| |
|
The Viewer displays the OS Dump Analyzer icon in the Viewer window. |
| |
4. |
Double click the OS Crash Dumps icon in the Viewer window. |
| |
|
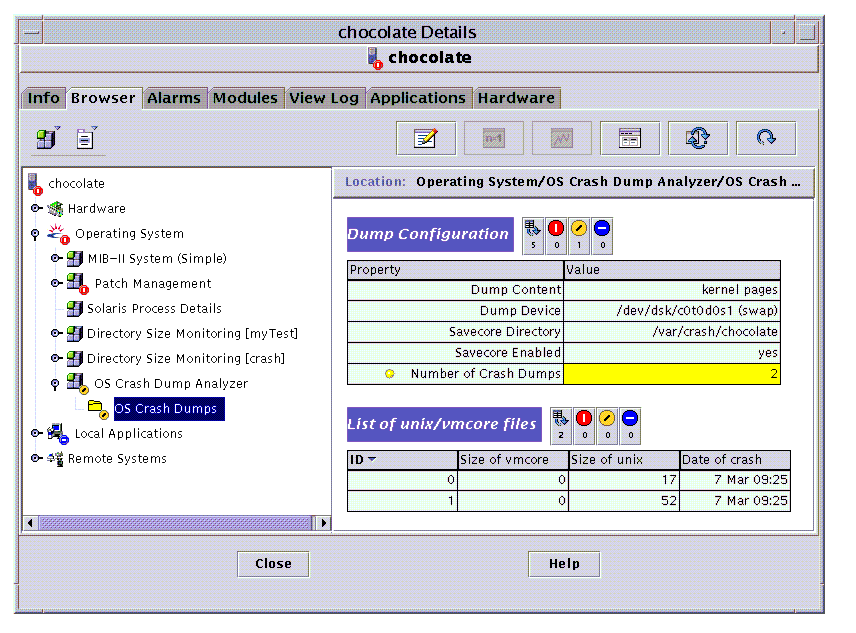
Sun Management Center displays the Details window and presents the following OS Crash Analyzer tables: |
On the right side of each table title, the OS Crash Dump Analyzer displays the associated alarm counts.

FIGURE 2-1 OS Crash Dump Analyzer Tables
The Dump Configuration Property Table does not show the same information on Solaris 2.5.1 and Solaris 2.6. On these operating systems, only the savecore directory and number of crash dumps contain values. In FIGURE 2-1, you see the following:
Dump Configuration Property Table
The Dump Configuration Property Table displays the following values.
TABLE 2-1 Dump Configuration Property Table
Field Name
|
Description
|
|---|
|
Dump Content
|
Includes possible values for any one of the following:
"Kernel pages" for kernel memory pages only
"All pages" for all memory pages
|
|
Dump Device
|
Possible values include:
"Dump-device," which is a specific dump device specified as an absolute pathname, such as /dev/dsk/cNtNdNsN
"Swap," where if the special token swap is specified as the dump device, dumpadm examines the active swap entries and selects the most appropriate entry to configure as the dump device.
|
|
Savecore Directory
|
Path to the savecore directory.
|
|
Savecore Enabled
|
"Yes" when enabled;
"No" when disabled.
|
|
Number of Crash Dumps
|
Number of crash dumps detected in the savecore directory.
|
Dump Configuration Property Table Alarms
- The Dump Configuration Property Table Alarms module generates a warning alarm if it detects at least one crash dump.
- The module generates an information alarm if savecore is disabled.
Note - The alarm threshold is configurable through the Attribute Editor window.
List of UNIX/vmcore Files Table
The List of unix/vmcore Files Table gives more information about each crash dump.
TABLE 2-2 List of unix/vmcore Files Table
Field
|
Description
|
|---|
| ID
|
File identification
|
| Size of vmcore
|
Size of vmcore file
|
| Size of unix core
|
Size of UNIX core file
|
| Timestamp
|
Timestamp
|
List of UNIX/vmcore Files Table Alarms
- The module will generate a caution alarm for each unix.x or vmcore.x file that it cannot find.
This module offers commands at the following levels:
From the Navigator
 |
To Access OS Dump Analyzer Commands
|
 |
Proceed with one of the following:
|
- Right-click any object in the Navigator or Viewer window at the Managed Object level.
- Right-click any field, row, or column to access commands at the lower levels.
To access the OS Dump Configuration and the crash dumps, refer to To Access the OS Crash Dump Analyzer.
At the Managed Object Level
 |
To Display the Savecore Filesystem Size
|
 |
Right-click OS Crash Dumps at the Navigator window and select Savecore
Filesystem Size.
|
��_

FIGURE 2-2 savecore Filesystem Size Command
- Sun Management Center displays the Probe Viewer window with the results of the above command:

FIGURE 2-3 savecore Filesystem Size Command Output
At the List of UNIX/vmcore Files Table Level
 |
To Analyze the Crash Dump
|
| |
1. |
Select a crash dump in the list. |
| |
2. |
Right-click anywhere on the row. |
| |
|
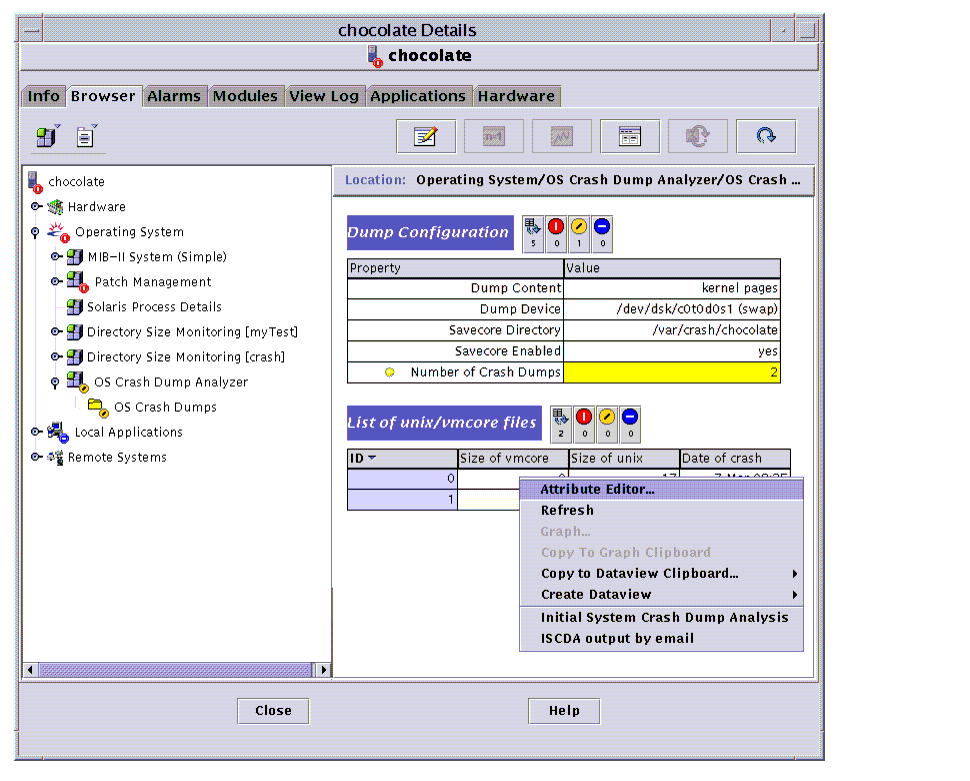
SysRM displays a pull-down menu of choices. |

FIGURE 2-4 Row Level Probe Commands
| |
3. |
Select Initial System Crash Dump Analysis. |
This option displays the results in the Probe Viewer window. The information includes stack trace, process information, message buffers, and other such detail.
If files are corrupted, for example, the Probe Viewer displays an incomplete report providing only status information.
 |
To Send Notification Mail
|
| |
1. |
Select a crash dump in the list. |
| |
|
Sun Management Center displays menu choices (FIGURE 2-4). |
| |
2. |
Right-click and select ISCDA output by e-mail. |
This option sends an email with the output to the specified contact person. If a contact email address is available, the Probe Viewer displays the results with the current status of the email notification.

FIGURE 2-5 Email Sent Successfully
If an address is not available, it displays the status and aborts the function.

FIGURE 2-6 Results When Email Address Not Provided
 |
To Specify an Email Address
|
The module assumes that you provided an email address when you loaded the module. To specify an email address, do the following.
| |
1. |
Select OS Crash Dump Analyzer in the Navigator window. |
| |
2. |
Right-click and select the Edit Module from the menu. |
| |
3. |
Fill in the contact email address. |


Copyright © 2001 Sun Microsystems, Inc. All Rights Reserved.


