| C H A P T E R 5 |
|
Using Hardware Diagnostic Suite With Sun Management Center Alarms |
This chapter describes how to view and customize Sun Management Center alarms for use with the Hardware Diagnostic Suite:
|
Note - The procedures in this chapter assume that the Hardware Diagnostic Suite is already running as described in Chapter 3. |
For additional information about Sun Management Center alarms, refer to the Sun Management Center 3.5 User's Guide.
The Sun Management Center software monitors your system and notifies you, using alarms, when abnormal conditions occur. These alarms are triggered when conditions fall outside the predetermined ranges.
The Hardware Diagnostic Suite uses the Sun Management Center Hardware Diagnostic Suite feature to trigger and display alarm conditions for the host you are testing. By default, every Hardware Diagnostic Suite test session error message triggers a Sun Management Center critical alarm. The alarm is displayed in the Sun Management Center console. Additionally, you can define which Hardware Diagnostic events trigger Sun Management Center alarms, and you can define the actions that take place when an alarm occurs.
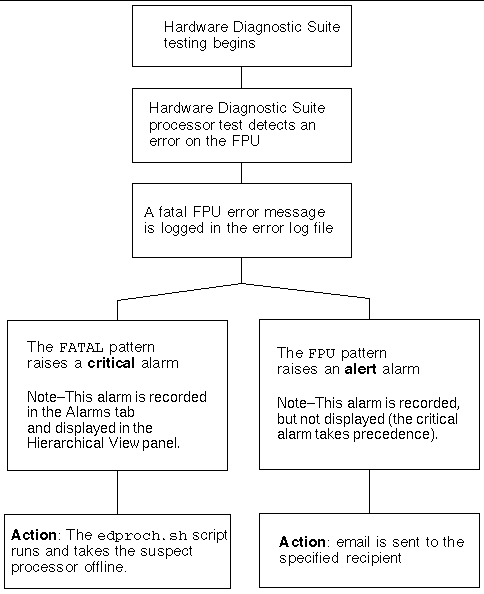
Sun Management Center can be configured to send email when certain alarms are triggered, and to execute scripts that perform an action on the system. For example, if the Hardware Diagnostic Suite detects an error on one FPU of a multiprocessor system, the event can raise an alarm that automatically triggers the execution of a script that takes the suspect CPU offline. In the meantime, an email notification is immediately sent to the system administrator. See FIGURE 5-7 for a flow chart of alarm actions.
Sun Management Center uses alarm indicators (TABLE 5-1) to alert you when an alarm condition occurs.
TABLE 5-2 describes the Sun Management Center window in which the alarm indicators are displayed.
|
Colored alarm indicators appear next to the host in the hierarchy and topology views. Also, the number of alarms for different categories is displayed in the Domain Status Summary (the group of circular colored alarm indicators in the upper right portion of the window). See FIGURE 3-2. |
|
|
A small colored alarm indicator appears next to the hostname at the very top of the Details window. |
|
|
Colored alarm indicators appear next to the Sun Management Center module that generated the alarm. Hardware Diagnostic Suite generated alarms appear next to the Local Applications indicator in the hierarchy and topology views. |
|
|
All alarm indications (unacknowledged and acknowledged) are listed in a table. |
The Alarms tab displays the host alarms with the following information:
|
Graphic indicator whose color indicates the severity of the alarm as described in TABLE 5-1. A green check next to the indicator means that the alarm is acknowledged. If no check is present, the alarm is unacknowledged. |
|
|
A "ringing" open indicator means the condition that caused the alarm still exists. A "silent" closed indicator means the condition no longer exists. |
|
1. In the Sun Management Center main window, look at the host in the hierarchy view or the topology view.
If an alarm indicator (TABLE 5-1) is displayed, there is an unacknowledged alarm condition that warrants further investigation.
Only one alarm indicator can be displayed for a host at a given time. If there are two or more types of alarms for the host, the more severe unacknowledged alarm takes precedence and is propagated up the tree. All alarms are listed in the Sun Management Center alarms window.
|
Note - Sun Management Center displays alarms for many kinds of events. Not all displayed alarms are generated by a Hardware Diagnostic Suite test session. |
|
Note - The Sun Management Center agent is configured so that only one server receives alarm information from that agent. |
2. If an alarm exists, follow these steps to view and acknowledge the alarm condition:
a. Double-click the host in the main Sun Management Center window to open the Details window.
The Alarms window is displayed (FIGURE 5-1). All alarms for this host are displayed.
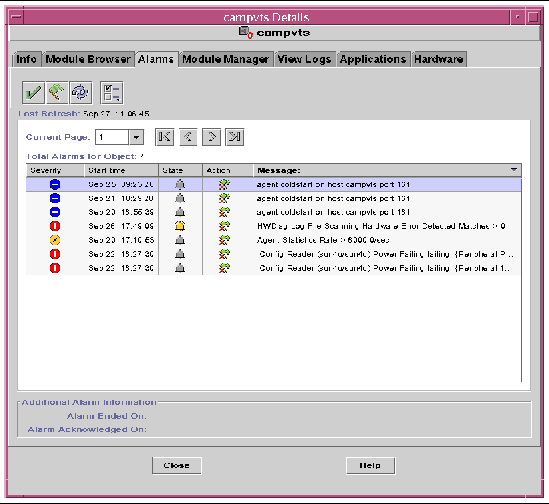
3. To acknowledge an alarm, select the alarm and click the check button  .
.
The alarm is marked acknowledged in the Alarms tab list. Acknowledged alarms are not displayed in other Sun Management Center windows.
Additional information about Sun Management Center alarms can be found in the Sun Management Center 3.5 User's Guide.
By default, the Hardware Diagnostic Suite error and information log files are scanned by Sun Management Center for any occurrence of the ERROR or FATAL text pattern. If the pattern is detected, an alarm is generated. You can modify the error condition criteria or create your own pattern which will generate an alarm when it is logged.
1. In the Sun Management Center main window, open the Details window for the host for which you plan to set or modify an alarm condition. (See FIGURE 3-3.)
2. Select the Details window Module Browser tab.
3. Double-click the Local Applications icon in the topology view.
4. Double-click the Hardware Diagnostic Suite icon in the topology view.
5. Double-click the Hardware Diagnostic Suite Agent icon in the topology view.
The Hardware Diagnostic Suite Agent properties are displayed (FIGURE 5-2).
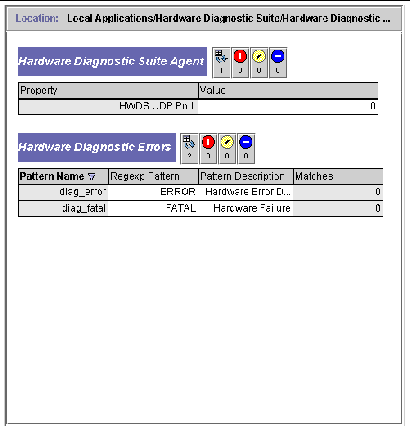
TABLE 5-4 describes these properties.
|
Used for communication between Hardware Diagnostics agent and server. |
||
|
Specifies the Pattern Name property. Pattern Name is the index key for this table and must be unique. Default Hardware Diagnostic Suite Error pattern names are: |
||
|
Specifies a description for the regexp patterns. Hardware Diagnostic Suite descriptions are: |
||
|
Defines the pattern that generates the alarm. The default Hardware Diagnostic Suite patterns are: ERROR--When this pattern occurs in the Hardware Diagnostic Suite log file, this indicates that a hardware error that requires intervention occurred. It might be due to missing media, a loose cable, or a disconnection. FATAL--When this pattern occurs, it is an indication that the hardware failure was unrecoverable. The Hardware Diagnostic Suite test might have detected a data miscompare or a hardware error. See TABLE 4-3 for descriptions of Hardware Diagnostic Suite error types. |
||
|
Displays the number of pattern matches that have occurred. When this number matches the alarm threshold, an alarm is triggered. This table cell is also used to define the alarm thresholds as described in Step 6 through Step 9. |
6. Select either the ERROR or FATAL data property by clicking on the Regexp Pattern table cell. (See TABLE 4-1 for error type descriptions.)
7. Open the Attribute Editor by doing one of the following:

The initial Attribute Editor panel shows information about the attribute. You cannot edit the properties for alarms in this panel.
8. Select the Alarms tab in the Attribute Editor.
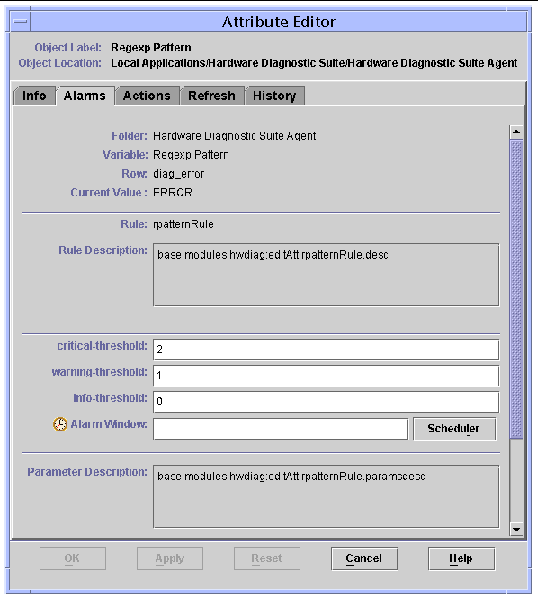
The alarms panel is displayed (FIGURE 5-3). This panel enables you to set alarm thresholds.
 [ D ]
[ D ]
9. Define the desired alarm thresholds by entering the appropriate numbers in the alarm threshold fields.
The alarm threshold determines the type of alarm to generate based on the number of pattern matches that occur (TABLE 5-5).
For example, you select the attribute editor for the FATAL pattern Regexp column. You enter values of 3, 2, and 1 for critical-threshold, warning-threshold, and info-threshold respectively.
When a Hardware Diagnostic Suite test session logs fatal errors, the type of alarm now displayed would be:
The default thresholds for both diag_error and diag_fatal patterns are:
To reset the thresholds to Hardware Diagnostic Suite default values, enter blanks in the fields.
The Sun Management Center Hardware Diagnostic Suite enables you to create your own pattern that will trigger an alarm when the defined pattern appears in the Hardware Diagnostic Suite error log file.
1. Open the Hardware Diagnostic Suite folder.
For instructions on how to do this, see To Edit the Alarm Thresholds for Hardware Diagnostic Suite, Step 1 through Step 5.
2. To add a new Hardware Diagnostic Suite log file pattern that will generate an alarm condition, perform the following steps:
a. Right-click anywhere on the Hardware Diagnostic Errors Table and select New Row from the pop-up menu.
The Add Row dialog box appears (FIGURE 5-4).
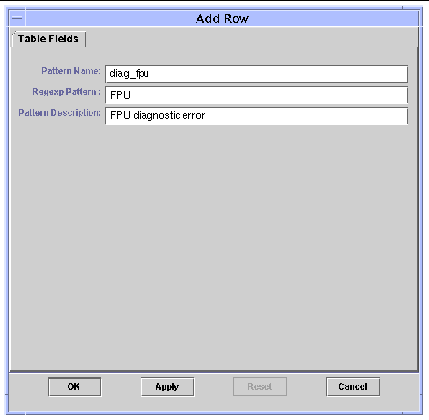
b. Enter information in the fields using the descriptions in TABLE 5-6.
Refer to TABLE 5-4 for detailed explanations of these fields.
|
Specifies the name of the alarm condition that you are creating. |
|
|
Specifies the regular expression (pattern) that generates the alarm condition. |
|
c. Complete one of the following actions:
d. Create the alarm thresholds that define the type of alarm that is triggered.
For instructions on how to do this, see To Edit the Alarm Thresholds for Hardware Diagnostic Suite.
Once you apply your changes, the new row is inserted in the table. If a Hardware Diagnostic Suite test session logs a message that contains the pattern you specified, an alarm is generated for that host.
By default, the Hardware Diagnostic Suite sends email to root when an Error or Fatal error is detected. However, you can customize the alarm action to do something different, such as run a script.
1. Open the Hardware Diagnostic Suite folder.
For instructions on how to do this, see To Edit the Alarm Thresholds for Hardware Diagnostic Suite, Step 1 through Step 5.
2. Open the Attribute editor for the Regexp Pattern table cell in the Hardware Diagnostic Errors Table.
For instructions on how to do this, see To Edit the Alarm Thresholds for Hardware Diagnostic Suite, Step 6 through Step 7.
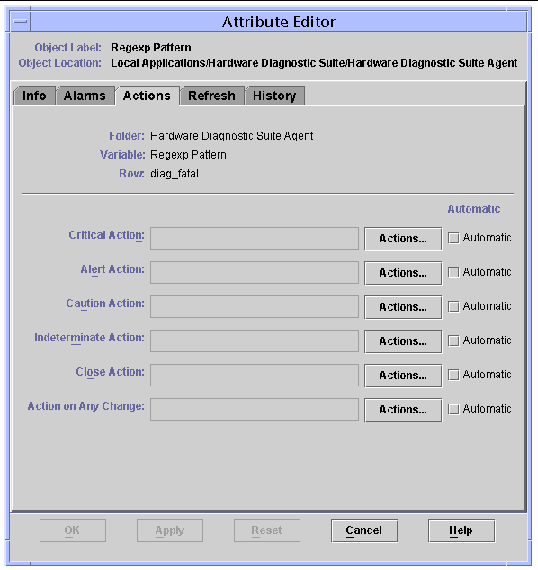
3. Select the Actions Tab in the Attribute Editor.
The Actions menu is displayed as shown in FIGURE 5-5. TABLE 5-7 describes the fields.
 [ D ]
[ D ]
4. Add an action to the action fields.
You can only specify one action in an action field. To have more than one action (to send email and run a script, for example), you must specify the actions in separate fields. The following example describes how to do this.
a. Click the Actions button next to the level (Critical, Alert, and so on) of your choice.
The Action Selection window is displayed (FIGURE 5-6).
b. Specify the email recipient.
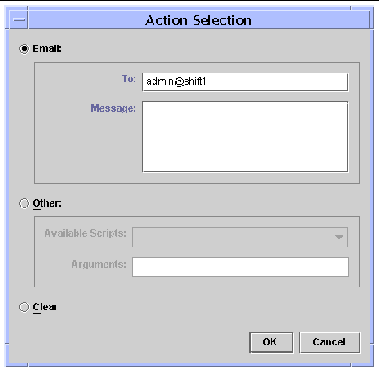
c. To create an action that runs a script when a critical Hardware Diagnostic Suite alarm is raised, perform the following:
i. Place the script in the /var/opt/SUNWsymon/bin directory, making sure that execute permissions are set.
|
Note - The script must reside in the /var/opt/SUNWsymon/bin directory before you can select it from the Action Selection pull-down menu. It is run with superuser privileges. |
ii. Select the script from the Available Scripts pull-down menu.
 [ D ]
[ D ]
5. Complete this procedure with one of the following actions in the Attribute Editor:
Copyright © 2003, Sun Microsystems, Inc. All rights reserved.