About Troubleshooting Your System
The system provides the following features to help you identify and isolate hardware problems:
-
Error indications
-
Software commands
-
Diagnostic tools
This section describes the error indications and software commands provided to help you troubleshoot your system. Diagnostic tools are covered in "About Diagnostic Tools".
Error Indications
The system provides error indications via LEDs and error messages. Using the two in combination, you can isolate a problem to a particular field-replaceable unit (FRU) with a high degree of confidence.
The system provides fault LEDs in the following places:
-
Front panel
-
Keyboard
-
Power supplies
-
Disk drives
Error messages are logged in the /var/adm/messages file and are also displayed on the system console by the diagnostic tools.
Front Panel LEDs
Front panel LEDs provide your first indication if there is a problem with your system. Usually, a front panel LED is not the sole indication of a problem. Error messages and even other LEDs can help to isolate the problem further.
The front panel has a general fault indicator that lights whenever POST or OBDiag detects any kind of fault. It addition, it has LEDs that indicate problems with the internal disk drives, power supply subsystem, or fans. See "About the Status and Control Panel" for more information on these LEDs and their meanings.
Keyboard LEDs
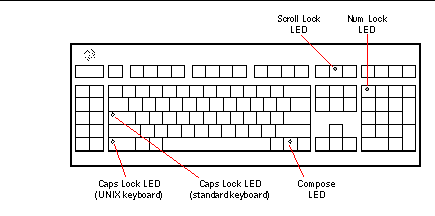
Four LEDs on the Sun Type-5 keyboard are used to indicate the progress and results of POST diagnostics. These LEDs are on the Caps Lock, Compose, Scroll Lock, and Num Lock keys, as shown below.
Figure 12-5

To indicate the beginning of POST diagnostics, the four LEDs briefly light all at once. The monitor screen remains blank, and the Caps Lock LED blinks for the duration of the testing.
If the system passes all POST diagnostic tests, all four LEDs light again and then go off. Once the system banner appears on the monitor screen, the keyboard LEDs assume their normal functions and should no longer be interpreted as diagnostic error indicators.
If the system fails any test, one or more LEDs will light to form an error code that indicates the nature of the problem.
Note -
The LED error code may be lit continuously, or for just a few seconds, so it is important to observe the LEDs closely while POST is running.
The following table provides error code definitions.
Table 12-5|
LED |
|
|||
|---|---|---|---|---|
|
Caps Lock |
Compose |
Scroll Lock |
Num Lock |
Failing FRU |
|
X |
|
|
|
Main logic Board |
|
|
X |
|
|
CPU 0 |
|
|
X |
|
X |
CPU 1 |
|
X |
|
|
X |
No memory detected |
|
X |
X |
|
|
Memory bank 0 |
|
X |
X |
|
X |
Memory bank 1 |
|
X |
X |
X |
|
Memory bank 2 |
|
X |
X |
X |
X |
Memory bank 3 |
|
|
|
|
X |
NVRAM |
Note -
The Caps Lock LED blinks on and off to indicate that the POST diagnostics are running. When it lights steadily, it indicates an error.
Power Supply LEDs
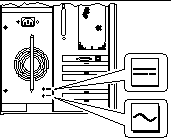
Power supply LEDs are visible from the rear of the system. The following figure shows the LEDs on the power supply in bay 0.
Figure 12-6

The following table provides a description of each LED.
Table 12-6|
LED Name |
Icon |
Description |
|---|---|---|
|
AC-Present-Status |
|
This green LED is lit to indicate that the primary circuit has power. When this LED is lit, the power supply is providing standby power to the system. |
|
DC Status |
|
This green LED is lit to indicate that all DC outputs from the power supply are functional. |
Disk LEDs
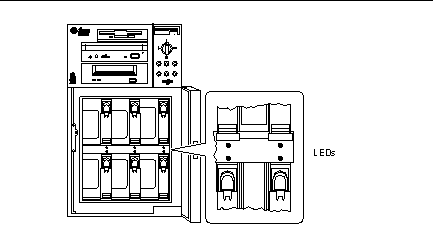
The disk LEDs are visible from the front of the system when the bottom door is open, as shown in the following figure.
Figure 12-7

When a disk LED lights steadily and is green, it indicates that the slot is populated and that the drive is receiving power. When an LED is green and blinking, it indicates that there is activity on the disk. Some applications may use the LED to indicate a fault on the disk drive. In this case, the LED changes color to yellow and remains lit. The disk drive LEDs retain their state even when the system is powered off.
Error Messages
Error messages and other system messages are saved in the file /var/adm/messages.
The two firmware-based diagnostic tools, POST and OBDiag, provide error messages either locally on the system console or remotely on an RSC console. These error messages can help to further refine your problem diagnosis. The amount of error information displayed in diagnostic messages is determined by the value of the OpenBoot PROM variable diag-verbosity. See "OBDiag Configuration Variables" for additional details.
Software Commands
System software provides Solaris and OBP commands that you can use to diagnose problems. For more information on Solaris commands, see the appropriate man pages. For additional information on OBP commands, see the OpenBoot 3.x Command Reference Manual. (An online version of the manual is included with the Solaris System Administrator AnswerBook that ships with Solaris software.)
Solaris prtdiag Command
The prtdiag command is a UNIX shell command used to display system configuration and diagnostic information. You can use the prtdiag command to display:
-
System configuration, including information about clock frequencies, CPUs, memory, and I/O card types
-
Diagnostic information
-
Failed field-replaceable units (FRUs)
% /usr/platform/sun4u/sbin/prtdiag
To isolate an intermittent failure, it may be helpful to maintain a prtdiag history log. Use prtdiag with the -l (log) option to send output to a log file in /var/adm.
Note -
Refer to the prtdiag man page for additional information.
An example of prtdiag output follows. The exact format of prtdiag output depends on which version of the Solaris operating environment is running on your system.
ok /usr/platform/sun4u/sbin/prtdiag -v
System Configuration:  Sun Microsystems  sun4u Sun Ultra Enterprise 250(2 X UltraSPARC-II 248MHz)
System clock frequency: 83 MHz
Memory size: 640 Megabytes

========================= CPUs ========================

Run   Ecache   CPU    CPU
Brd  CPU   Module   MHz     MB    Impl.   Mask
---  ---  -------  -----  ------  ------  ----
SYS     0     0      248     1.0   US-II    1.1
SYS     1     1      248     1.0   US-II    1.1

========================= Memory =========================

Interlv.  Socket   Size
Bank    Group     Name    (MB)  Status
----    -----    ------   ----  ------
  0      none     U0801    32      OK
  0      none     U0701    32      OK
  0      none     U1001    32      OK
  0      none     U0901    32      OK
  1      none     U0802    64      OK
  1      none     U0702    64      OK
  1      none     U1002    64      OK
  1      none     U0902    64      OK
  2      none     U0803    32      OK
  2      none     U0703    32      OK
  2      none     U1003    32      OK
  2      none     U0903    32      OK
  3      none     U0804    32      OK
  3      none     U0704    32      OK
  3      none     U1004    32      OK
  3      none     U0904    32      OK

========================= IO Cards =========================

Bus   Freq
Brd  Type  MHz   Slot  Name                              Model
---  ----  ----  ----  ------------------ ----------------------
SYS   PCI    33     0   SUNW,m64B                         ATY,GT-B
SYS   PCI    33     1   pciclass,078000
SYS   PCI    33     2   pciclass,078000
SYS   PCI    33     3   glm                               Symbios,53C875

No failures found in System
===========================

========================= Environmental Status =========================

System Temperatures (Celsius):
------------------------------
      CPU0    44
      CPU1    52
       MB0    32
       MB1    26
       PDB    26
      SCSI    24
=================================
Front Status Panel:
-------------------
Keyswitch position is in On mode.

System LED Status:  DISK ERROR      POWER
                      [OFF]         [ ON]
                POWER SUPPLY ERROR  ACTIVITY
                      [OFF]         [OFF]
                    GENERAL ERROR   THERMAL ERROR
                      [OFF]         [OFF]
=================================
Disk LED Status:	OK = GREEN	ERROR = YELLOW
		DISK  5:    [OK]	DISK  3:    [OK]	DISK  1:    [OK]
		DISK  4:    [OK]	DISK  2:    [OK]	DISK  0:    [OK]

=================================
Fan Bank :
----------

Bank      Speed     Status
         (0-255)
----      -----     ------
 SYS       140        OK

=================================

Power Supplies:
---------------

Supply     Status
------     ------
  0          OK

========================= HW Revisions =========================

ASIC Revisions:
---------------
STP2223BGA: Rev 4
STP2003QFP: Rev 1

System PROM revisions:
----------------------
  OBP 3.5.145 1997/10/15 14:50   POST 5.0.5 1997/10/09 16:52
OBP show-devs Command
If you are working from the OBP prompt (ok), you can use the OBP show-devs command to list the devices in the system configuration.
OBP printenv Command
Use the OBP printenv command to display the OpenBoot PROM configuration variables stored in the system NVRAM. The display includes the current values for these variables as well as the default values.
OBP probe-scsi and probe-scsi-all Commands
To diagnose problems with the SCSI subsystem, you can use the OBP probe-scsi and probe-scsi-all commands. Both commands require that you halt the system.
Note -
When it is not practical to halt the system, you can use SunVTS as an alternate method of testing the SCSI interfaces. See "About Diagnostic Tools" for more information.
The probe-scsi command transmits an inquiry command to all SCSI devices connected to the main logic board SCSI interfaces. This includes any tape or CD-ROM drive in the removable media assembly (RMA), any internal disk drive, and any device connected to the external SCSI connector on the system rear panel. For any SCSI device that is connected and active, its target address, unit number, device type, and manufacturer name are displayed.
The probe-scsi-all command transmits an inquiry command to all SCSI devices connected to the system SCSI host adapters, including any host adapters installed in PCI slots. The first identifier listed in the display is the SCSI host adapter address in the system device tree followed by the SCSI device identification data.
The first example that follows shows a probe-scsi output message. The second example shows a probe-scsi-all output message.
ok probe-scsi
This command may hang the system if a Stop-A or halt command
has been executed. Please type reset-all to reset the system
before executing this command.
Do you wish to continue? (y/n) n
ok reset-all

ok probe-scsi
Primary UltraSCSI bus:
Target 0
  Unit 0   Disk     SEAGATE ST34371W SUN4.2G3862
Target 4
  Unit 0   Removable Tape     ARCHIVE Python 02635-XXX5962
Target 6
  Unit 0   Removable Read Only device TOSHIBA XM5701TASUN12XCD0997
Target 9
  Unit 0   Disk     SEAGATE ST34371W SUN4.2G7462
Target b
  Unit 0   Disk     SEAGATE ST34371W SUN4.2G7462
ok
ok probe-scsi-all
This command may hang the system if a Stop-A or halt command
has been executed. Please type reset-all to reset the system
before executing this command.
Do you wish to continue? (y/n) y

/pci@1f,4000/scsi@4,1
Target 2
  Unit 0   Disk     SEAGATE ST32550W SUN2.1G0418
Target 3
  Unit 0   Disk     SEAGATE ST32550W SUN2.1G0418
Target 4
  Unit 0   Disk     SEAGATE ST32550W SUN2.1G0418
Target 5
  Unit 0   Disk     SEAGATE ST32550W SUN2.1G0418
Target 8
  Unit 0   Disk     SEAGATE ST32550W SUN2.1G0418
Target 9
  Unit 0   Disk     SEAGATE ST32550W SUN2.1G0418
Target a
  Unit 0   Disk     SEAGATE ST32550W SUN2.1G0418
Target b
  Unit 0   Disk     SEAGATE ST32550W SUN2.1G0418
Target c
  Unit 0   Disk     SEAGATE ST32550W SUN2.1G0418
Target d
  Unit 0   Disk     SEAGATE ST32550W SUN2.1G0418
Target e
  Unit 0   Disk     SEAGATE ST32550W SUN2.1G0418
Target f
  Unit 0   Disk     SEAGATE ST32550W SUN2.1G0418

/pci@1f,4000/scsi@4
Target 2
  Unit 0   Disk     SEAGATE ST32550W SUN2.1G0416
Target 3
  Unit 0   Disk     SEAGATE ST32550W SUN2.1G0416
Target 4
  Unit 0   Disk     SEAGATE ST32550W SUN2.1G0416
Target 5
  Unit 0   Disk     SEAGATE ST32430W SUN2.1G0666
Target 8
  Unit 0   Disk     SEAGATE ST32550W SUN2.1G0416
probe-scsi-all output continued:
Target 9
  Unit 0   Disk     SEAGATE ST32550W SUN2.1G0416
Target a
  Unit 0   Disk     SEAGATE ST32550W SUN2.1G0418
Target b
  Unit 0   Disk     SEAGATE ST32550W SUN2.1G0418
Target c
  Unit 0   Disk     SEAGATE ST32550W SUN2.1G0418
Target d
  Unit 0   Disk     SEAGATE ST32550W SUN2.1G0418
Target e
  Unit 0   Disk     SEAGATE ST32550W SUN2.1G0418
Target f
  Unit 0   Disk     SEAGATE ST32550W SUN2.1G0418

/pci@1f,4000/scsi@3,1

/pci@1f,4000/scsi@3
Target 0
  Unit 0   Disk     SEAGATE ST34371W SUN4.2G3862
Target 4
  Unit 0   Removable Tape     ARCHIVE Python 02635-XXX5962
Target 6
  Unit 0   Removable Read Only device TOSHIBA XM5701TASUN12XCD0997
Target 9
  Unit 0   Disk     SEAGATE ST34371W SUN4.2G7462
Target b
  Unit 0   Disk     SEAGATE ST34371W SUN4.2G7462

/pci@1f,4000/pci@5/SUNW,isptwo@4
Target 1
  Unit 0   Disk     SEAGATE ST34371W SUN4.2G8246
Target 2
  Unit 0   Disk     SEAGATE ST34371W SUN4.2G8254
Target 3
  Unit 0   Disk     SEAGATE ST34371W SUN4.2G8246
Target 4
  Unit 0   Disk     SEAGATE ST34371W SUN4.2G8246
Target 5
  Unit 0   Disk     SEAGATE ST34371W SUN4.2G7462
Target 6
  Unit 0   Disk     SEAGATE ST34371W SUN4.2G7462
- © 2010, Oracle Corporation and/or its affiliates
