 How To Monitor Servers
Steps
-
Click Monitor on the navigation bar and select the desired farm.
The Monitor screen appears.
-
Right-click the Server element and select Monitor.
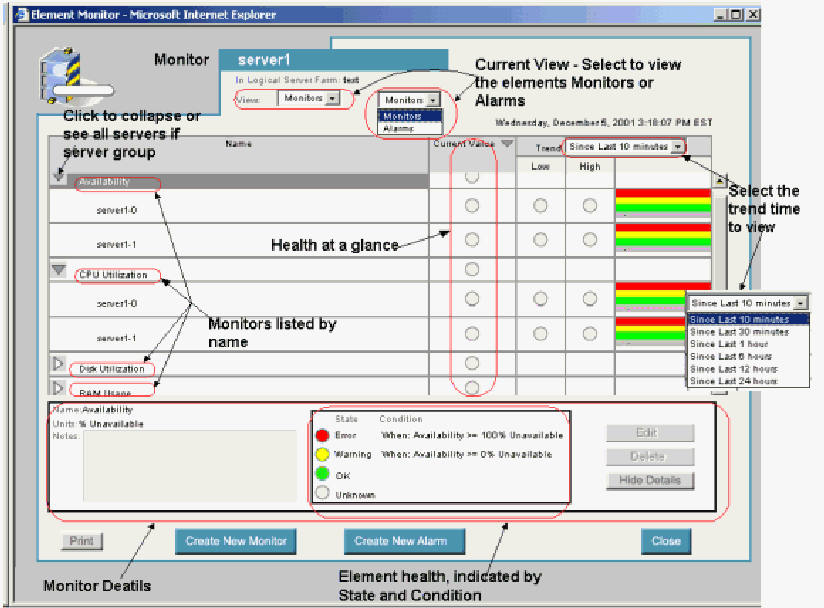
The Monitor Server screen appears.
Figure 4–10 Monitor Server Screen

-
Select the desired view from the View drop-down list.
In this example, Monitors is selected. Note that using Alarms is similar to using the Monitoring screens.
To view Alarms, select Alarms in the field View, then select the alarm from the list of alarms and click Show Detail button to see the alarm details.
-
Click the right-arrow button next to an alarm or monitor to highlight the monitor or alarm.
-
Click the Show Detail button to display the monitor or alarm details.
-
Click on the graph column next to the Low/High columns to view a graph that indicates the monitors that are set up, for example, CPU Utilization.
-
To see detailed information about another monitor, double-click the monitor under Name.
For example, double-click Disk Utilization, RAM Usage, and SWAP Memory Usage. You can also double-click Hide Details and Show Details to close and open the detailed information.
Note –In view monitor screen, you cannot create, edit or delete monitors or alarms.
-
Click the Close button to close the Monitor or Alarm screen.
- © 2010, Oracle Corporation and/or its affiliates
