Monitoring Active Farms
Monitoring is the mechanism used to ensure that the elements associated with the farms are behaving as expected. This section describes how to setup monitors.
Every element in the farm is monitored to ensure network connectivity of the device. In addition, servers contain a special monitoring agent that enables you to configure monitoring beyond that of basic network connectivity. With monitoring you can do the following activities:
-
View real-time availability status of farm devices.
-
Configure optional server monitors to measure CPU, disk, physical, and logical memory.
-
Set thresholds that tell the system when to display and issue warnings and errors.
-
Create user notification lists so the system can alert individuals of warnings and errors.
Note –For information about accessing monitoring data using an SNMP connection, see Forwarding Messages to an NMS in N1 Provisioning Server 3.1, Blades Edition, System Administration Guide.
Monitoring Availability of Farm Elements
The Control Center automatically sets up an availability monitor for each element in an active farm. The availability monitor checks the availability of a machine and informs whether the machine is up. The availability monitor cannot be modified or deleted.
Monitoring Servers
The availability monitor indicates that the server is available when the monitoring agent is running and that the server's primary interface responds to ping.
You may configure an alarm for the availability monitor if you wish to be notified of state changes. There is a maximum of two minutes lag time from the time the machine goes up or down to the time when the Control Center is notified.
Note –
Any monitor deployed to a server group is automatically applied to each server in the group.
Monitoring Load Balancers
The availability monitor indicates that the load balancer is up when the primary interface responds to ping.
You cannot configure monitors or alarms for load balancers. Availability monitors are automatically set up for load balancers which appear as red or green indicating the current status.
Monitor Option Buttons
To access the Monitor screen, click Monitor on the Navigation Bar.
The Monitor option buttons located at the left-hand side of the Monitor screen enable you to perform various monitoring-related tasks. The User Groups and Contact Methods buttons are displayed only if you have Account Manager privileges. The Monitor option buttons are described in the following table:
Table 4–2 Monitor Screen Buttons
Setting Up Element Monitors and Alarms
To set up element monitors and alarms, you must set up the conditions to monitor the alarms. The monitors setup for the element applies to the entire server group, if applicable. You can monitor the following activities:
-
CPU Usage–the percent of CPU being used or an average for machines with multiple CPUs.
-
Bandwidth Utilization–the percent of bandwidth in use.
In addition, each monitor can be configured to record monitoring information at an interval that you specify. The interval must be a multiple of five minutes.
 How To Set Up Monitors
Steps
-
Right-click the server element, and choose Monitor
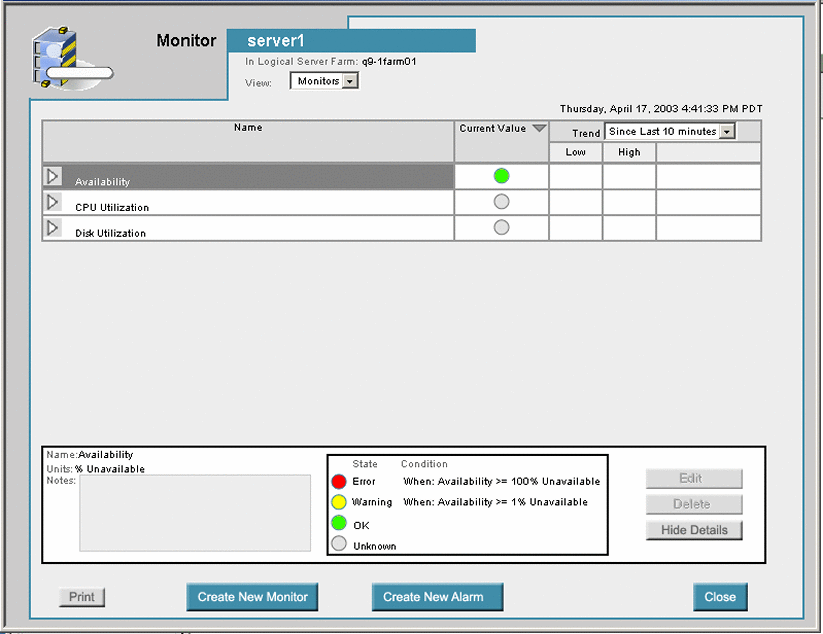
The Monitor Server screen appears.
Figure 4–7 Monitor Server - Default Availability

-
Click Create New Monitor
The Create Element Monitor dialog box appears.
-
Select the desired item to monitor from the Monitor drop-down list.
The variable name in the Condition column, is highlighted in red text when you position the cursor inside a threshold box.
The variable name turns red to bring your attention to the fact that you have not provided the required value. The variable switches back to the original color after you return the cursor to the threshold box to input the required value.
-
Click the Interval up and down arrow button to change the monitor interval.
You may add or remove monitor status updates in a fixed five minute update interval.
-
Type the desired percentage in the field provided for a warning variable state. Type a value between zero and 100.
-
Type the desired percentage in the field provided for an error condition state. Type a value greater than or equal to the value set in Step 6.
-
Type any related notes in the Notes field.
-
Click the OK Button to save your changes.
-
(Optional) Repeat steps 4 through 7 to configure additional element monitors.
Note –You cannot deploy two monitors of the same type, for example, CPU, on the same server.
-
Click the Apply button to apply your changes.
-
Click the Close button.
The Create Element Monitor dialog box is closed.
Note –All servers in a server group receive the same monitors automatically.
-
Click the Commit Changes button on the Monitoring screen.
The element monitors are applied to the active farm.
 Caution –
 Complete all element monitor configuration changes for a farm before you click the Commit Changes button to limit overhead processing.
-
Click OK to confirm the request.
 How To Set Up Element Alarms
Alarms enable you to have the Control Center contact a group or several groups when a threshold is exceeded on a monitor. Before you can create a new alarm, you must define Contact Methods for the account user groups. See Setting Up Contact Methods in Chapter 8 Managing Accounts.
Steps
-
Click Monitor on the Navigation bar and select the desired farm.
The Monitor screen appears.
-
Right-click the server element and choose Monitor.
The Monitor Server screen appears.
-
From the Monitor Server screen, click the Create New Alarm button.
The Create New Alarm dialog box appears.
-
Type a name for the alarm.
-
Click OK to save the alarm name.
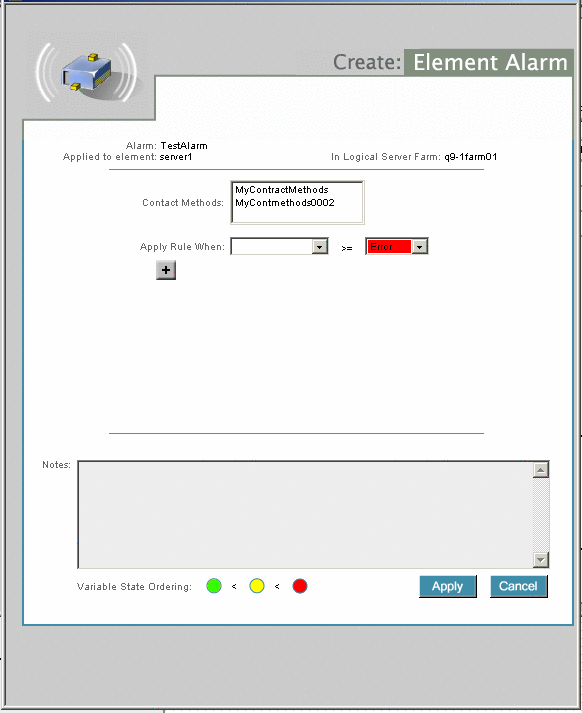
The Create Element Alarm dialog box appears.
Figure 4–8 Create Element Alarm

-
Set up the newly created element alarm as shown in Figure 4–8.
-
Select a contact method from the Contact Methods list.
This method is used when an alarm condition occurs. See Setting Up Contact Methods.
-
Select the desired alarm from the Apply Rule When drop-down list.
See How To Set Up Monitors for procedural information about defining rule conditions.
-
Select either Error or Warning from the drop-down list to the right of the Apply Rule When drop-down list.
-
Click the + button to add an alarm condition, if appropriate.
-
Click the Apply button to save your changes.
-
If you configured multiple items, click Save Changes to save all Monitor changes.
-
Click the Commit Changes button to initiate a farm request for creation of the alarm.
 Caution –
 Changes cannot take effect until after you click the Commit Changes button on the main Monitor screen.
Editing Monitors and Alarms
Configured monitors and alarms can be edited in the Configure Monitor dialog or the Configure Alarm dialog. Both are reached through the Monitor Window. The procedure is similar for both monitors and alarms.
 How To Edit an Existing Monitor or
Alarm
Steps
-
Click Monitor on the navigation bar and select the desired farm from the list.
The Monitor screen appears.
-
Right-click the server element and choose Monitor.
The Monitor Server screen appears.
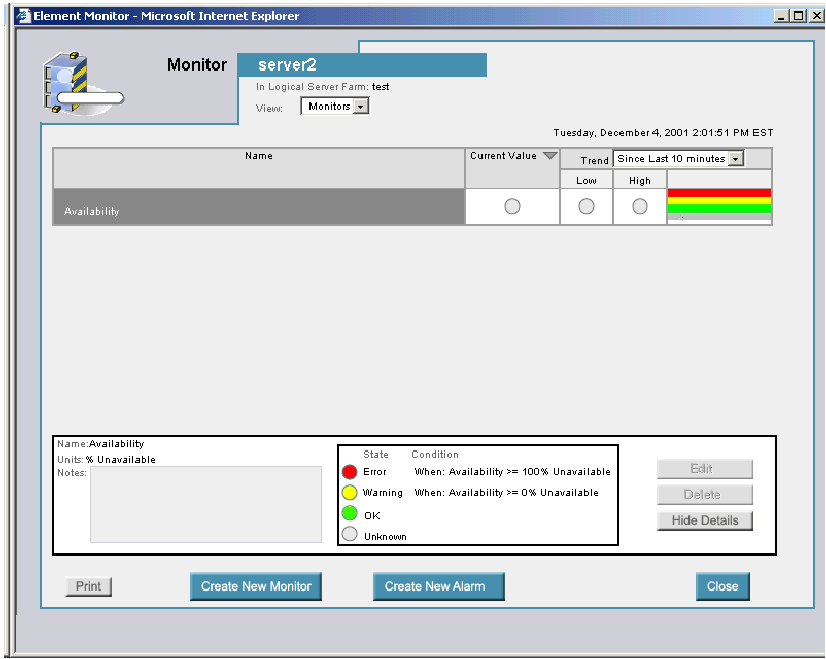
Figure 4–9 Monitor Server

The names of currently configured monitors appear listed in the table by name.
-
Select the monitor or alarm to edit.
In the table of monitors click the right-arrow button button at the left-hand side of the monitor name to expand the view for that monitor. Each element configured for that monitor appears as a line item. Click the down-arrow button to collapse the list.
-
Double-click the monitor or alarms name.
-
On the right-hand side of the Monitor Details area, click the Edit button.

The Configure Element Monitor dialog box or the Configure Element Alarm dialog box appears depending on whether you selected a monitor or an alarm.
-
Make the changes as needed.
See How To Set Up Element Alarms and How To Set Up Element Alarms.
-
Click the Apply button to record your changes.
You are returned to the Monitor Window.
-
Click the Close button to return to the main Monitor page.
-
Click the Commit Changes button to save your changes.
 Caution –
 Changes cannot take effect until after you click the Commit Changes button on the main Monitor.
Using the Monitors
Use the Monitor screen to view the current status of the devices in an active farm. Aggregated monitors for a server group display by default. These monitors display Disk Utilization, CPU Utilization, RAM Usage, and SWAP Memory Usage. To view monitoring information of the individual servers, click on the server. Each monitor displays the current state and historical data. Low and high values for the time period specified in the drop-down list also appear. Only the current state is displayed for aggregated monitors.
 How To Monitor Servers
Steps
-
Click Monitor on the navigation bar and select the desired farm.
The Monitor screen appears.
-
Right-click the Server element and select Monitor.
The Monitor Server screen appears.
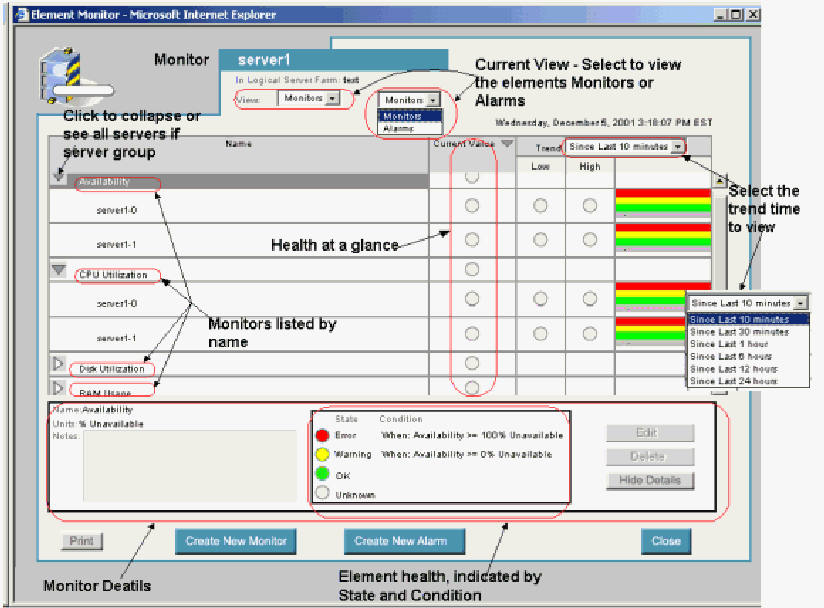
Figure 4–10 Monitor Server Screen

-
Select the desired view from the View drop-down list.
In this example, Monitors is selected. Note that using Alarms is similar to using the Monitoring screens.
To view Alarms, select Alarms in the field View, then select the alarm from the list of alarms and click Show Detail button to see the alarm details.
-
Click the right-arrow button next to an alarm or monitor to highlight the monitor or alarm.
-
Click the Show Detail button to display the monitor or alarm details.
-
Click on the graph column next to the Low/High columns to view a graph that indicates the monitors that are set up, for example, CPU Utilization.
-
To see detailed information about another monitor, double-click the monitor under Name.
For example, double-click Disk Utilization, RAM Usage, and SWAP Memory Usage. You can also double-click Hide Details and Show Details to close and open the detailed information.
Note –In view monitor screen, you cannot create, edit or delete monitors or alarms.
-
Click the Close button to close the Monitor or Alarm screen.
Unresponsive Servers
If the server becomes unresponsive for any reason, the performance monitors for CPU, disk, and memory change to unknown or gray. The availability monitor for the device turns red to indicate a failure.
After the problem has been addressed and the device is available again, you must click Commit in order to restart the monitors. SeeChapter 7, Troubleshooting in N1 Provisioning Server 3.1, Blades Edition, System Administration Guide for more information on failure recovery.
- © 2010, Oracle Corporation and/or its affiliates
