Chapter 4 Building, Updating, and Monitoring Server Farms
This chapter describes how to create, update, and monitor a server farm using the Control Center. This chapter contains the following topics.
A server farm is a visual representation of your network topology. To create a new farm, use the Editor screen as described in the procedures in this chapter. See Editor Screen for details about menus and the element palette.
Designing and Editing Server Farms
You build a farm by using the Editor screen. The Editor provides a drag-and-drop interface with a palette of elements that represent components of a network . The palette includes icons for the following network components.
-
External Subnet
-
Internal Subnet
-
Server
-
Load Balancer
-
Ethernet Port
-
Firewall element is disabled
Note –The Control Center cannot be used to configure Firewalls. See Configuring Unmanaged Devices for information about using the Ethernet Port Element to represent unmanaged devices such as firewalls.
Designing a New Farm
To design a new farm, you use the farm element palette on the Editor screen. See Figure 2–8. For instructions on navigating the Editor screen, refer to Chapter 2, Control Center Application Overview.
 How To Design a New
Farm
Steps
-
Login to the Control Center as Administrator or User. If logged in as User, proceed to Step 3.
-
Click Editor on the Navigation Bar and proceed to Step 4.
The Editor screen appears.
-
Click the New button and proceed to Step 5.
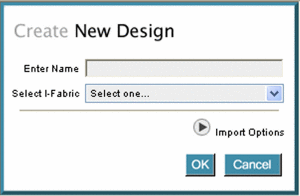
The Create New Design dialog box appears.
-
To create a new farm design, choose New from the File menu.
The Create New Design dialog box appears.
-
Type the farm name in the Enter Name field.
The name becomes part of your domain name. For example, farmname.accountname.ifabricname.yourorgname.com
Note –The farm name must conform to DNS naming conventions. See DNS Naming Conventions and Farm Naming Conventions in the Control Center
-
Select an I-Fabric from the drop-down list.
I-Fabrics are named during installation.
-
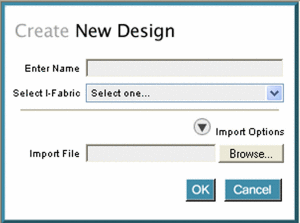
(Optional) Click the Import Options button and type a file name to import.
-
Click OK to close the Create New Design dialog box.
The Editor screen is displayed.
-
Drag elements from the palette onto the Editor.
-
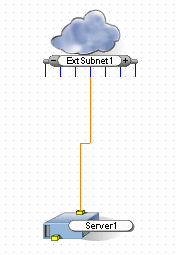
Click the port on the element to initiate a connection.
The selected port is highlighted in green if the port is available.
-
Move the pointer over the element port to which you want to complete a connection.
The wire connector appears in red.
-
Click the second port to complete the connection.
The connection represents the allocation of an IP address from the subnet to the device. See Connecting Farm Elements for a description of elements and rules for port connections.
See Also
Designing and Assembling Elements for the Farm
Assemble your farm by dragging elements from the palette onto the Editor and then connect, or wire the elements together. See How To Design a New Farm for procedural information about using the element palette.
More About the Elements
Elements in the Control Center represent network components. Right-click an element to display the following menu options.
-
Configure - Displays the configuration dialog box for the element.
-
View Configuration - Displays the element configuration.
-
Delete - Deletes the element from the farm.
-
Snapshot- Displays the Snapshot dialog box for the element.
Note –This menu option appears for a Load Balancer or Server element after the farm is activated.
 How To
Edit Existing Farms
Steps
-
Login to the Control Center as Administrator.
-
Click Editor on the Navigation bar.
The drop-down list of existing farms appears.
-
Select an existing farm from the Editor drop-down list.
The farm topology appears in the Editor screen.

Connecting Farm Elements
Connect the farm elements to design network topologies. Consider the following general rules when connecting farm elements:
-
Each hardware element must include one or more physical ports.
-
A hardware element must be connected to a network element (external and internal subnets) and vice-versa.
-
Ports are highlighted in green whenever a wiring connection can be initiated and completed at that port.
The section below provides additional wiring rules for each farm element.
Farm Element Wiring Rules
This section describes elements and rules for wiring elements in your farm. Consider the following information when connecting elements in the Control Center.
-
External Subnet. Represents the external, publicly addressable sub network. Public IP addresses are allocated during activation. All allocated IP addresses are visible externally on the Internet. The maximum number of IP addresses on the external subnet connection is 2048. Six IP addresses are reserved. The default number is 16 in the Control Center. If more wiring connections are needed, click the + symbol to add connections to the Subnet. See How To Configure the External Subnet and How To Add a VLAN Configuration for configuration instructions.
-
Internal Subnet. Represents a private sub network within the farm. IP addresses are allocated during activation. Allocated IP addresses are private and visible internally only. All internal subnets have a fixed mask length of 24 (a netmask of 255.255.255.0). The internal subnets can have a maximum of 253 devices connected to them. Although a 24 mask length has a capacity of 256 IP addresses, three addresses are reserved. Multiple subnets may be configured within the same VLAN. If more wiring connections are needed, click the + symbol to add connections to the Subnet . See Configuring the Subnet for configuration instructions.
-
Server. Represents a server or a server group. The upper interface is the eth0 interface. A connection to the upper port (eth0) is required. The primary ports (eth0 and eth1) cannot be deleted from the server group. The VLAN of the subnet to which primary ports are connected is the native VLAN for the primary port. See Configuring Servers and Server Groups. Virtual interfaces may be added to servers or server groups. You may configure up to 16 virtual interfaces for each primary port on a server. See Configuring Virtual Interfaces.
-
Load Balancer. Represents a load balancer. Balances traffic sent to a virtual interface and redirects the traffic to a real interface to spread large amounts of traffic over multiple servers. The upper port (eth0) is the virtual interface. The lower port is eth1. A connection to the lower port (eth1) is optional. The yellow port represents VIPs. The green port represents a management interface. One green port appears for each physical interface on the load balancer. The load balancer may balance traffic to any devices that have at least one interface on the same subnet as one of the management interfaces. Additional VIPs may be added by using the Configure Load Balancer dialog box. See How To Configure the Load Balancer andHow To Configure a Load Balancer in Path Failover Mode for procedural instructions.
-
Ethernet Port. The Ethernet Port element represents connectivity to a device that is not under direct management of the Control Center software. Use the Ethernet Port element to connect to gateway devices, management networks, or devices that are not supported by the software. You might use the Ethernet Port element to represent VPNs, backhaul routers, backup networks, monitoring networks, or firewalls. A connection to the port (eth0) is required. See Configuring Unmanaged Devices for procedural information.
Using Configuration Dialogs
Configure farm elements by using the Editor screen. Double-click an element to display the configuration dialog box. The following table describes the common configuration dialog boxes. Fields that are specific to configuring an element are described along with an explanation on how to configure the individual farm elements.
Table 4–1 Common Configuration Dialog Box Fields|
Field Name |
Description |
|---|---|
|
Name |
Identifies the element in the farm editor. Element names must be unique in a farm and be valid DNS names. See DNS Naming Conventions and Farm Naming Conventions in the Control Center |
|
Def. Gateway |
Sets an IP address as the default gateway for the device on one of the local subnets depending upon the value you select from the drop-down list. The Def. Gateway field is available in the Server Group and Load Balancer configuration dialog boxes. |
|
Notes |
Notes and shared information about the element with other users in the same account. You may edit notes during and of the farm lifecycle states. |
|
OK |
Applies the changes made to the element and closes the configuration dialog box. |
|
Cancel |
Closes the configuration dialog box and discards any changes. |
Importing and Exporting Farms
Importing and Exporting Farms
This section includes procedures for importing and exporting farms by using the File menu in the Editor screen. Farms are exported using Farm Export Markup Language (FEML). FEML represents the logical server farm and describes the network and configuration topology for physical resources associated with a logical server farm. FEML differs from FML because it is readable by a browser. Sample FEML farms are installed in a standard location and may be accessed at http://server:port/tcc/sample.jsp for use in the Control Center.
 How To Export
a Farm
Steps
-
Click Editor on the Navigation bar and select and existing farm from the list.
-
Choose Export from the File menu.
The Farm Export dialog box appears.
-
Type the name for the exported file in the Name field.
Note –The exported FEML may be saved with any file name and extension.
-
Select the location for the exported farm, or click the Browse button to find a location.
-
Click the OK button.
The current farm FEML is exported to the selected location.
 Caution –
 Do not modify the exported FEML manually. Manual modification of FEML might prevent successful import.
See Also
 How To Import
a Farm
Steps
-
Navigate to the Control Center Editor.
-
Choose Import Farm from the File menu.
The Create New Design dialog box appears.
-
Type the farm name in the Enter Name field.
The name becomes part of your domain name. For example, farmname.accountname.ifabricname.yourorgname.com
Note –The farm name must conform to DNS naming conventions. See DNS Naming Conventions and Farm Naming Conventions in the Control Center
-
Select an I-Fabric from the drop-down list.
I-Fabrics are named during installation.
-
Click the Import Options button and type the location of the farm to import or click the Browse button to find the location.

-
Click the OK button.
The farm is imported into the Control Center and appears in the Editor screen.
Note –If devices that are configured in the farm are unavailable in the I-Fabric to which the farm is imported, an error message appears. Unavailable devices are highlighted in red text to indicate that reconfiguration must be completed before submitting the imported farm for activation.
See Also
 How To Download
Sample Farms
Steps
-
Type the following URL in the browser's address field to access the download sample farms page.
http://server:port/tcc/sample.jsp
-
Click the filename to download the desired sample farm.
Note –To determine the appropriate sample farm, read the descriptions provided in the right column of the Download Sample Farms table. A sample farm configured for a dual switch should only be used if your I-Fabric includes a dual switch device.
-
Type the location where you would like to save the file.
-
Note the location where you saved the file for future reference.
-
Click the OK button to close the Save dialog box.
-
To import the sample farm, see How To Import a Farm.
Configuring Servers and Virtual Interfaces
Configuring Servers and Server Groups
This section describes general information about server storage and configuration tasks.
Servers that have local disks physically connect by using SCSI or IDE interfaces. In order to activate and deploy a server, you need to configure at least one boot volume with a bootable OS image on the volume. The disk volume must be equal to or greater than the size of the image. Consider the following when configuring servers and server groups.
-
If you configure the server incorrectly, an error message appears advising you to change the configuration.
-
The server names and IP addresses are listed. If the IP address is not available, because it has not been assigned yet, it displays: not assigned.
-
In Active state, a warning is issued when changing images or when adding and removing a disk volume because the server needs to be shut down.
When managing an active server group and applying a new disk image, the selected image is applied to each server in the server group. This process causes down time because all the servers will reboot.
Each server interface typically connects to a different subnet. If the interfaces connect to the same subnet, you need to thoroughly understand how the operating system handles this situation. Connect one or both interfaces depending upon your requirement. For example, connect the web server to a front-end subnet and the database server to a back-end subnet for added security. Use the server group mechanism to group servers or not depending on your requirements. You have more control with individual servers, but easier management with server groups.
After the farm is Active, you can perform the following tasks:
-
Create software images that include applications and data.
-
Create server groups or grow a server group (multiple, identical servers).
-
If your storage type allows, add storage volumes. Disk size depends upon the storage type you select from the drop-down list.
 How To Configure Servers
Steps
-
From the Editor screen, double-click the Server element.
The Configure Server dialog box appears.
-
In the Name field, type a new name that conforms to DNS naming conventions.
-
Select a device type from the Type drop-down list.
-
Select an default gateway from the Def. Gateway drop-down list.
-
Accept the default value (1) for the Server field if appropriate.
The value indicates the desired number of servers.
-
Type any relevant notes or comments in the Notes field.
-
Click the appropriate Storage tab.
The following columns describe the available storage.
-
Boot indicates if the local disk is bootable.
-
Channel indicates the channel ID for the local disk. Most disks have two channels (0 and 1) and can support two disks (Master and Slave).
-
Disk indicates whether the disk is a Master or Slave disk.
-
Size indicates the disk sizes that have been configured.
-
-
Click the Select button to select an image.
-
Click the OK button.
The Configure Server dialog box is closed.
See Also
 How To Create a Group of Servers
Server groups are defined as a set of servers that share a common function. For example, web servers might be grouped to simplify maintenance and manipulation of multiple individual servers. Server groups allow a number of identical servers to be managed as a single entity. All servers in a server group are considered identical and start off with the same images. Use the following procedure to create a server group by using the Editor screen.
Note –
Any monitor deployed to a server group is automatically applied to each server in the group.
Steps
-
Double-click the Server element from the Editor screen.
The Configure Server dialog box appears.
-
Type the desired number of servers in the Server field.
Note –The gray area now has a scroll bar to allow you to view all the servers you added. The eth0: IP Address and eth1: IP Addresses are assigned after the farm becomes Active.
-
To add an image to the new disk, click the Select button.
The Select Disk Image dialog box appears.
-
Select an appropriate image from the list.
-
Click OK to exit the Select Disk Image dialog box.
A warning message appears indicating the server will be shut down to apply the new image.
-
Click the OK button to apply the new disk image.
-
Click the OK button to save and exit the Configure Server dialog box.
The Server element changes to represent a group of servers.
See Also
How To Use an Account Software Image
Configuring Virtual Interfaces
This section describes virtual interface configuration. You may configure up to 16 virtual interface groups for every primary port on a server. The primary ports (ports like eth0/eth1 as opposed to eth0:2) cannot be deleted or changed. The primary ports have DNS names and they might be the primary interface of the device. IP addresses are allocated and displayed for all connected interfaces. Allocate IP addresses on a particular subnet on a server by drawing a wire from a subnet to the interface connection point. In order to submit the farm, all servers must have their eth0 interface allocated. Additionally, if any virtual interface on a primary port is allocated, the primary interface must also be allocated.
The following procedure describes configuration of virtual ports by using the Editor screen in the Control Center.
 How To Configure
Virtual Interfaces
Steps
-
Double click the element to which you will add a virtual interface.
The Configure dialog box appears.
-
Click the + button in the Virtual Interfaces area of the screen.
A virtual port is added to the element such as eth0:1 or eth1:1.
Note –You may add up to 16 virtual ports per physical (real) port.
-
Click OK/Apply.
The Configure screen is closed.
-
Choose Save from the File menu.
The virtual port configuration is saved.
See Also
Configuring Subnets and VLANs
Configuring the Subnet
The subnet IP addresses and mask are assigned after the farm is Active. See Connecting Farm Elements for details about IP addresses and net mask assignments. Consider the following when using the Configure Subnet dialog box.
-
The Subnet IP is the base IP address for elements on this subnet. The IP addresses are assigned when the farm is in the activated.
-
The Mask is the net mask that is applied to elements on this subnet and is assigned when the farm is activated.
-
VLAN shows the VLAN that is automatically or manually assigned.
Note –The VLAN name list is maintained in the Configure: VLANs dialog box and the individual subnet and VLAN associations are made in the Configure Subnet dialog box. Refer to Configuring a VLAN Manually for details on how to manually configure a VLAN.
The following procedure describes configuration of the subnet by using the Editor screen.
 How To Configure the Internal Subnet
Steps
-
Double-click the Internal Subnet element.
The Configure Subnet dialog box appears.
-
Type the name of the Internal Subnet in the Name field.
-
Type notes or comments into the Notes field.
-
(Optional) Click the Add Host Name button to reserve a name for the IP.
-
Type the DNS name in the field provided.
This DNS name specifies the corresponding DNS prefix for each IP address that you reserve.
-
Click OK to save your changes.
The Configure Subnet dialog box is closed.
See Also
 How To Configure the External Subnet
An External Subnet enables you to specify the number of externally facing IP addresses for the Internet or external network. The maximum number of IP addresses on the external subnet connection is 2048. The default number is 16 in the Control Center. When configuring an external subnet, you need to allocate a minimum of six IP addresses.
A farm usually has only one external subnet in its topology. In some cases, adding a second external subnet would offer a benefit to the farm, such as:
-
Creating more external IPs by using noncontiguous blocks of free IP addresses.
-
Adding elements with external access that need to be on different subnets.
The following procedure describes how to use the Editor screen to configure an external subnet.
Steps
-
Double-click the External Subnet element.
The Configure External Subnet dialog box appears. The Subnet IP field displays the network address for this subnet. The Subnet IP is assigned when the farm is activated.
-
Type the name in the Name field.
-
In the Mask field, select a subnet mask.
MASK is the net mask that is applied to elements on this external subnet.
-
Type notes or comments in the Notes field.
-
(Optional) Click the Add Host Name button to reserve a name for the IP.
-
Type the DNS name in the field provided.
This DNS name specifies the corresponding DNS prefix for each IP address that you reserve. SeeDNS Naming Conventions
-
Click OK to save your changes.
The Configure External Subnet dialog box is closed.
See Also
See Connecting Farm Elements for netmask assignments
Configuring a VLAN Manually
By default, VLANs in a farm are configured automatically. However, you may choose to configure VLANs manually. You may perform the following management activities by using the Configure VLANs dialog box.
-
Create VLANs
-
Delete VLANS
-
Update VLANs
-
Display the list of subnets that are members of a VLAN
-
Associate a color with each separate VLAN
The names given to VLANs are used as an identifier to enable the configuration of a VLAN zones, such as a management VLAN, in the Control Center. The assigned names do not correlate to the actual VLAN names that are configured in the switch upon activation of the farm. Actual switch VLANs are allocated according to availability during the farm activation based on the VLAN zones specified in the Control Center.
Create VLAN types by associating multiple subnets with the same VLAN name. The VLAN names that you define in the Configure VLANs dialog box are displayed in the Configure Subnet dialog box for each associated subnet. Define the VLAN name list in the Configure VLANs dialog box and associate subnets with a VLAN name by using the Configure Subnet dialog box.
 How To Add a VLAN Configuration
Steps
-
In the Editor screen, choose Configure VLANs from the Edit menu.
A message describing automatic VLAN configuration appears.
-
Select Manually from the Configure VLANs drop-down list.
The Configure VLANs dialog box appears.
-
Select a VLAN from the Current VLANs list.
The name, wire color, and included subnets display in the right pane.
-
Add new VLAN information and click the Create VLAN button.
For load balancing, change the subnet on which the data IP resides to be in the data VLAN.
-
Click OK.
The new VLAN information is applied and the Configure VLANs dialog box is closed.
Note –If you add or delete a VLAN, you must update the appropriate subnet configuration to associate the subnet with the correct VLAN. If you delete a VLAN and do not associate the subnet configuration with another VLAN, an error message is printed.
See Also
 How To Delete
a VLAN Configuration
Steps
-
In the Editor screen, choose Configure VLANs from the Edit menu.
A message describing automatic VLAN configuration appears.
-
Select Manually from the Configure VLANs drop-down list.
The Configure VLANs dialog box appears.
-
Select a VLAN from the Current VLANs list.
The name, wire color, and included subnets display in the right pane.
-
To delete a VLAN, select the name in the Current VLANs list and click the Delete VLAN button.
-
Click OK.
The VLAN information is deleted and the Configure VLANs dialog box is closed.
Note –If you add or delete a VLAN, you must update the appropriate subnet configuration to associate the subnet with the correct VLAN. If you delete a VLAN and do not associate the subnet configuration with another VLAN, an error message is printed.
Configuring the Ethernet Port for Unmanaged Devices
Configuring Unmanaged Devices
The Ethernet Port represents connectivity between a farm and unmanaged devices external to an I-Fabric. Adding an Ethernet Port to your farm design is one step in connecting a device that cannot be configured and managed with the software.
After a farm is activated, the device must be physically connected to the provisioned switch port.
Ethernet Port Best Practices
If you are using the Ethernet Port to indicate connectivity to a back channel network connection, do the following tasks:
-
Read the following information about unmanaged devices in Adding and Removing Unmanaged Ethernet Devices in N1 Provisioning Server 3.1, Blades Edition, System Administration Guide.
-
Place the Ethernet Port in a location within the farm that gives you the easiest access to the critical servers.
-
Keep in mind how much access you are opening up between the farm and your organization, and apply restrictions where appropriate.
Configuring the Ethernet Port Element for Unmanaged Devices
In the Control Center, you cannot perform the following tasks for unmanaged devices:
-
Configuring the device
-
Powering on the device
-
Powering off the device
You can perform these tasks for unmanaged devices:
-
Connect the unmanaged device to your I-Fabric
-
Make visible the type and number of interfaces, if applicable, of the unmanaged device.
You must connect the unmanaged device manually before activating a farm that uses the unmanaged device. The following procedure describes configuration of the Ethernet Port by using the Editor screen in the Control Center.
Using the Unknown Device Type
If you select the device type “Unknown Device”, consider the following information.
-
This is the type used for an Ethernet Port element that is upgraded from N1 Provisioning Server 3.0.
-
Control Center Resource checking will not be performed for this type of device
 How To Configure the Ethernet Port Element
Steps
-
Perform the following command-line procedure. To Add an Unmanaged Ethernet Device in N1 Provisioning Server 3.1, Blades Edition, System Administration Guide.
-
Log into the Control Center as an administrator.
-
Click the Synchronize System button.
-
Open the farm design and double-click the Ethernet Port element.
The Configure Ethernet Port dialog box appears.
-
Type the name in the Name field.
-
Type notes or comments into the Notes field.
-
In the Type field, select the device type.
The IP Address for the Ethernet Port is assigned when the farm is activated.
-
Click OK.
The Configure Ethernet Port dialog box is closed.
See Also
Configuring Load Balancers
Configuring the Load Balancer
The Load Balancer element has the following ports:
-
One management port for each primary port on the device
-
16 Virtual IPs (VIPs) for each primary port
There is no restriction on the number of subnets that you may use for VIPs. Subnets may reside on any VLAN. Similarly, the management interfaces may be connected to any subnet on any VLAN. Servers attached to the management subnets on either or both management ports are balanced. Allocate IPs on a subnet by connecting the VIP to the Subnet element. Set the number of IPs by adding VIPs in the Configure Load Balancer dialog box.
Note –
If you are balancing servers that run a Linux operating system that does not support VLANs, all subnets must reside on the same VLAN.
This section describes the following types of Load Balancer configurations.
-
Path Failover, see How To Configure a Load Balancer in Path Failover Mode
-
Device Failover or High Availability (HA), see How To Configure the Load Balancer
-
Single Device (non-HA), see How To Configure the Load Balancer
Single load balancer device configuration (non-HA) is provided by the standard replacefaileddevice request mechanism. See Troubleshooting Farm Device Failure in N1 Provisioning Server 3.1, Blades Edition, System Administration Guide and Responding to Farm Device Failure in N1 Provisioning Server 3.1, Blades Edition, System Administration Guide for a description of replacefaileddevice request.
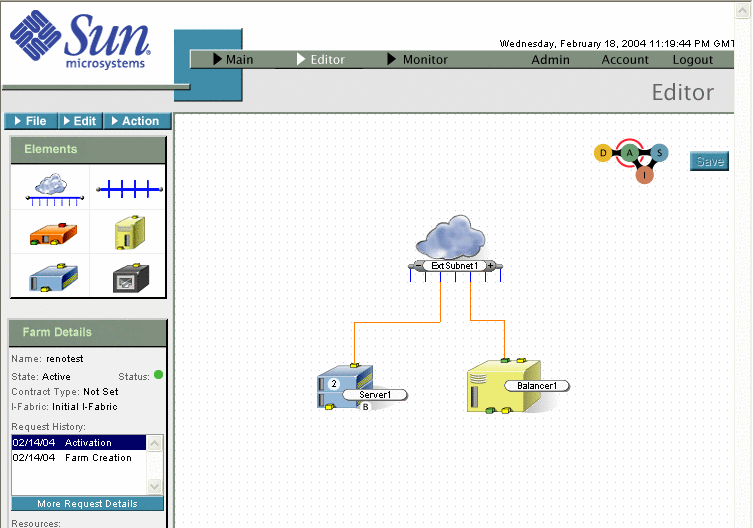
The following graphic illustrates a single device load balancer configuration.
Figure 4–1 Farm with Single Load Balancer Device
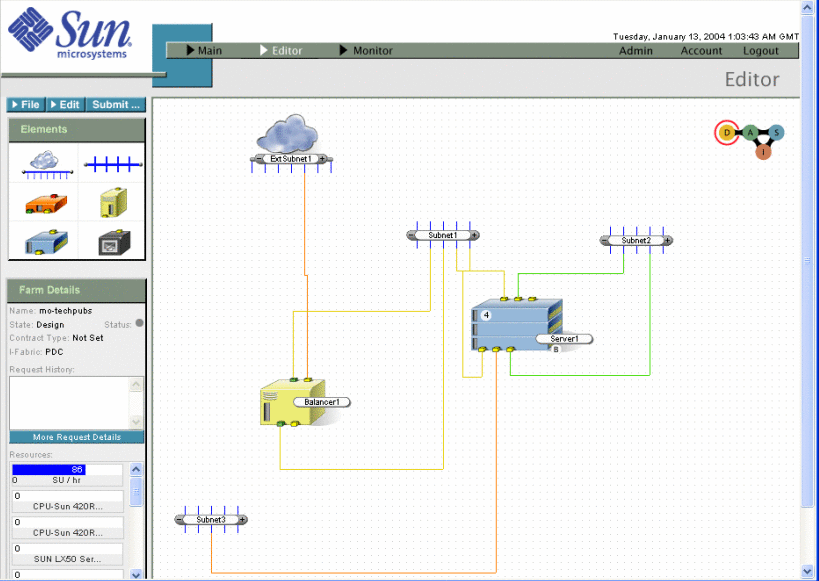
To enable path failover, connect both management interfaces (green ports) to the same subnet. If one interface fails, paths on the failed interface will be restored on the live interface. The following graphic illustrates a server farm configured for path-failover load balancing.
Figure 4–2 Farm with Path-Failover Load Balancing
By default, the Server element has one interface for each primary port, corresponding to the primary interface for that port. The primary interfaces have DNS names. To set the native VLAN of the physical interfaces, place the primary interfaces on the same VLAN. Primary interfaces cannot be removed, and their primary port cannot be changed. DNS names appear only for primary interfaces. IP addresses appear for all interfaces when they are assigned.
HA Configuration
If the load balancer you selected is in a high availability (HA) configuration, the element in the farm view area displays an HA.
To enable device failover or high availability, configure a standby-active pair of load balancer devices. You may add and remove virtual interfaces from within the Configure Server dialog box. See How To Configure the Load Balancer and How To Configure Virtual Interfaces for procedural information.
Load Balancer Best Practices
Multiple subnets are used for data, service, and management VLANs.
-
The data VLAN is where the VIPs will reside.
-
The service VLAN is the VLAN on which traffic flows from the Load Balancer to the server.
-
The management VLAN is one on which servers are load balanced.
To support the path failover configuration, the Control Center allocates Virtual IPs (VIP) on multiple subnets. The Control Center displays connections between the ports and multiple subnets. This functionality enables you to use both load balancer ports and show separation between the data VLAN and the management VLAN.
The Load Balancer management interface must be on a subnet on which one of the server interfaces resides (the management subnet). This subnet should be on a separate VLAN than the Data VLAN or the Service VLAN.
You can perform more extensive configurations directly on the device. After you perform these manual configurations, you can use the snapshot mechanism to capture the configuration. Refer to the section Creating an Account Image By Using Snapshot and How To Snapshot Load Balancer for more details.
Multiple load balancers are needed only when the load balancers are connected to multiple subnets. A common use of multiple load balancers would be to balance web traffic to web server and then balance database traffic to database servers. Each VLAN is indicated by a different wire color.
Note –
A load balancer can only balance the server. A load balancer cannot balance a subnet, external subnet, or ethernet port.
 How To Configure the Load Balancer
Load balancing evenly distributes data and processing across selected resources. Specify the type of load balancing and identify a load balancing group according to your business requirements. IP addresses are assigned after the farm is activated. The following procedure describes how to use the Editor screen to configure a Load Balancer device.
Steps
-
Double-click the Load Balancer element on the Editor screen.
The Configure Load Balancer dialog box appears.
-
Type the name in the Name field.
-
Select the device from the Type drop-down list, use HA device for high availability.
Note –You may modify this type only when the device is in the Design state.
-
Select the load-balancing policy from the Policy drop-down list.
The following choices appear.
-
Round Robin (default)—New connections are routed sequentially to servers in the Load Balancer group, thereby spreading new sessions equally across all servers.
-
Least Connected—New connections are sent to the server with the least number of active sessions.
-
Weighted—New connections are sent to servers according to weight assignments. Servers with a higher weight value receive a larger percentage of connections. You can assign a weight to each real server, and that weight determines the percentage of the current connections given to each server. The default weight is 1. You must set the load balancer weights manually.
Note –You may modify the Load Balancer policy in the Design and Active states.
-
-
Type notes or comments in the Notes field.
-
Click Add Binding and specify the IP port used to balance incoming traffic.
Each virtual interface has a set of bindings that consist of the virtual port, the real interface, and the real port. Traffic is balanced across the bindings for the interface that shares the same port.
Note –You may change this port only in Design and Active states.
-
Select the device from the Real Interface drop-down list.
The traffic coming into the virtual port on the virtual interface is balanced to the real interfaces according to the load balancing policy specified. For example, if an interface on a server group is specified as the real interface, then the binding applies to all the servers in the group.
-
Select the port used by the server(s) to balance traffic from the Real Port drop-down list.
The Real Port should be the same as the virtual port.
Note –If you use a non-standard port, you are required to set the port.
-
Click OK.
The Configure Load Balancer dialog box is closed.
-
Configure Servers. See How To Configure Servers for Load Balancing.
See Also
 How To Configure a
Load Balancer in Path Failover Mode
This procedure describes configuration of three separate VLAN subnets to enable Path Failover. These subnets are used for data, service, and management path failover.
Before You Begin
Servers running the Solaris Operating System require that the clbmod package is installed to enable load balancing. During the farm activation process, the interface will be plumbed for the clbmod module. If the module is not present the activation will fail.
Path Failover mode requires that the Load Balancer be able to change the interface on which traffic flows from the VIP to the Load Balancer. This is accomplished by placing both management interfaces on the same subnet. When the Load Balancer determines that it no longer has a path to the target IP via the interface on which it was configured, it will then restore those paths on the other, live, interface. See Load Balancer Best Practices for additional information and illustrations.
Note –
Path failover is automatically configured when both management interfaces are placed on a single subnet. In this configuration, the VIPs will be configured on the primary port that the user selects, but when that primary port fails, they will be failed over to the other port.
This procedure assumes the following connections and naming conventions for farm components.
-
External Subnet is connected to Load Balancer (data VLAN)
-
Load Balancer is connected to the Management Subnet (management VLAN)
-
Management Subnet is connected to Server1 (management VLAN)
-
Server1 is connected to the Service Subnet (service VLAN)
-
Management Subnet is connected to Server2 (management VLAN)
-
Server2 is connected to Data Subnet (data VLAN)
Steps
-
Configure the management VLAN.
Servers are load balanced on the management VLAN.
-
Drag a Load Balancer, two Servers, an External Subnet and a Internal Subnet onto the Editor screen.
-
Connect the Load Balancer management interfaces to the Internal Management Subnet.
This automatically configures the Load Balancer in Path failover mode.
-
Connect a VIP from the Load Balancer to Internal Management Subnet.
-
Connect both primary interfaces on both physical ports of the Server to the Management Subnet.
-
Connect Server1 service interfaces to Service Subnet.
-
Place the data interface from the Server on the Data Subnet that will have the same VLAN as the VIPs.
-
-
Choose Save from the File menu.
The farm configuration is saved.
-
Double click the Load Balancer element.
The Configure Load Balancer dialog box appears.
-
Select the type of Load Balancer from the Type drop-down list.
-
Select the Policy type for the Load Balancer from the Policy drop-down list.
The following choices appear.
-
Round Robin (default)—New connections are routed sequentially to servers in the Load Balancer group, thereby spreading new sessions equally across all servers.
-
Least Connected—New connections are sent to the server with the least number of active sessions.
-
Weighted—New connections are sent to servers according to weight assignments. Servers with a higher weight value receive a larger percentage of connections. You can assign a weight to each real server, and that weight determines the percentage of the current connections given to each server. The default weight is one. You must set the load balancer weights manually.
Note –You may modify the Load Balancer policy in the Design and Active states.
-
-
Click the + button to add a binding to the eth0:vip0 interface.
The eth0:1 interface binding appears.
-
Type the appropriate port number in the virtual and real port edit fields, for example 50.
-
Select Server1-eth0:1 as the Real interface from the Real Interface drop-down list.
-
Click the + button under virtual interface to add an interface.
The eth0:2 interface appears.
-
Type the appropriate port number in the virtual and real port edit fields, for example 50.
-
Select Server2-eth0:2 as the Real interface from the Real Interface drop-down list.
-
Click the OK button to close the Configure Load Balancer dialog box.
-
Configure Servers. See How To Configure Servers for Load Balancing.
You must configure Servers to enable load balancing.
-
Connect the service and management VLANs.
-
Configure VLANs. See How To Modify a VLAN Configuration for Load Balancing.
-
Choose Save from the File menu.
The farm configuration is saved.
See Also
 How To Configure
Servers for Load Balancing
Steps
-
Drag a Server and two Internal Subnet elements onto the Editor screen.
-
Name the elements Server2, Service Subnet and Data Subnet.
-
Double-click the Server element.
The Configure Server dialog box appears.
-
Click the + button twice to add two virtual interfaces to the available primary port.
These virtual interfaces will be used for the service and data VLANs.
-
To add an image to the new disk, click the Select button.
-
Select load balancer from the Def. Gateway drop-down list.
-
Click the OK button.
The Configure Server dialog box is closed.
Note –In order to submit the farm, all servers must have an eth0 connected. That is, each server must have an IP allocated on a subnet). Additionally, if any virtual interface on any other primary port is allocated, the primary interface on the port must also be connected.
 How
To Modify a VLAN Configuration for Load Balancing
Steps
-
In the Editor screen, choose Configure VLANs from the Edit menu.
A message describing automatic VLAN configuration appears.
-
Select Manually from the Configure VLANs drop-down list.
The Configure VLANs dialog box appears.
-
Select a VLAN from the Current VLANs list.
The name, wire color, and included subnets display in the right pane.
-
Change the subnet on which the data IP resides to be in the data VLAN by double-clicking the Subnet element and selecting the appropriate VLAN.
-
Click OK.
The new VLAN information is applied and the Configure VLANs dialog box is closed.
Note –If you add or delete a VLAN, you must update the appropriate subnet configuration to associate the subnet with the correct VLAN. If you delete a VLAN and do not associate the subnet configuration with another VLAN, an error message is printed.
Saving and Activating Farms
Saving and Validating the Farm
Save your farm design periodically during the design process. This action not only saves the design, but also enables you to correct problems as you go at each save. To save your farm, choose Save from the File menu. When you submit your farm for activation, the Control Center validates your farm to ensure that the elements are wired according to the wiring rules and where applicable, are within your contract agreement boundaries.
Validating Farms
When the farm is submitted for activation in the Control Center, you can see the farm reflected in the Pending Requests screen. Likewise, you can be notified of the change in farm state by an email if this feature was configured during software installation.
 How To Validate
a Farm
Because the Control Center does not check for good design, you must do this manually.
Steps
-
Review the farm design in the Editor screen with the following design details in mind:
For each external subnet connection, the following six IP addresses are used for administrative overhead:
-
Network base address
-
A virtual interface for monitoring connectivity
-
Edge Router 1
-
Edge Router 2
-
HSRP address
-
Broadcast address
-
-
Verify that the external subnet connection specified is acceptable.
For example, the user did not request a whole class C address space.
-
If the farm design is valid, proceed to Farm Activation Tasks.
-
If the farm is already active and is being updated, refer to Updating Active Farms for instructions.
-
If the farm design is invalid, refer to Cancelling a Farm Request for instructions on how to cancel or reject the activation request.
Submitting a Farm Design for Activation
In order to activate a farm after the farm is configured, you must first submit the farm for activation.
Control Center Rules Checking
The Control Center performs a rules check before the farm is submitted for activation. If errors exist in your design, you are prompted to correct the errors.
The following rules are checked:
-
Every element must be configured according to the element's rules
-
Every hardware element must have the required wiring connections
-
A valid hardware device is configured for each element.
-
No element configuration can contain a reference to deleted elements
-
Every server must have a boot disk
-
No circular loops can exist in the default gateway configuration
-
The number of externally visible IP addresses that is needed cannot exceed the requested maximum
Note –The Control Center does not validate that your resources are within any limits set by your contract or available within the I-Fabric at that point in time.
-
Every VIP must be connected or a warning appears
-
Every server receiving traffic from a load balancer must have an interface on the data VLAN or a warning appears
 How To Submit the Farm For Activation
Steps
-
Open a farm in the Editor and review the farm to ensure that the design is correct.
-
Click the Submit button.
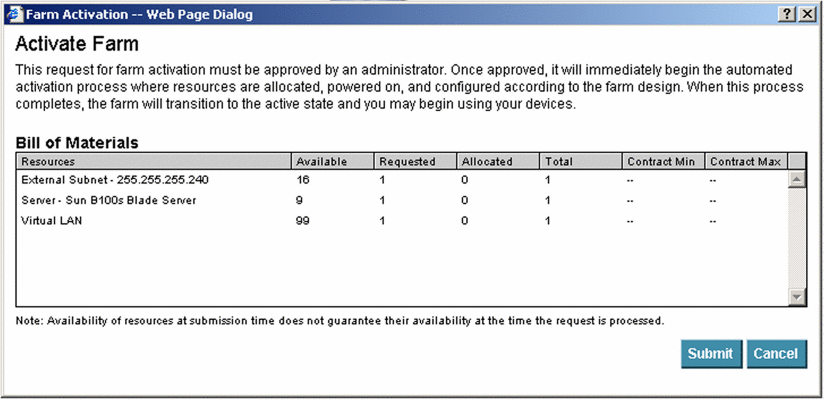
The Farm Activation dialog box appears. Any devices that are not available are highlighted in red text.
Figure 4–3 Farm Activation Dialog Box
-
If all requested resources are available to accommodate this request, click the Submit button.
Note –Requested devices may not be available at the time of the request because devices may be allocated to another farm during the activation process.
The farm lifcycle icon displays pending active on mouse-over. The line connecting D and A turns red. The circle surrounding the A is animated to indicate the target farm state.

The Main and Monitor screens display the most recently completed state of the farm. The Editor screen displays the requested state of the farm. When the activation process is complete, the Main and Monitor screens change to reflect that the Active state is now the most recently completed state of the farm. The farm lifecycle icon in the Editor changes to Active.
Farm Activation Tasks
This section lists the tasks required to activate a farm after the farm activation request has been submitted. Subsequent sections provide step-by-step instructions for the various tasks. To activate a farm, you need to perform the following tasks.
-
Set contract parameters for the farm in the Control Center Administration screen. See How To Set Contract Parameters
-
Unblock the farm activation request using the Administration screen or activate the farm using the command line interface. Requests for activation are initially blocked. See How To Unblock a Farm Activation Request How To Activate a Farm By Using the Farm Activation Commandand
After the farm is active, perform the following tasks:
-
Set up routing for the user's network.
-
Use ping, telnet, or any other remote accessing software to confirm that you can access externally available IP addresses on the farm.
Unblocking Farm Activation Requests
When you submit a farm for activation, the activation request is initially blocked. Use the Pending Requests option under Farm Management Tools in the Administration screen to unblock activation requests.
Note –
You can also use the Pending Request option to unblock other types of requests, such as putting a farm on standby, deactivating and reactivating a farm, or deleting a farm.
 How To Unblock a Farm Activation Request
Steps
-
Log in to the Control Center Administration screen.
-
Select the appropriate account and farm from the left side of the screen.
-
Click the Pending Requests button.
The Pending Requests screen appears.
-
Select the type of requests to display from the Show drop-down list.
-
From the Pending Requests In drop-down list, select the I-Fabric name to display farms pending requests from this I-Fabric.
-
Click the Show Pending Requests For All Accounts check box to display all pending requests for all accounts.
-
Locate the farm for which you wish to change state.
If you want to view the farm design in the Editor, click View Selected Farm.
-
Click Unblock Request to initiate farm activation.
A confirmation dialog box appears.
-
Click OK to unblock the request.
Tracking the Activation Process
After you unblock a farm request, the N1 Provisioning Server software identifies the hardware resources and software components required for the instantiation of the farm. The system first allocates all hardware resources from the resource pool. For each device, the system configures the physical device as specified in the farm design. The system also initiates the copying of the required images and configures servers according to the servers specified role.
Note –
The resource pool is a single pool of unused devices in an I-Fabric. When you create farms, the farms use available devices in this pool.
Farm Details
You can also keep track of farm requests by using the Farm Details section of the Main, Editor, and Monitor screens. The Main and Monitor Farm Details show you the farm request history. The Editor Farm Details enables you to click an item to view the farm topology and configuration at the time of the request.
 How To View a History of Farm Requests
Steps
-
Log in to the Control Center Administration screen.
-
Select the appropriate account from the Current Account drop-down list.
-
Select the appropriate farm from the Current Farm drop-down list.
-
Click the Farm Requests button.
The Farm Requests screen displays the history of requests for farms. The Messages area displays message log details for each Request ID.
-
Set up the farm request query.
-
To run the query, click the Go button.
Activating the Farm Manually
If you prefer, you may activate farms manually by using the command-line interface, as opposed to using the Administration screen in the Control Center. To do so, you first verify that adequate resources are available in the target I-Fabric to activate the farm. Use the command device -LF to list free devices. Use the command device -lr <deviceID> to see with which role a device has been configured.
The N1 Provisioning Server software identifies the hardware resources and software components that are required for the instantiation of a farm. The system first allocates all hardware resources from the resource pool. For each device, the system configures the physical device as specified in the farm design. The system also initiates the copying of the required images and configures servers according to the Control Center configuration.
Note –
The resource pool is a single pool of devices. The farms that you create use available devices in this pool.
Activating Farms By Using the Farm Activation Command
You can use the Administration Tools to execute the farm activation command to begin activation.
Note –
Use the command farm -h for help.
 How To Activate a Farm By Using the
Farm Activation Command
Steps
-
Type the command farm -a farm_ID to activate a farm on the SP.
Note –To add a high priority code to this request or to issue a request to a farm in ERROR state, use the -f option to create a high priority request. Refer to Chapter 6, Troubleshooting for more information on the ERROR state.
-
For software that runs on the Solaris Operating System, check the file /var/adm/messages for error messages. If you have turned on the debugging option in the /etc/opt/terraspring/tspr.properties file, check for any error messages in the file /var/adm/tspr.debug. You can view messages by using the command tail -f /var/adm/tspr.debug and by monitoring the error column in the output from the farm -l command. Also monitor the request queue for the farm using the command request -lf farm_ID to check the status of the queue.
Note –The tspr.debug will have messages interleaved if actions on multiple farms are issued the same time.
-
When the farm status changes to ACTIVE, display the farm resources using the command lr -lv farm_ID.
The farm configuration includes the server IP address and the subnet configuration for the farm. This information is available as soon as the allocation process is completed. You do not have to wait until the farm reaches the ACTIVE state.
Note –The Farm Manager keeps a log file of the farm activation process and any updates that are associated with the farm. The messages are logged in the file /var/adm/messages. Type the command tail -f /var/adm/tspr.debug on the farm's owner SP to view the debug log file if you would like to follow farm activities in real time.
Cancelling a Farm Request
Use the Pending Request option in the Administration screen to cancel or reject a farm request.
You can only cancel a farm request if the activation request has been blocked or the status is “Queued.” If the activation process has begun, the Cancel Request button is unavailable.
 How To Cancel a Farm Request
Steps
-
Log in to the Control Center Administration screen.
-
Select the appropriate account and farm from the left-hand side of the screen.
-
Click Pending Requests listed under the Farm Management Tools on the left-hand side of the screen.
-
Select the farm request that you wish to cancel or reject and click Cancel Request.
A confirmation dialog appears.
-
Click OK.
The following changes occur:
-
The farm state reverts to the previous state.
-
The lifecycle icon changes to Canceled.
-
The Request History displays Canceled
-
Locking and Unlocking a Farm
After a farm has been submitted for activation, you can lock the farm by applying a password so that no one else can modify the farm. You can lock a farm in any state except the Design state.
 How To Lock a Farm
Steps
-
Log in to the Control Center Administration screen.
-
Select the appropriate account and farm from the left-hand side of the screen.
-
Click Lock Current Farm.
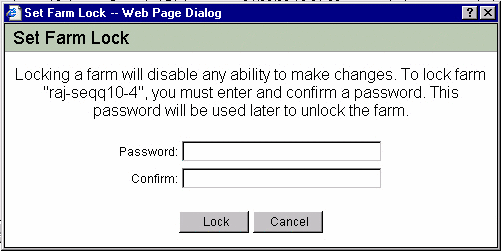
The Set Farm Lock dialog box appears:
-
Enter a password and re-enter the password for confirmation.
The maximum password length is 30 characters.
-
Click Lock to lock the farm.
The Editor displays an icon that indicates that the farm is locked.
 How To Unlock a Farm
Steps
-
Log in to the Control Center Administration screen.
-
Select the appropriate account and farm from the left side of the screen.
-
Click Unlock Current Farm.
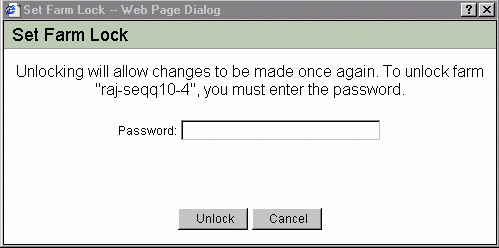
The Set Farm Lock dialog appears:
-
Enter the password you set previously to lock the farm.
-
Click Unlock.
Resetting Your Farm Lock Password
If you forget your farm lock password, you must use the command-line interface (CLI) to reset it.
 How To Reset Your Farm Lock Password
Steps
-
Type the following command at the command line prompt and press Enter.
resetpasswd -f farm_ID
You are prompted to enter a new password.
-
Type a new password.
Note –This command does not require you to enter the old password. The command only prompts you for the new password to replace the old one.
Locking and Unlocking a Farm Using the CLI
You can also use the CLI to lock and unlock a farm. When you use the CLI, you can lock a farm without setting a password by using the command lockfarm -l farm_ID. Use the -p option to password protect your farm lock.
 How To Lock a Farm Using the CLI
Steps
-
Type the following command at the command line prompt.
lockfarm -l -p farm_ID
You are prompted to enter a password.
-
Type your password.
 How To Unlock a Farm Using the CLI
Steps
-
Type the following command at the command line prompt.
lockfarm -u -p farm_ID
You are prompted to enter a password.
-
Type your password.
Checking Resource Availability
Before activating a farm, check for resource availability.
 How To Check Resource Availability
Steps
-
Access the SP by using Telnet.
-
Use the following command to check for available resources for this farm request:
rsck farm ID
-
If you wish to see a list of free devices in an I-Fabric, type the following command:
device -LFt type
-
If the farm does not have adequate internal subnets, you can add additional subnets as required by using the following command:
subnet -cm mask_length starting_IP_address
-
If there are not sufficient external subnets available, you might need to consult your network administrator to find the address space available for your use. If you know which subnet to add, you can add the subnet by using the following subnet command:
subnet -xcm mask_length starting_IP_address
Note –The control plane server allocates any address space with the correct subnet mask.
-
If the farm has an Ethernet port device, that is, a device external to the I-Fabric, you must connect and configure the device manually as described in Configuring the Ethernet Port Element for Unmanaged Devices.
Delivering Active Farms
If you are activating farms on behalf of users and account managers, delivering an active farm to the user entails communicating the following information:
-
IP addresses
-
Device passwords
-
Additional information
Communicating Activation Information To Users
This section describes the type of information you need to communicate to users when delivering a farm.
IP Addresses
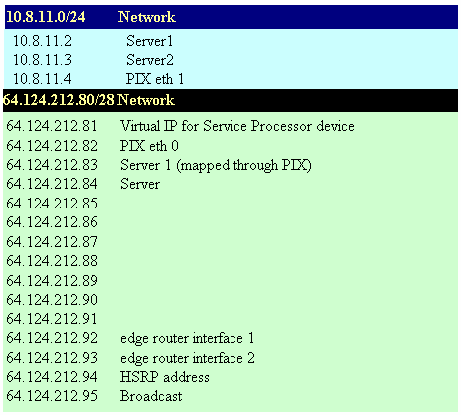
Users need to know the IP addresses for the farm. Users can view IP addresses for each device through the Control Center. You can also produce a report showing all the IP addresses assigned to the user devices. The data can be found by using the command lr -lv farm_ID.
For external public subnetworks, the address in a network, before broadcast, is the HSRP address, default gateway. The two addresses before are the edge router interfaces. The simplest report format is a spreadsheet as shown in Figure 4–4:
Figure 4–4 Simple Report Format
Device Passwords
Users also need to know the default passwords for farm devices and the passwords you assigned .
Additional Information
Advise the user about the following information:
-
The user should not change network device passwords (load balancers)without notifying the administrator. Failure to notify the administrator after changing the password of network devices results in the Control Center being locked out of network devices. Monitoring also ceases to function.
-
The user should change device passwords on the servers, all operating systems, immediately after they are initially assigned. The Control Center continues to access the servers. Monitoring continues to function, unless the user disables the monitoring agents.
Updating Active Farms
The Control Center enables you to modify or flex (scale) your farm according to your requirements and apply the changes to update the Active farm. You can also place farms on standby, reactivate farms, make farms inactive, and delete farms.
The Control Center enables you to update active farms from the Editor. To save changes, choose Commit from the File menu to request that these changes be made to the live farm.
Adding and Removing Computing Resources from a Farm
You can change or flex your farm according to your requirements. The term flexing is a description of the capability to add or remove computing resources. It can refer to the ability to add or remove a server to a server group, or add or remove other devices to or from a farm.
after you change the design of your active farm in the Control Center, you must choose Commit from the File menu to resubmit it for activation.
 How To Add and Remove Resources from
an Active Farm
Steps
-
Locate and select your Active farm.
-
Make changes to the design of your active farm in the Editor.
-
Choose Commit from the File menu.
The Commit Change for Farm Update dialog box appears.
The Bill of Materials section displays a list of resources that includes the following information:
-
Available—The number of available resources arranged by type.
-
Requested—The number of requested resources arranged by type.
-
Allocated—The number of resources currently allocated in the farm.
-
Total—The total number of resources you will have if this request is processed, that is, the sum of requested and allocated resources.
-
Contract Min—The minimum limit of resources that your contract allows.
-
Contract Max—The maximum limit, of resources that your contract allows.
 Caution –
 Any listing other than a subnet that appears in red indicates that there are not enough resources currently available in the I-Fabric to accommodate this request.
-
-
If all requested resources are available to accommodate this request, click Submit to submit your farm. Otherwise, click Cancel.
The physical resources you requested are available for the Active farm only after the requests are processed.
Note –You can view your request status through the Farm Details section of the Main and Editor screens, from the Farm Request section of the Administration screen, or from the Account Request Log from the Account Screen.
See Also
Changing the State of a Farm
You can perform the following state changes to deployed farms:
-
Activate a deployed farm
-
Place an active farm on standby
-
Inactivate a standby farm
-
Reactivate a standby farm
When an Active farm goes into a Standby state, all storage volumes are preserved, but hardware is returned to the free pool. Specifically, all elements, excluding storage, are returned to the idle pool. You can deactivate a farm (make a farm inactive), and retain the farm as a template, or you can delete the farm.
After the farm is placed on Standby, you can request reactivation of this farm and return the farm to the Active state. An Inactive farm cannot be reactivated. However, the SaveAs feature enables you to create copies of the inactive farm design that may be edited and submitted for activation.
Placing a Farm On Standby
The Standby state is a convenient way to free most of the resources used by an otherwise idle farm. The Standby state also preserves the farm's design and data for easy and rapid reactivation at a later date.
In the Standby state, servers and load balancers are returned to the free pool. The farm design, including the network configuration, resources, such as, IP addresses and VLANs, and disk data are preserved.
-
In the case of servers with local disks, the system makes an image copy of all disks before wiping the volumes and returning the servers to the free pool.
-
All contract quotas and monitoring configurations information are preserved.
Deactivating a Farm
The Control Center enables you to deactivate a farm. When deactivated, the farm is completely decommissioned, thus freeing and clearing all resources for other uses. Only the associated design and history are retained and tracked as an inactive farm in the Control Center.
If the farm includes an Ethernet-connected device as represented by an Ethernet Port element connection in the Control Center Editor design, ensure that this device is disconnected manually as part of the deactivation. Otherwise, the device IP address could be reallocated to another user's new farm, thus presenting a security risk.
 How To Change the State of a Deployed
Farm To Standby or Inactive
As with other farm requests, a request to deactivate a farm or set a farm to standby is initially blocked. Hence, after the farm request has been submitted, you need to unblock the farm request. Use the Farm Management Tools in the Administration screen to perform these tasks.
Steps
-
Do either one of the following steps:
-
From the Editor, select the farm that you want to place on Standby or make Inactive from the drop-down list.
-
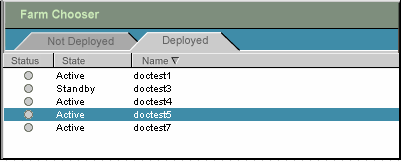
From the Main screen, select the farm that you want to place on Standby or make Inactive from the Farm Chooser's Deployed tab. Figure 4–5 shows an example of the Farm Chooser Deployed tab.
Note –A farm in Active state cannot be deleted. The farm must be deactivated first.
Figure 4–5 Farm Chooser Deployed List
The farm appears in the Farm View Area of the Main screen.
-
-
In the Farm Display area, click Edit to open the design in the Editor.
-
Click the Action menu to display the available options:
-
Standby - place the farm in Standby state.
-
Inactive - place the farm in Inactive state.
-
-
Choose the required change in state. You are prompted to verify your selection.
-
Deactivate this farm if you choose Make Inactive.
-
Set farm to standby if you choose to Make Standby.
-
-
Click OK.
Note –Other Control Center users can cancel your request to make standby if the users are administrators. You can reactivate a farm in standby state.
 How To Unblock a Farm Request After
Deactivating or Setting a Farm To Standby
Steps
-
From the Administration screen, open the Pending Requests screen from the Farm Management Tools area.
-
Select the request.
-
Click Unblock Request.
Refer to Unblocking Farm Activation Requests for detailed instructions on how to unblock a farm request.
Freeing Ethernet Port or Unmanaged Devices
Ethernet devices are not freed when a farm is deactivated; you must free them manually. You might also need to unwire and remove ethernet devices from the data center as well as from the database.
 How To Free an Ethernet Device and
Remove the Device From the Database
Steps
-
To free the Ethernet device type the following commands:
device -sB Ethernet_devid
device -sF Ethernet_devid
-
To remove the device from the database type the following command:
device -d Ethernet_devid
Canceling Standby and Inactive Request
Note –
You can cancel a request if you have not already unblocked the request or if the unblocked request has not been processed. After the request is in process, you cannot “undo” this change.
You can cancel the request to place the farm on Standby and to make a farm inactive, for example, if you realize you have changed the state of the wrong farm. Canceling a change request is possible only before the farm goes into Standby or Inactive states.
The only way to reactivate this farm is to copy the inactive farm to a new name and resubmit the farm for validation and activation. See Copying a Farm and DNS Naming Conventions for related information.
 How To Cancel a Request For Standby
or Deactivation
Steps
-
From the Administration screen, open the Pending Requests screen from the Farm Management Tools area.
-
Select farm request.
-
Click Cancel Request.
The farm remains in Active state.
Reactivating a Farm
You can reactivate a farm placed on Standby to Active state.
 How To Reactivate a Farm
Steps
-
Do one of the following steps:
-
From the Editor, select the farm that you want to reactivate from the drop-down list
-
From the Farm Chooser, select the farm on Standby from the Deployed list.
-
Click Edit to open the farm in the Editor.
The farm appears in the Farm View Area.
-
-
Click the Action menu and choose Reactivate

When you click Reactivate, the Activate Farm dialog appears as shown in Figure 4–6.
Figure 4–6 Submit for Activation

The Bill of Materials section of the Activate Farm dialog box displays a list of resources that includes the following information:
-
Available—the number of resources available by type at this point in time in the I-Fabric.
-
Requested—the number of resources by type that you are requesting in this submission.
-
Allocated—the number of resources allocated in the farm to date.
-
Total—the total number of resources you will have if this request is processed, that is, the sum of requested and allocated resources.
-
Contract Min—the minimum limit, or quota, of resources by type that your contract allows.
-
Contract Max—the maximum limit, or quota, of resources by type that your contract allows.
 Caution –
 Any listing that appears in red indicates that there are not enough resources currently available in the I-Fabric to accommodate this request. Consequently, click Cancel and either free resources and submit your farm again, or adjust your farm design and submit the farm.
Smaller subnets can be created from larger subnets. Consequently, allocation can succeed even though the Bill of Materials indicates otherwise.
-
-
If all requested resources are available to accommodate this request, click Submit to submit your farm.
After the farm update request has been submitted, you need to validate the farm design, unblock the farm request, and if necessary, change the contract parameters. Use the Farm Management Tools in the Administration screen to perform these tasks.
You should also check resource availability prior to unblocking the request to avoid getting a “No more resources available” message.
 How To Unblock the Farm Request After
Reactivating the Farm
Steps
-
From the Administration screen, open the Pending Requests screen from the Farm Management Tools area.
-
Select the farm request.
For detailed validation guidelines, refer to How To Validate a Farm.
-
Click Unblock Request.
For detailed instructions on how to unblock a request, refer to Unblocking Farm Activation Requests.
-
Open the Contact Parameters screen from the Farm Management Tools area and Make any necessary changes.
For detailed instructions on how to change contract parameters, refer to Setting Contract Parameters.
-
Click Submit.
Deleting a Farm
You can only delete a farm that is in the Inactive state or in the Design state.
A farm in the Design state can be deleted from either the Main or Editor screens. No further steps are required to delete a farm in the Design state.
A deactivated farm in the Inactive state can be deleted by clicking the Delete button in Control Center Editor. You must also unblock the request in the Pending Requests option under Farm Management Tools in the Administration screen.
 How To Delete a Farm From the Main
Screen
Steps
-
Select the farm to be deleted from the list displayed in the Farm Chooser's Not Deployed tab.
The farm is displayed in the farm View Area of the Main screen.
-
Click Delete button next to the Lifecycle Icon.

 How To Delete a Farm From the Editor
Screen
Steps
Copying a Farm
You can copy a farm that is in any state. This action copies the farm design and configuration to a new farm that is in the design state. If you wish to create a duplicate second farm, you need to create a copy of the farm and submit this design for activation.
 How To Copy a Farm
Steps
-
Open a farm in the Editor.
-
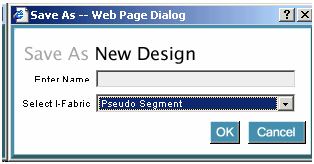
Click File and choose Save As.
-
Enter a new farm name and select the I-Fabric in which to deploy the farm.
-
Click OK.
See Also
Monitoring Active Farms
Monitoring is the mechanism used to ensure that the elements associated with the farms are behaving as expected. This section describes how to setup monitors.
Every element in the farm is monitored to ensure network connectivity of the device. In addition, servers contain a special monitoring agent that enables you to configure monitoring beyond that of basic network connectivity. With monitoring you can do the following activities:
-
View real-time availability status of farm devices.
-
Configure optional server monitors to measure CPU, disk, physical, and logical memory.
-
Set thresholds that tell the system when to display and issue warnings and errors.
-
Create user notification lists so the system can alert individuals of warnings and errors.
Note –For information about accessing monitoring data using an SNMP connection, see Forwarding Messages to an NMS in N1 Provisioning Server 3.1, Blades Edition, System Administration Guide.
Monitoring Availability of Farm Elements
The Control Center automatically sets up an availability monitor for each element in an active farm. The availability monitor checks the availability of a machine and informs whether the machine is up. The availability monitor cannot be modified or deleted.
Monitoring Servers
The availability monitor indicates that the server is available when the monitoring agent is running and that the server's primary interface responds to ping.
You may configure an alarm for the availability monitor if you wish to be notified of state changes. There is a maximum of two minutes lag time from the time the machine goes up or down to the time when the Control Center is notified.
Note –
Any monitor deployed to a server group is automatically applied to each server in the group.
Monitoring Load Balancers
The availability monitor indicates that the load balancer is up when the primary interface responds to ping.
You cannot configure monitors or alarms for load balancers. Availability monitors are automatically set up for load balancers which appear as red or green indicating the current status.
Monitor Option Buttons
To access the Monitor screen, click Monitor on the Navigation Bar.
The Monitor option buttons located at the left-hand side of the Monitor screen enable you to perform various monitoring-related tasks. The User Groups and Contact Methods buttons are displayed only if you have Account Manager privileges. The Monitor option buttons are described in the following table:
Table 4–2 Monitor Screen Buttons
Setting Up Element Monitors and Alarms
To set up element monitors and alarms, you must set up the conditions to monitor the alarms. The monitors setup for the element applies to the entire server group, if applicable. You can monitor the following activities:
-
CPU Usage–the percent of CPU being used or an average for machines with multiple CPUs.
-
Bandwidth Utilization–the percent of bandwidth in use.
In addition, each monitor can be configured to record monitoring information at an interval that you specify. The interval must be a multiple of five minutes.
 How To Set Up Monitors
Steps
-
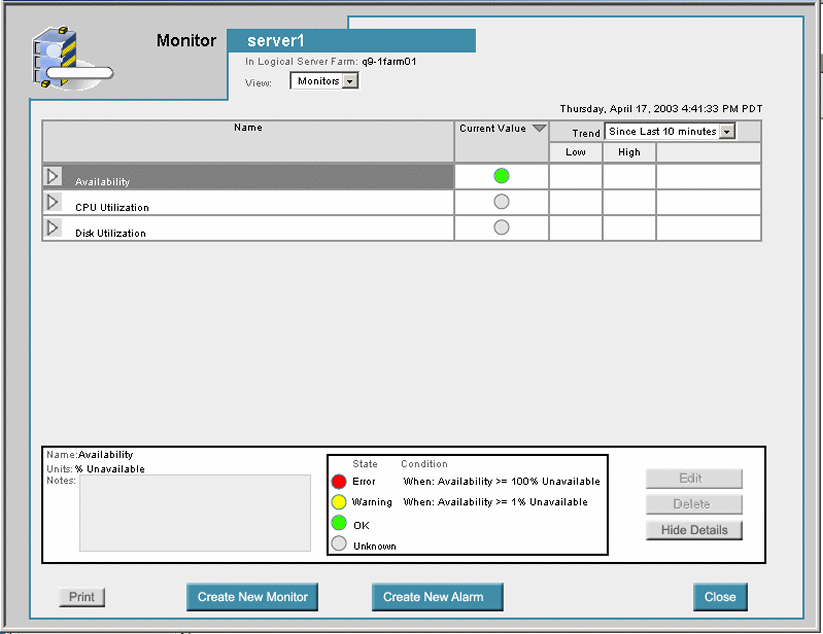
Right-click the server element, and choose Monitor
The Monitor Server screen appears.
Figure 4–7 Monitor Server - Default Availability
-
Click Create New Monitor
The Create Element Monitor dialog box appears.
-
Select the desired item to monitor from the Monitor drop-down list.
The variable name in the Condition column, is highlighted in red text when you position the cursor inside a threshold box.
The variable name turns red to bring your attention to the fact that you have not provided the required value. The variable switches back to the original color after you return the cursor to the threshold box to input the required value.
-
Click the Interval up and down arrow button to change the monitor interval.
You may add or remove monitor status updates in a fixed five minute update interval.
-
Type the desired percentage in the field provided for a warning variable state. Type a value between zero and 100.
-
Type the desired percentage in the field provided for an error condition state. Type a value greater than or equal to the value set in Step 6.
-
Type any related notes in the Notes field.
-
Click the OK Button to save your changes.
-
(Optional) Repeat steps 4 through 7 to configure additional element monitors.
Note –You cannot deploy two monitors of the same type, for example, CPU, on the same server.
-
Click the Apply button to apply your changes.
-
Click the Close button.
The Create Element Monitor dialog box is closed.
Note –All servers in a server group receive the same monitors automatically.
-
Click the Commit Changes button on the Monitoring screen.
The element monitors are applied to the active farm.
 Caution –
 Complete all element monitor configuration changes for a farm before you click the Commit Changes button to limit overhead processing.
-
Click OK to confirm the request.
 How To Set Up Element Alarms
Alarms enable you to have the Control Center contact a group or several groups when a threshold is exceeded on a monitor. Before you can create a new alarm, you must define Contact Methods for the account user groups. See Setting Up Contact Methods in Chapter 8 Managing Accounts.
Steps
-
Click Monitor on the Navigation bar and select the desired farm.
The Monitor screen appears.
-
Right-click the server element and choose Monitor.
The Monitor Server screen appears.
-
From the Monitor Server screen, click the Create New Alarm button.
The Create New Alarm dialog box appears.
-
Type a name for the alarm.
-
Click OK to save the alarm name.
The Create Element Alarm dialog box appears.
Figure 4–8 Create Element Alarm
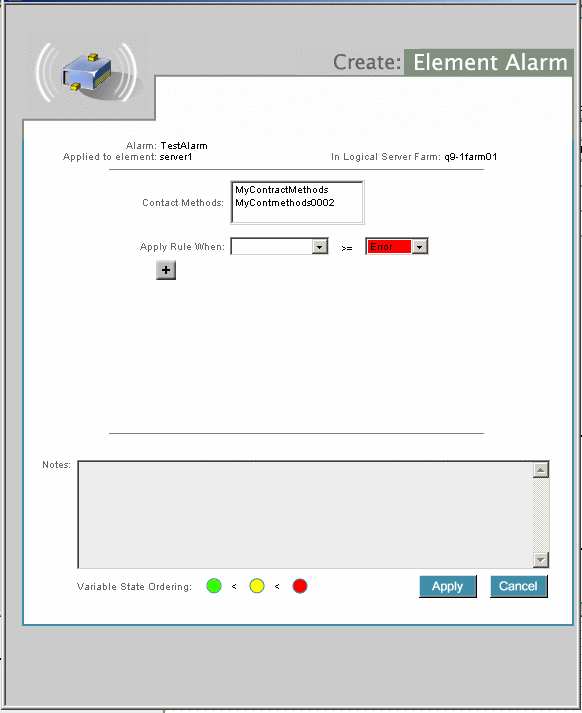
-
Set up the newly created element alarm as shown in Figure 4–8.
-
Select a contact method from the Contact Methods list.
This method is used when an alarm condition occurs. See Setting Up Contact Methods.
-
Select the desired alarm from the Apply Rule When drop-down list.
See How To Set Up Monitors for procedural information about defining rule conditions.
-
Select either Error or Warning from the drop-down list to the right of the Apply Rule When drop-down list.
-
Click the + button to add an alarm condition, if appropriate.
-
Click the Apply button to save your changes.
-
If you configured multiple items, click Save Changes to save all Monitor changes.
-
Click the Commit Changes button to initiate a farm request for creation of the alarm.
 Caution –
 Changes cannot take effect until after you click the Commit Changes button on the main Monitor screen.
Editing Monitors and Alarms
Configured monitors and alarms can be edited in the Configure Monitor dialog or the Configure Alarm dialog. Both are reached through the Monitor Window. The procedure is similar for both monitors and alarms.
 How To Edit an Existing Monitor or
Alarm
Steps
-
Click Monitor on the navigation bar and select the desired farm from the list.
The Monitor screen appears.
-
Right-click the server element and choose Monitor.
The Monitor Server screen appears.
Figure 4–9 Monitor Server
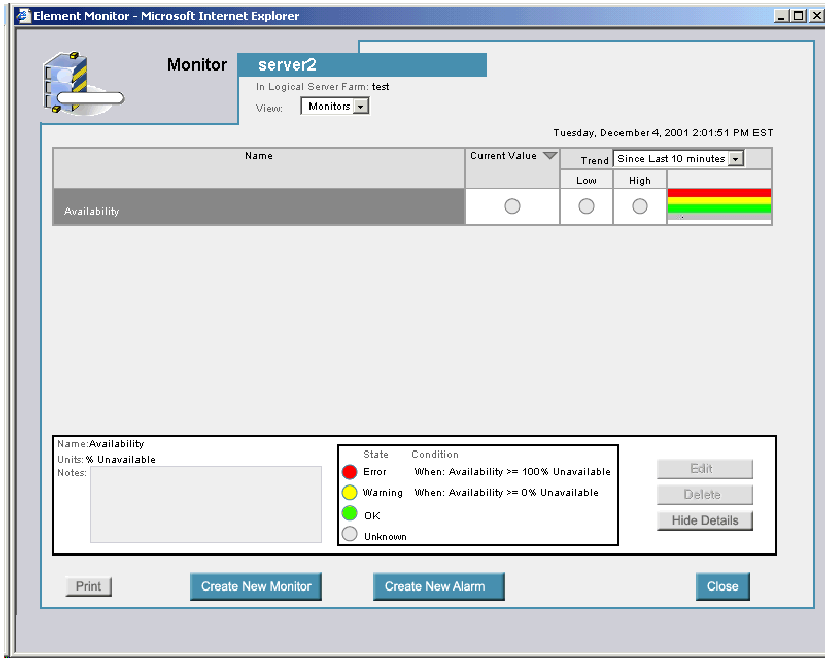
The names of currently configured monitors appear listed in the table by name.
-
Select the monitor or alarm to edit.
In the table of monitors click the right-arrow button button at the left-hand side of the monitor name to expand the view for that monitor. Each element configured for that monitor appears as a line item. Click the down-arrow button to collapse the list.
-
Double-click the monitor or alarms name.
-
On the right-hand side of the Monitor Details area, click the Edit button.

The Configure Element Monitor dialog box or the Configure Element Alarm dialog box appears depending on whether you selected a monitor or an alarm.
-
Make the changes as needed.
See How To Set Up Element Alarms and How To Set Up Element Alarms.
-
Click the Apply button to record your changes.
You are returned to the Monitor Window.
-
Click the Close button to return to the main Monitor page.
-
Click the Commit Changes button to save your changes.
 Caution –
 Changes cannot take effect until after you click the Commit Changes button on the main Monitor.
Using the Monitors
Use the Monitor screen to view the current status of the devices in an active farm. Aggregated monitors for a server group display by default. These monitors display Disk Utilization, CPU Utilization, RAM Usage, and SWAP Memory Usage. To view monitoring information of the individual servers, click on the server. Each monitor displays the current state and historical data. Low and high values for the time period specified in the drop-down list also appear. Only the current state is displayed for aggregated monitors.
 How To Monitor Servers
Steps
-
Click Monitor on the navigation bar and select the desired farm.
The Monitor screen appears.
-
Right-click the Server element and select Monitor.
The Monitor Server screen appears.
Figure 4–10 Monitor Server Screen
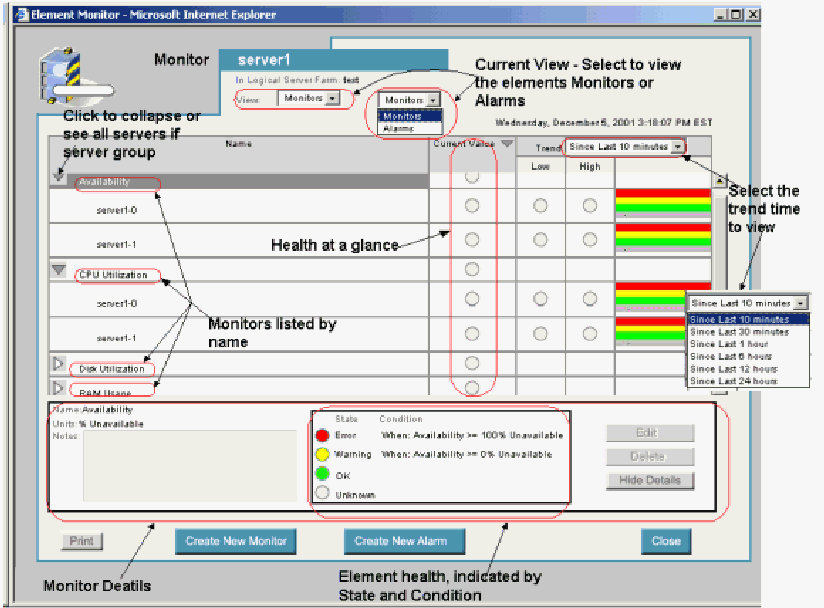
-
Select the desired view from the View drop-down list.
In this example, Monitors is selected. Note that using Alarms is similar to using the Monitoring screens.
To view Alarms, select Alarms in the field View, then select the alarm from the list of alarms and click Show Detail button to see the alarm details.
-
Click the right-arrow button next to an alarm or monitor to highlight the monitor or alarm.
-
Click the Show Detail button to display the monitor or alarm details.
-
Click on the graph column next to the Low/High columns to view a graph that indicates the monitors that are set up, for example, CPU Utilization.
-
To see detailed information about another monitor, double-click the monitor under Name.
For example, double-click Disk Utilization, RAM Usage, and SWAP Memory Usage. You can also double-click Hide Details and Show Details to close and open the detailed information.
Note –In view monitor screen, you cannot create, edit or delete monitors or alarms.
-
Click the Close button to close the Monitor or Alarm screen.
Unresponsive Servers
If the server becomes unresponsive for any reason, the performance monitors for CPU, disk, and memory change to unknown or gray. The availability monitor for the device turns red to indicate a failure.
After the problem has been addressed and the device is available again, you must click Commit in order to restart the monitors. SeeChapter 7, Troubleshooting in N1 Provisioning Server 3.1, Blades Edition, System Administration Guide for more information on failure recovery.
- © 2010, Oracle Corporation and/or its affiliates
