Setting Logging Levels for the PIX/PDQ Manager
By default, all logging components of the PIX/PDQ Manager are set to log at INFO levels, which provides general information about the processes being performed and includes warning and severe error messages. The logging level for lifecycle events in the PIX/PDQ Manager is set in the extralog lifecycle module; you can also modify the log level for any of the PIX/PDQ Manager loggers.
 To Set the Logging Level for the Lifecycle
Logger
-
Launch the GlassFish Admin Console.
-
In the left navigation panel, expand Applications, and then expand Lifecycle Modules.
-
Select extralog.
The Edit Lifecycle Module page appears. The extralog lifecycle has these additional properties:
-
selector – The event selector for the module. Leave this at its default value, solutiongroup in ('SUNPIXPDQ').
-
level – The log level for the PIX/PDQ Manager. By default this is set to FINEST, but you can modify the value.
-
filename – The name of the PIX/PDQ Manager log file. By default, this is pixpdq.log, and the file is located in glassfish-home/domains/domain-name/logs.
-
-
Update the Value column for the level property with any of these values, and then click save.
-
FINEST: Logs highly detailed tracing.
-
FINER: Logs reasonably detailed tracing.
-
FINE: Logs basic tracing.
-
CONFIG Logs static configuration messages.
-
INFO: Logs informative messages.
-
WARNING: Logs messages that indicate a warning.
-
SEVERE: Logs messages that indicate a severe failure.
-
OFF: No logging is performed.
-
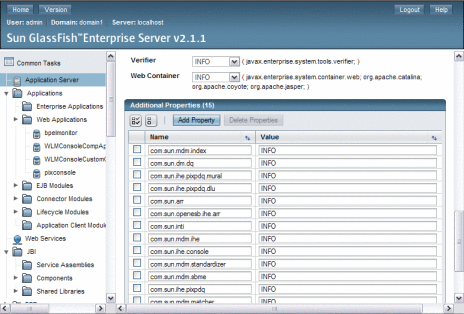
 To Set Logging Levels for PIX/PDQ Components
-
Launch the GlassFish Admin Console.
-
In the left navigation panel, click Application Server.
-
On the Application Server page, click the Logging tab, and then click the Log Levels subtab.
-
Scroll to the bottom of the page where the Additional Properties table is visible.

-
Update the Value column for any of the loggers listed in the table following this procedure. Enter any of the logging levels listed in the previous procedure.
-
If the logger you want to configure does not appear in the list, do the following:
-
When you are done setting logging levels, click Save.
Logger Name
Description
com.sun.mdm.index
Sun Master Index logger
com.sun.dm.dq
Master Data Management data quality logger
com.sun.inti
Master Index Standardization Engine logger
com.sun.mdm.matcher
Master Index Match Engine logger
com.sun.mdm.standardizer
Master Index Standardization Engine logger
com.sun.mdm.sbme
Master Index Match Engine logger
com.sun.ihe.pixpdq
PIX/PDQ EJB logger
com.sun.ihe.pixpdq.mural
Master Index Facade EJB logger
com.sun.ihe.pixpdq.dlu
Domain Lookup EJB logger
com.sun.mdm.ihe
PIX patient update notification logger
com.sun.arr
ATNA audit helper logger
com.sun.openesb.ihe.arr
ATNA audit repository and system log client logger
com.sun.mdm.ihe.audit
ATNA Audit Web Service EJB logger
com.sun.ihe.checkpoint
Checkpoint logger (for creating the message trace)
com.sun.ihe.console
PIX Console logger
- © 2010, Oracle Corporation and/or its affiliates
