Processor Events
The ripc tool gathers information about what processor events were encountered during the run of the application. The processor has event counters which are incremented either each time an event occurs or each cycle during the duration of an event. Using these counters it is possible to determine values for the cache miss rate, or the number of cycles lost due to cache misses.
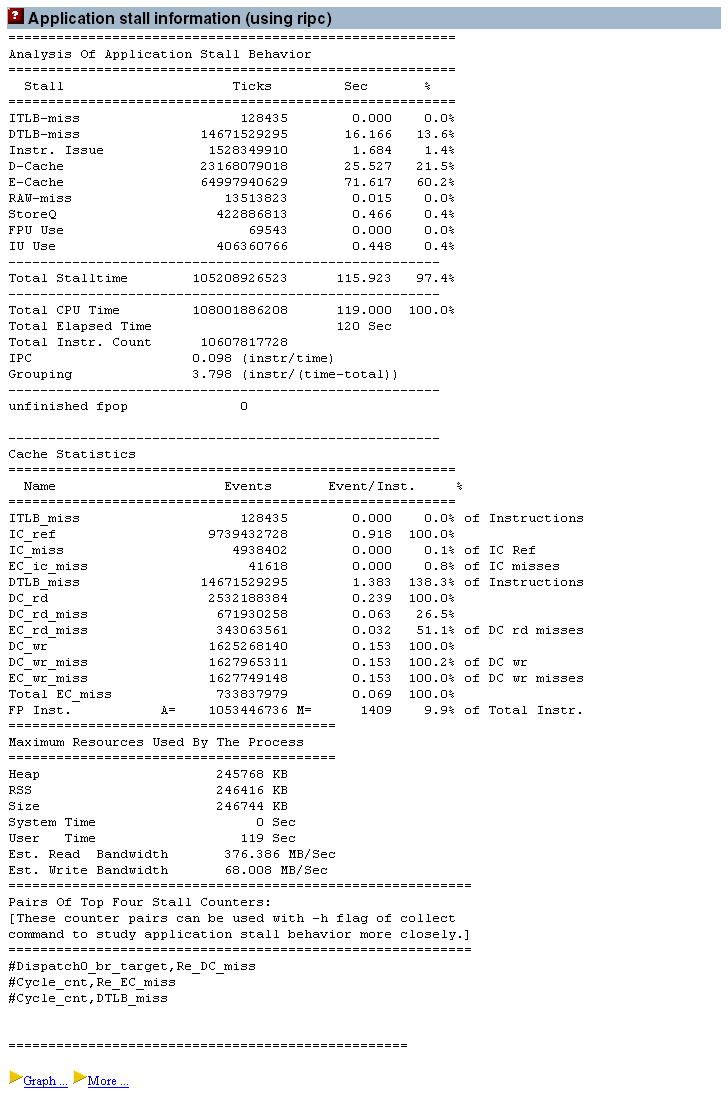
Figure 3–3 Application Stall Information Generated by the ripc Tool

The output from ripc is a text table. However, it will also generate a graph file if it locates the gnuplot software in the system’s path.
The output from the ripc tool contains several sections. The first section shows the percentage of the total number of cycles lost to each type of processor event. The names of the processor events are those that are used in the User’s Manual for the processor that spot software is running on (these are available from http://www.sun.com/processors/documentation.html). The events are different on different processors. For example an UltraSPARC-III will share some processor events with an UltraSPARC IV+, but other processor events will be different. An obvious example of this is where the UltraSPARC IV+ has a third level of cache which is not present on previous generations.
In this report for the example code shown in Figure 3–3, the time is lost due to Data Cache misses, External Cache misses and Data TLB misses. Together these three types of events account for nearly 98% of the execution count of the benchmark. The Data Cache miss time represents time spent by load instructions which found their data in the External Cache. The External Cache miss time is accumulated by load instructions where the data was not resident in either the Data Cache or the External Cache, and had to be fetched from memory. The Data TLB miss time is caused by memory accesses where the TLB mapping is not resident in the on-chip TLB, and has to be fetched using a trap to the operating system.
Immediately following the reports of percent time spent in the various stall events is a section which summarizes the efficiency of the entire run. The IPC is the number of instructions executed per cycle. The Grouping IPC is an estimate of what the IPC would be if the processor did not encounter any stall events.
After this section, there is a single line reporting the number of unfinished floating point traps. These traps can occur in some exceptional circumstances on most UltraSPARC processors. They can take a significant time to complete, and are also hard to observe in the profiles. Most of the time this count should be zero, but if there are a large number of such events, it is definitely worth investigating what is causing them.
Next, there is a section which reports the number of events that occurred as a proportion of the total number of opportunities for the events to occur. For example, the number of cache misses as a proportion of cache references.
The final numeric section is a report on the memory utilization for the application, and the user and system time.
A final part of the report is a note which the SPOT software uses to select the performance counters that should be profiled if more detail is required.
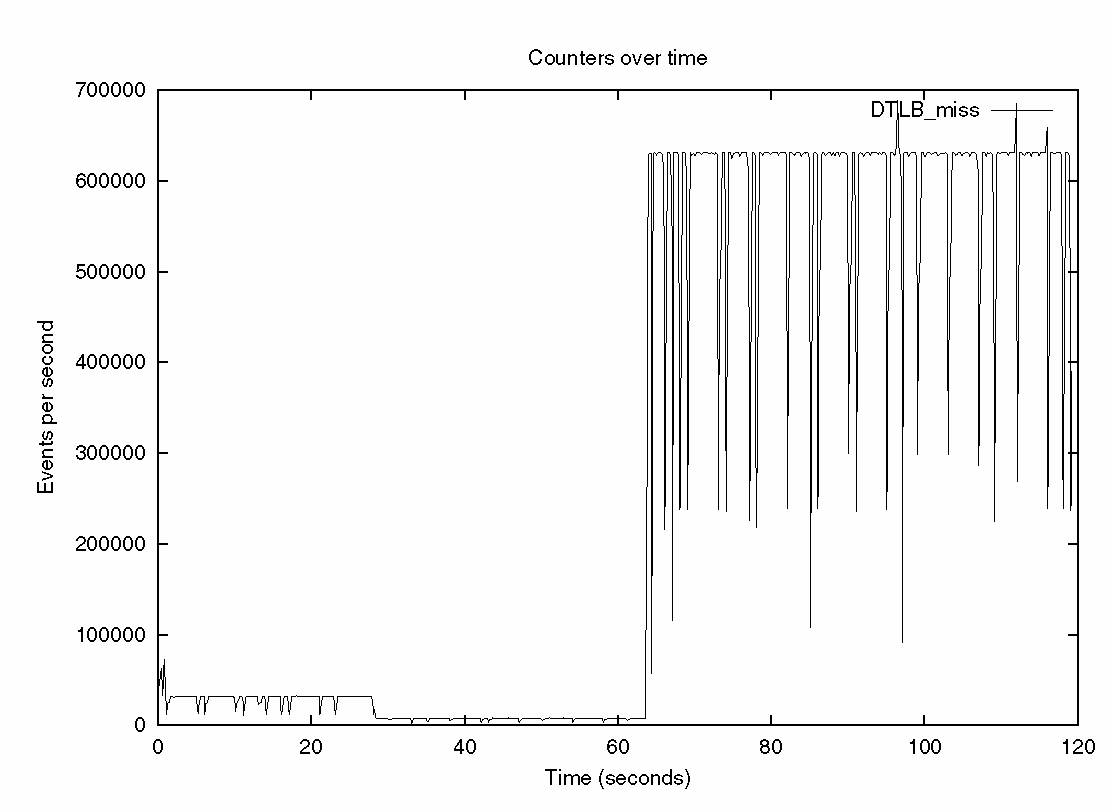
As mentioned earlier, the ripc tool will also produce a report of how the events occurred over the entire runtime. In Figure 3–4, the number of TLB misses is shown over the run of the application.
The tool ripc can also be invoked stand-alone, outside of spot. Type ripc -h to get a list of the options, and consult the ripc man page for more details.
Figure 3–4 Report Showing the Number of TLB Misses Over the Run of the Application

The three phases of the test application are clearly shown. There are few TLB misses in either of the first two phases, but large numbers are shown during the execution of the final tlb_misses routine.
- © 2010, Oracle Corporation and/or its affiliates
